1.公司业务调整,把一部分数据由Redis转至MongoDB,业务在测试环境正常,生产环境上线后发现压力一上来MongoDB的服务直接把CPU占满了,和开发的同学分析了一下也参考了一下百度上类似的问题,最后定位原因:未使用索引。
解决方法很简单:对应的关键字段创建索引即可。
参考命令如下:
>use Data; #进入数据库Data,注意区分大小写;
>db.stats(); #查看数据库的状态;
>db.getCollectionNames(); #查看所有表名;
>db.dynamic.find().limit(5); #查看dynamic表的前5条数据;
>db.dynamic.find().count(); #统计dynamic表总共有多少数据;
>db.dynamic.getIndexes(); #查询表dynamic的索引
#新建索引:对dynamic的score字段以backgroud方式建立索引
>db.dynamic.ensureIndex({score:1} , {backgroud:true});
#状态查看:20秒,每秒更新一次
mongostat -h 80.81.2.3 -p 27017 --rowcount 20 1
mingotop -h 80.81.2.3 -p 27017 --rowcount 20 1
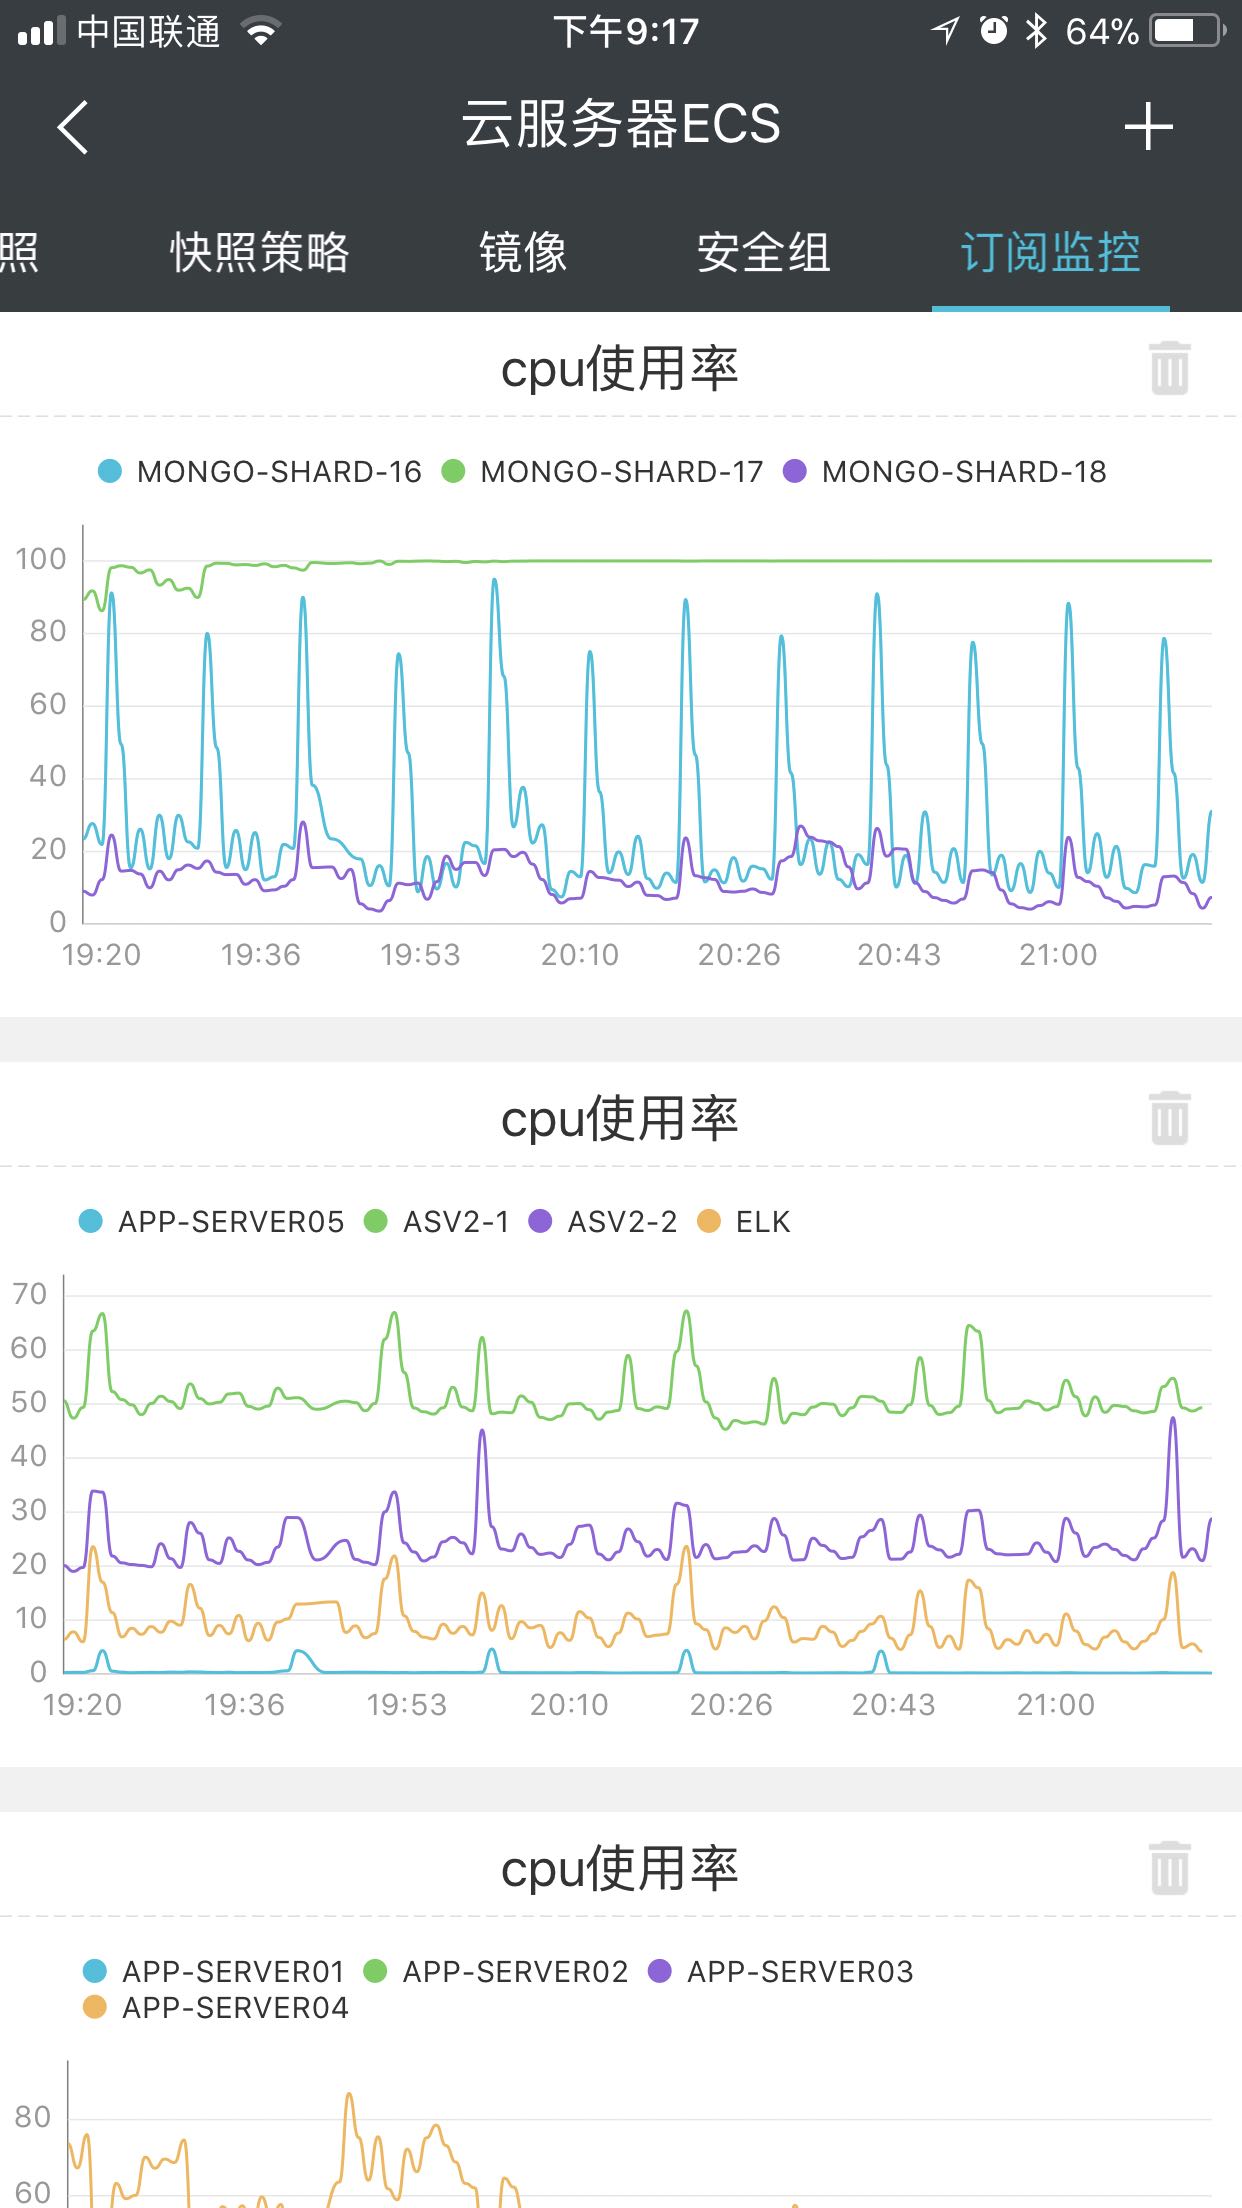
开始创建索引的字段没找准,效果不明显,后来对关键字段创建索引后CPU使用率断崖式下跌。
分析MongoDB数据库正在执行的请求
- 通过Mongo Shell连接实例。
- 执行
db.currentOp()命令,查看数据库当前正在执行的操作。
分析MongoDB数据库的慢请求
云数据库MongoDB默认开启了慢请求Profiling ,系统自动地将请求时间超过100ms的执行情况记录到对应数据库下的system.profile集合里。
- 通过 Mongo Shell 连接实例。
- 通过
use <database>命令进入指定数据库。use mongodbtest - 执行如下命令,查看该数据下的慢请求日志。
db.system.profile.find().pretty() - 分析慢请求日志,查找引起MongoDB CPU使用率升高的原因。
以下为某个慢请求日志示例,可查看到该请求进行了全表扫描,扫描了11000000个文档,没有通过索引进行查询。
{
        "op" : "query",
        "ns" : "123.testCollection",
        "command" : {
                "find" : "testCollection",
                "filter" : {
                        "name" : "zhangsan"
                },
                "$db" : "123"
        },
        "keysExamined" : 0,
        "docsExamined" : 11000000,
        "cursorExhausted" : true,
        "numYield" : 85977,
        "nreturned" : 0,
        "locks" : {
                "Global" : {
                        "acquireCount" : {
                                "r" : NumberLong(85978)
                        }
                },
                "Database" : {
                        "acquireCount" : {
                                "r" : NumberLong(85978)
                        }
                },
                "Collection" : {
                        "acquireCount" : {
                                "r" : NumberLong(85978)
                        }
                }
        },
        "responseLength" : 232,
        "protocol" : "op_command",
        "millis" : 19428,
        "planSummary" : "COLLSCAN",
        "execStats" : {
                "stage" : "COLLSCAN",
                "filter" : {
                        "name" : {
                                "$eq" : "zhangsan"
                        }
                },
                "nReturned" : 0,
                "executionTimeMillisEstimate" : 18233,
                "works" : 11000002,
                "advanced" : 0,
                "needTime" : 11000001,
                "needYield" : 0,
                "saveState" : 85977,
                "restoreState" : 85977,
                "isEOF" : 1,
                "invalidates" : 0,
                "direction" : "forward",
....in"
                }
        ],
        "user" : "root@admin"
}
通常在慢请求日志中,您需要重点关注以下几点。
- 全表扫描(关键字: COLLSCAN、 docsExamined )
- 全集合(表)扫描COLLSCAN 。
当一个操作请求(如查询、更新、删除等)需要全表扫描时,将非常占用CPU资源。在查看慢请求日志时发现COLLSCAN关键字,很可能是这些查询占用了你的CPU资源。说明 如果这种请求比较频繁,建议对查询的字段建立索引的方式来优化。
- 通过查看docsExamined的值,可以查看到一个查询扫描了多少文档。该值越大,请求所占用的CPU开销越大。
- 全集合(表)扫描COLLSCAN 。
- 不合理的索引(关键字: IXSCAN、keysExamined )
通过查看keysExamined字段,可以查看到一个使用了索引的查询,扫描了多少条索引。该值越大,CPU开销越大。
如果索引建立的不太合理,或者是匹配的结果很多。这样即使使用索引,请求开销也不会优化很多,执行的速度也会很慢。
如下所示,假设某个集合的数据,x字段的取值很少(假设只有1、2),而y字段的取值很丰富
{ x: 1, y: 1 }{ x: 1, y: 2 } { x: 1, y: 3 } ...... { x: 1, y: 100000} { x: 2, y: 1 } { x: 2, y: 2 } { x: 2, y: 3 } ...... { x: 1, y: 100000}要实现 {x: 1, y: 2} 这样的查询。
db.createIndex( {x: 1} )         效果不好,因为x相同取值太多
db.createIndex( {x: 1, y: 1} )   效果不好,因为x相同取值太多
db.createIndex( {y: 1 } )        效果好,因为y相同取值很少
db.createIndex( {y: 1, x: 1 } )  效果好,因为y相同取值少
关于{y: 1} 与 {y: 1, x: 1} 的区别,可参考MongoDB索引原理及复合索引官方文档。
- 大量数据排序(关键字: SORT、hasSortStage )
-
当查询请求里包含排序的时候, system.profile 集合里的 hasSortStage 字段会为 true 。如果排序无法通过索引满足, MongoDB 会在查询结果中进行排序。而排序这个动作将非常消耗CPU资源,这种情况需要对经常排序的字段建立索引的方式进行优化。
- 连接数
1、mongodb最大的连接数是819,在启动里面加参数 --maxConns=3000重启mongodb服务后最大连接数还是819。
2、其实是linux系统的限制,Linux系统默认一个进程最大文件打开数目为1024。需要修改此限制
3、因为将mongodb添加到开机启动里面,需要在rc.local文件下面加ulimit -n 的限制
vi /etc/rc.local
ulimit -n 20000
rm /usr/mongodb/log/mongodb.log
/usr/mongodb/bin/mongod --dbpath=/usr/mongodb/data/ --logpath=/usr/mongodb/log/mongodb.log --master --oplogSize 200
然后重启机器再次查看mongodb的最大连接数发现变了
[root@DB192168129044 bin]# ./mongo
MongoDB shell version: 2.2.0
connecting to: test
> db.serverStatus()。connections;
{ “current” : 1, “available” : 15999 }
MongoDB的CPU使用率高最佳实践
问题症状
mongodb 实例在日常使用中,有时会出现 CPU使用达到 80%以上 的情况。
问题原因
1、耗时的请求
1.1、全表扫描
关键字:COLLSCAN、 docsExamined
1.2、不合理的索引
关键字:IXSCAN、keysExamined
1.3、大量数据排序
关键字:SORT、hasSortStage
2、服务器能力达到上限
整个数据库的查询非常合理,所有的请求都是高效的走了索引,基本没有优化的空间了,就是机器的服务能力已经达到上限了,应该升级配置了
3、服务器被攻击
通过分析端口连接数,来源IP,日志确认来源IP的访问内容
3.1 查看端口连接数
[root@MONGO-17 ~]# netstat -anp | grep 22001 | wc -l
3.2 查看端口连接来源IP
[root@MONGO-17 ~]# netstat -n | grep 22001 |awk '/^tcp/ {print $5}'| awk -F: '{print $1}' | sort | uniq -c | sort -rn
3.3 查看日志来源IP是什么程序访问
[root@mnkj-db02 data]# netstat -anp | egrep 120.78.231.86:5[0-9]*
tcp 50 0 120.78.231.86:55402 106.11.68.13:80 ESTABLISHED 21343/wrapper
排查步骤
1、资源查看
1.1 占用CPU高的进程
[root@MONGO-17 ~]# top
top - 10:04:09 up 131 days, 17:30,  1 user,  load average: 3.85, 2.97, 2.81
Tasks: 189 total,   1 running, 188 sleeping,   0 stopped,   0 zombie
%Cpu0  : 35.6 us,  2.4 sy,  0.0 ni, 61.7 id,  0.0 wa,  0.0 hi,  0.3 si,  0.0 st
%Cpu1  : 37.7 us,  3.3 sy,  0.0 ni, 58.7 id,  0.0 wa,  0.0 hi,  0.3 si,  0.0 st
%Cpu2  : 59.5 us,  4.1 sy,  0.0 ni, 36.5 id,  0.0 wa,  0.0 hi,  0.0 si,  0.0 st
%Cpu3  : 32.6 us,  3.4 sy,  0.0 ni, 64.1 id,  0.0 wa,  0.0 hi,  0.0 si,  0.0 st
%Cpu4  : 38.7 us,  3.4 sy,  0.0 ni, 57.6 id,  0.0 wa,  0.0 hi,  0.3 si,  0.0 st
%Cpu5  : 32.9 us,  2.4 sy,  0.0 ni, 64.7 id,  0.0 wa,  0.0 hi,  0.0 si,  0.0 st
%Cpu6  : 44.0 us,  2.7 sy,  0.0 ni, 53.4 id,  0.0 wa,  0.0 hi,  0.0 si,  0.0 st
%Cpu7  : 42.4 us,  3.7 sy,  0.0 ni, 53.6 id,  0.0 wa,  0.0 hi,  0.3 si,  0.0 st
%Cpu8  : 45.1 us,  3.4 sy,  0.0 ni, 51.2 id,  0.0 wa,  0.0 hi,  0.3 si,  0.0 st
%Cpu9  : 66.9 us,  5.4 sy,  0.0 ni, 27.4 id,  0.0 wa,  0.0 hi,  0.3 si,  0.0 st
%Cpu10 : 35.8 us,  3.4 sy,  0.0 ni, 60.8 id,  0.0 wa,  0.0 hi,  0.0 si,  0.0 st
%Cpu11 : 34.3 us,  3.5 sy,  0.0 ni, 59.2 id,  0.0 wa,  0.0 hi,  3.1 si,  0.0 st
%Cpu12 : 37.5 us,  2.7 sy,  0.0 ni, 59.8 id,  0.0 wa,  0.0 hi,  0.0 si,  0.0 st
%Cpu13 : 45.3 us,  3.7 sy,  0.0 ni, 51.0 id,  0.0 wa,  0.0 hi,  0.0 si,  0.0 st
%Cpu14 : 68.9 us,  2.7 sy,  0.0 ni, 28.4 id,  0.0 wa,  0.0 hi,  0.0 si,  0.0 st
%Cpu15 : 43.6 us,  2.7 sy,  0.0 ni, 53.4 id,  0.0 wa,  0.0 hi,  0.3 si,  0.0 st
KiB Mem : 32780412 total,   274896 free, 20882888 used, 11622628 buff/cache
KiB Swap:        0 total,        0 free,        0 used. 11440020 avail Mem

  PID USER      PR  NI    VIRT    RES    SHR S  %CPU %MEM     TIME+ COMMAND
24406 root      20   0 28.204g 0.018t   5976 S 919.6 58.4 477312:14 mongod
24297 root      20   0 3008300 1.148g   6456 S   0.7  3.7   1354:41 mongod
 7823 zabbix    20   0   15372   1028    804 S   0.3  0.0   3:46.26 zabbix_agentd
1.2 确定占用CPU高的进程和线程
# 获取进程id 24406
[root@MONGO-17 ~]# ps -ef | grep 24406
 /opt/mongodb/bin/mongod --shardsvr --replSet shard17 --port 22001 --dbpath /data/mongodb/shard1/data --auth --keyFile=/opt/mongodb/key/authfile --logpath /data/mongodb/shard1/logs/shard.log --fork

 # 查看进程的线程top -p 24406 按 shift+h 查看cpu高的线程,查找线程点用cpu高且cpu时间很长
 [root@MONGO-17 tmp]# top -p 24406
top - 13:44:28 up 131 days, 21:10,  2 users,  load average: 1.19, 2.34, 2.17
Tasks:   1 total,   0 running,   1 sleeping,   0 stopped,   0 zombie
%Cpu(s):  1.4 us,  0.2 sy,  0.0 ni, 98.4 id,  0.0 wa,  0.0 hi,  0.0 si,  0.0 st
KiB Mem : 32780412 total,  3806372 free, 20931264 used,  8042776 buff/cache
KiB Swap:        0 total,        0 free,        0 used. 11391328 avail Mem

  PID USER      PR  NI    VIRT    RES    SHR S  %CPU %MEM     TIME+ COMMAND
24406 root      20   0 28.199g 0.018t   5772 S  23.6 58.5 477924:55 mongod
top - 13:46:33 up 131 days, 21:13,  2 users,  load average: 3.11, 2.37, 2.18
Threads: 812 total,   5 running, 807 sleeping,   0 stopped,   0 zombie
%Cpu(s): 31.7 us,  1.2 sy,  0.0 ni, 67.0 id,  0.0 wa,  0.0 hi,  0.1 si,  0.0 st
KiB Mem : 32780412 total,  3767812 free, 20957716 used,  8054884 buff/cache
KiB Swap:        0 total,        0 free,        0 used. 11363284 avail Mem

  PID USER      PR  NI    VIRT    RES    SHR S %CPU %MEM     TIME+ COMMAND
25421 root      20   0 28.348g 0.018t   5772 R 95.4 58.5   4544:58 conn173
14810 root      20   0 28.255g 0.021t   5592 R 99.7 67.3   0:11.06 conn3223924
 2360 root      20   0 28.255g 0.021t   5592 R 93.0 67.3 133:33.64 conn3118924
11174 root      20   0 28.255g 0.021t   5592 R 46.5 67.3 182:49.85 conn3125456
 1514 root      20   0 28.255g 0.021t   5592 S 41.2 67.3 191:05.51 conn3118283
15026 root      20   0 28.255g 0.021t   5592 R 28.9 67.3 159:31.74 conn3128335
11941 root      20   0 28.218g 0.018t   5776 R 99.7 58.7   0:25.09 conn3221759
12277 root      20   0 28.218g 0.018t   5776 R 99.7 58.7   0:11.82 conn3222028
1.3 分析占用CPU高的线程ID执行内容
# 获取12月14号00:00pm 到12月14号07:30pm执行超过1000ms查询
[root@MONGO-17 tmp]# mlogfilter /data/mongodb/shard1/logs/shard.log --slow 1000 --from 2017-12-14 00:00 --to 2017-12-14 7:30 > /tmp/121400_07.log

# 截取线程ID 25421的线程执行的内容
[root@MONGO-17 tmp]# sed -n '/[conn173]/p' 121400.log
2017-12-14T14:00:56.590+0800 W COMMAND [conn173] Use of the aggregate command without the 'cursor' option is deprecated. See http://dochub.mongodb.org/core/aggregate-without-cursor-deprecation.
1.4 分析mongodb shard.log日志
#安装mtools

# 获取12月13号凌晨开始执行超过1000ms的前20条查询,结果见附件《121300_20.txt》
[root@MONGO-17 logs]# mlogfilter shard.log --from 2017-12-13 0:00 --slow 1000 | head -n20 > /tmp/121300_20.txt

# 获取日志基本信息
[root@MONGO-17 logs]# mloginfo shard.log
     source: shard.log
       host: MONGO-17:22001
      start: 2017 Sep 12 01:08:48.487
        end: 2017 Dec 14 10:15:56.643
date format: iso8601-local
     length: 33471780
     binary: mongod
    version: 3.4.7
    storage: wiredTiger

# 获取12月11号凌晨开始语句的执行次数、用时等统计信息
[root@MONGO-17 logs]# mlogfilter shard.log --from 2017-12-11 0:00 > /tmp/121100.log
[root@MONGO-17 tmp]# mloginfo 121100.log --queries > /tmp/queries.txt
[root@MONGO-17 tmp]# head -n 20 queries.txt
2、分析mongodb统计数据
2.1 monogtop 统计信息
[root@MONGO-17 tmp]# /opt/mongodb/bin/mongotop -h 127.0.0.1:22001 -udbadmin -pxxx --authenticationDatabase=admin
2017-12-14T11:30:39.461+0800    Failed: error connecting to db server: server returned error on SASL authentication step: Authentication failed.
该用户无法在admin库下认证成功,当前只对mongos开启了认证
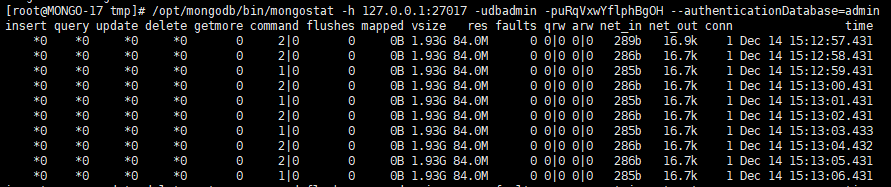
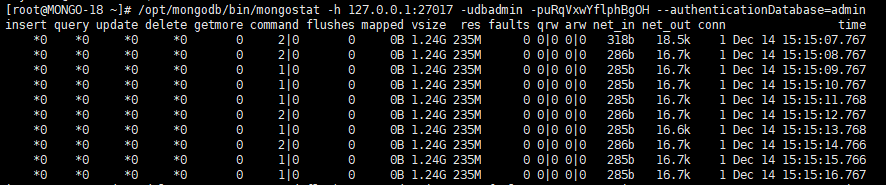
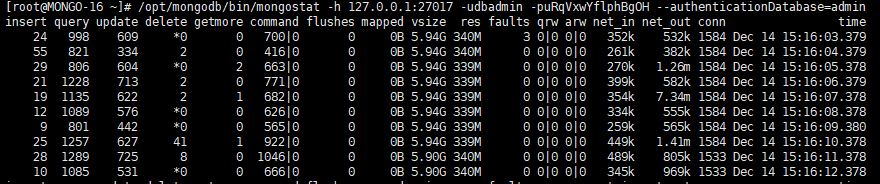
2.2 mongostat统计信息
2.3 mongodb 状态查看
[root@MONGO-16 ~]# echo 'db.serverStatus().connections' | /opt/mongodb/bin/mongo 127.0.0.1:27017/admin -udbadmin -puRqVxwYflphBgOH
MongoDB shell version v3.4.7
connecting to: mongodb://127.0.0.1:27017/admin
MongoDB server version: 3.4.7
{ "current" : 1564, "available" : 50864, "totalCreated" : 116536 }
三、扩展信息
- mongotop可以查看MongoDB实例花销在读数据或写数据上的时间,它提供集合级别的统计数据
- mongostat是提供数据库级别的统计数据
四、建议
- 由分析mongodb的shard日志,omdmain.item_region、stock.region_product_inventory、order.order集合find操作关键字:IXSCAN,走不合理的索引以及执行count操作时间过长导致CPU飙高的主要原因。
- 建议调整索引继续观察