This guide will walk you through connecting Microsoft Power BI to a MongoDB DataSet using our MongoDB certified ODBC driver.
Microsoft Power BI enables rich data visualization of your company’s data through its suite of analytics tools, letting you easily analyze and share insights in any device. Here’s how to take this awesome BI tool and integrate it with MongoDB data to take it to the next level.
Note: This guide assumes you have MongoDB installed with the “Restaurants” MongoDB Data Set. The “Restaurants” MongoDB Data Set can be found here.
-
Determine whether your version of PowerBI is 32bit or 64bit. Then, download + install the corresponding free 15 day trial of the DataDirect for MongoDB ODBC driver.
Navigate to the Progress DataDirect for ODBC Installation directory and click on the ODBC Administrator.
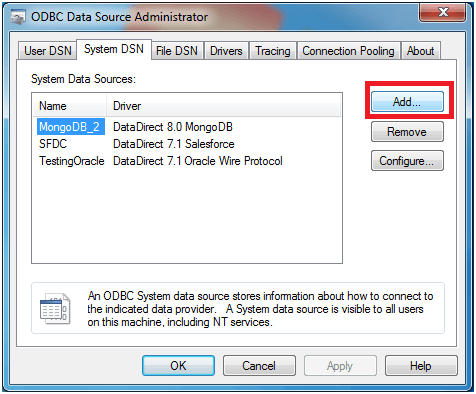
Click on User or System DSN and click Add:
-
Select DataDirect 8.0 MongoDB.
Configure the Data Sources by filling out a Data Source Name, the Host Name, Port Number, and which Database within MongoDB you want to connect to (you may chose to leave this blank if you prefer). The Schema Definition Path will be automatically generated for you, but feel free to click on the Browse button in order to change the location of the schema or rename it. Schema Tool Note: The DataDirect MongoDB 8.0 driver will automatically generate a schema for you without you having to open up the Schema Tool!
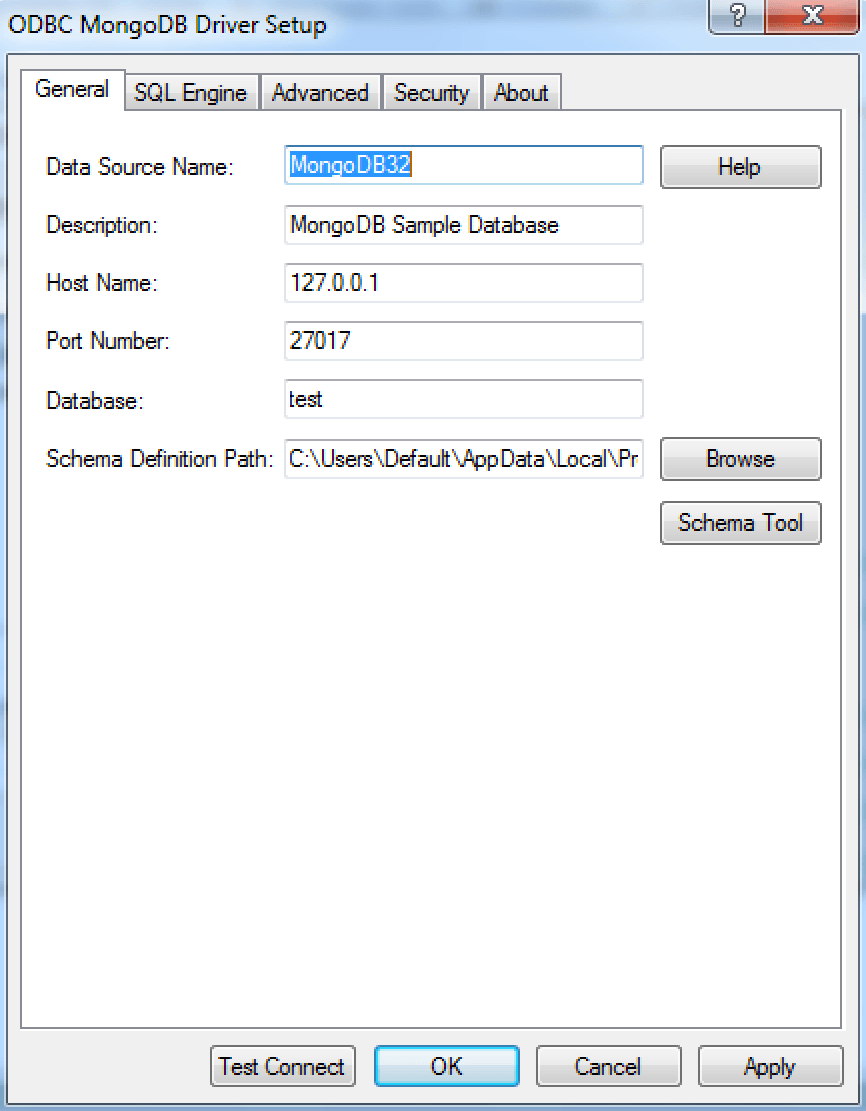
Click on Test Connect and ensure that your connection is established.
-
Launch Microsoft Power BI and select New Report:
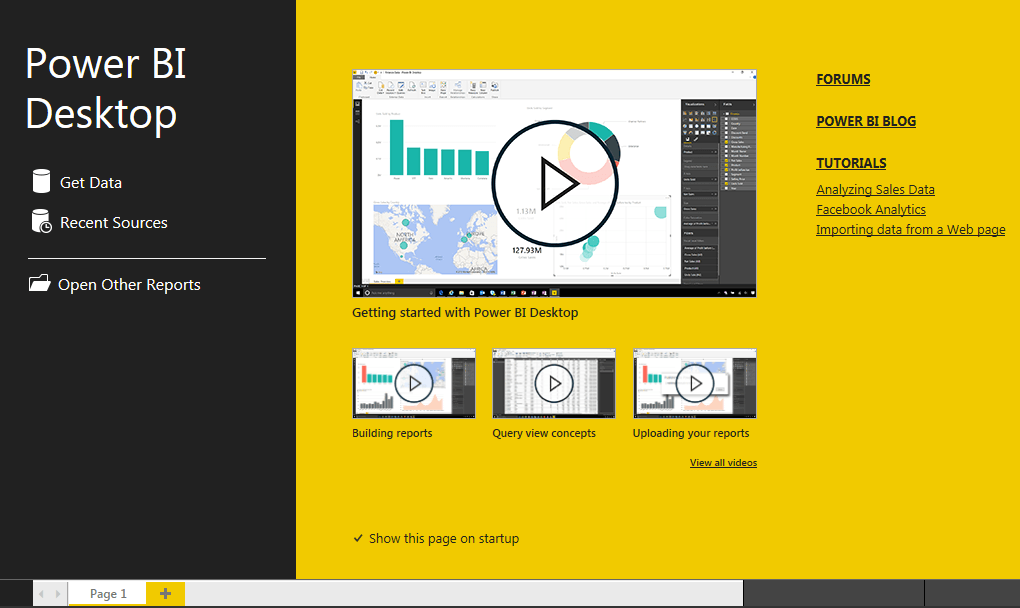
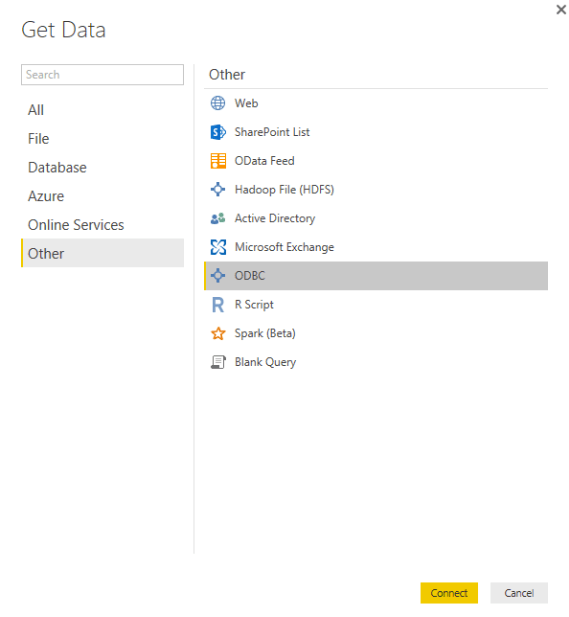
- Select ‘Get Data’ > Other > ODBC and click Connect:
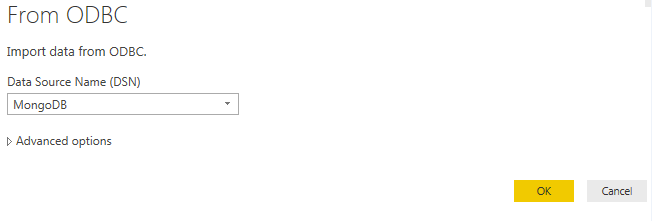
- Select your MongoDB Data Source Name from the drop down window and select OK:
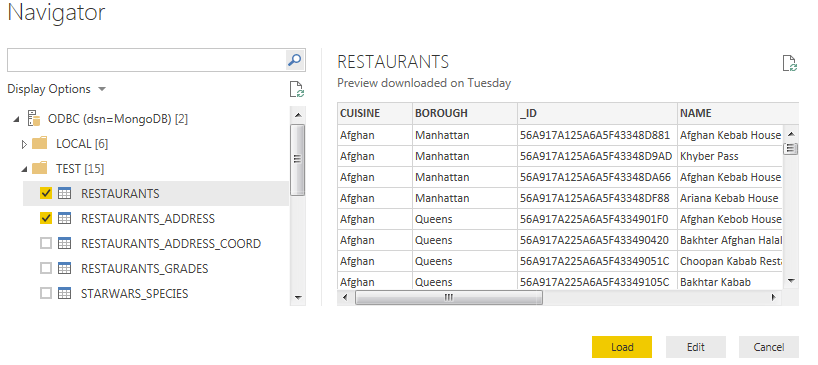
From the Navigator pane, select the MongoDB data you would like to use in PowerBI. In our case, we are selecting Restaurants and Restaurants_Address for our Visualization.
Select Load.
- You can now see your selected tables in PowerBI on the right hand side of the screen under “Fields.”
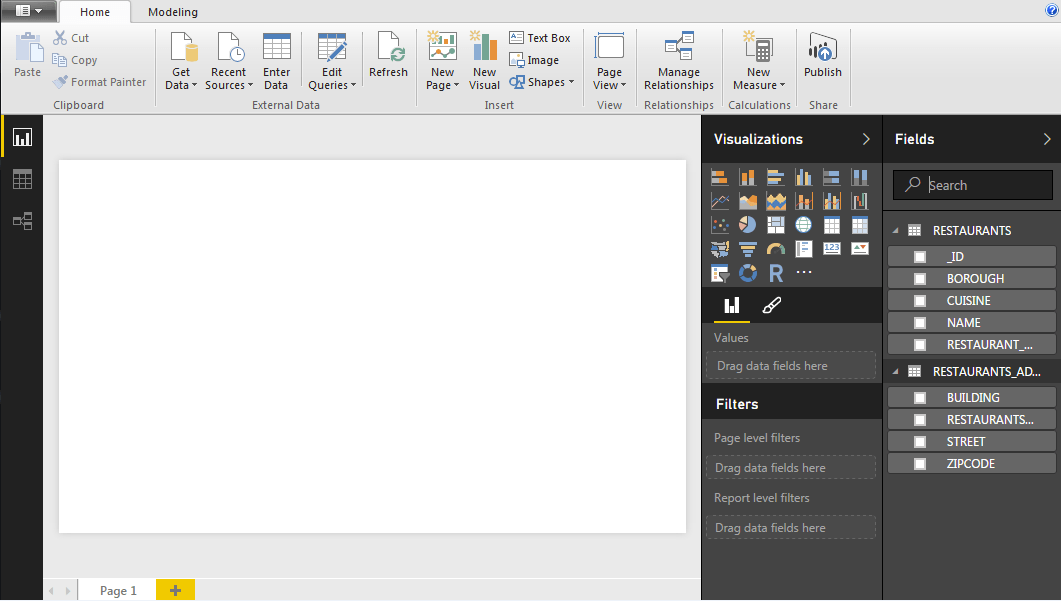
- Next, select the Fields from your MongoDB that you’d like to use in your Visualization. In our case, we are going to select Restaurants (Cuisine) and Restaurants_Address (Zipcode).
-and-restaurants_address-(zipcode).png?sfvrsn=b35e1e13_0)
-
Then, select the Filled Map Visualization indicated by a this icon
 .
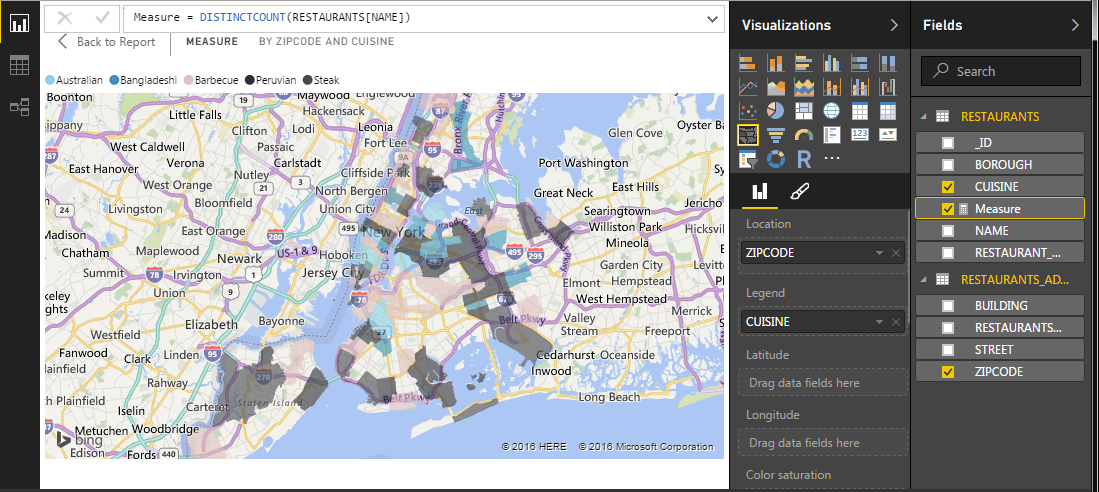
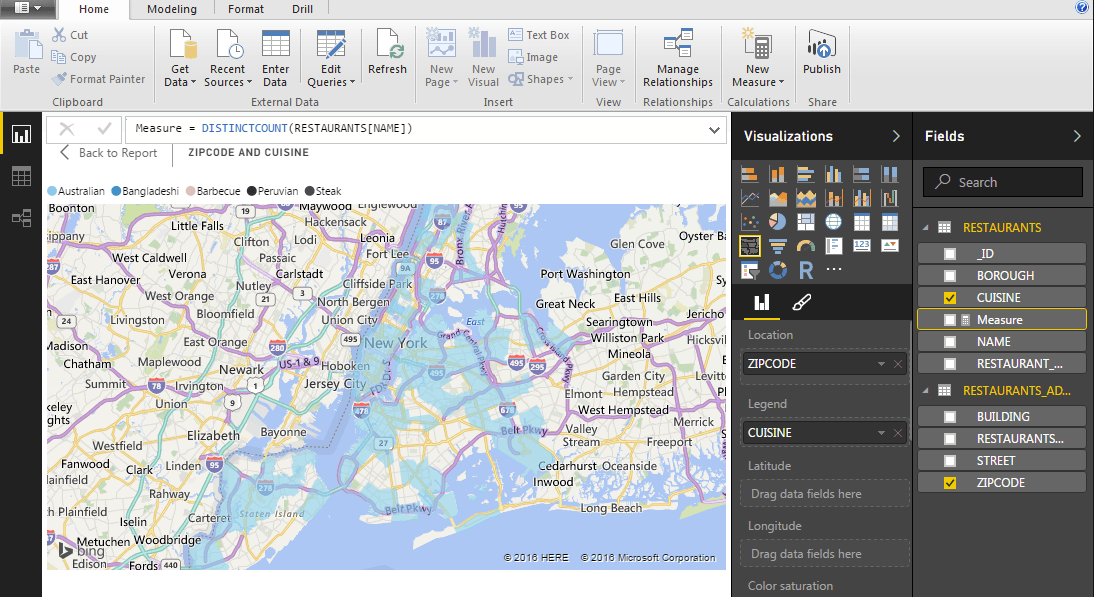
.You will then see your data transformed into a map visualization representing all of the different types of cuisines located in our geographic area (in this case, the greater New York City area).
-
Suppose we wanted to count the different types of restaurants by cuisine in each zip code? We can easily accomplish this, adding a “New Measure” by selecting the New Measure icon from the toolbar under Calculations.
Our New Measure is going to count the number of restaurants in each zip code for us. So we will use Measure = DISTINCTCOUNT(RESTAURANTS[NAME])
![DISTINCTCOUNT(RESTAURANTS[NAME]) DISTINCTCOUNT(RESTAURANTS[NAME])](https://d117h1jjiq768j.cloudfront.net/images/default-source/default-album/distinctcount(restaurants-name-).png?sfvrsn=3526e55e_0)
Our map now reflects the count of each type of Cuisine by zip code.
