Solution in glance
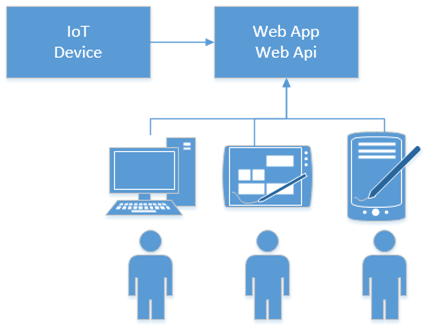
The following diagram illustrates our solution where IoT device reports readings to web site and users can see readings in real time.

There is IoT device that reports sensors readings to ASP.NET Core application. Users open the site in their browsers and they will see readings in real-time. Readings are shown as table and visualized as a line chart.
NB! Those who are interested in playing with Visual Studio 2017 solution and source code can find it from AspNetCoreRealTimeChart Github repository.
Adding WebSocket support
First we go and visit Radu Matei’s blog and take some code from there. Of course, we give him cookie and credits for his excellent writing Creating a WebSockets middleware for ASP .NET Core. We use a little modified version of his WebSocketManager class.
public class TemperatureSocketManager
{
    private static ConcurrentDictionary<string, WebSocket> _sockets = new ConcurrentDictionary<string, WebSocket>();

    public WebSocket GetSocketById(string id)
    {
        return _sockets.FirstOrDefault(p => p.Key == id).Value;
    }

    public ConcurrentDictionary<string, WebSocket> GetAll()
    {
        return _sockets;
    }

    public string GetId(WebSocket socket)
    {
        return _sockets.FirstOrDefault(p => p.Value == socket).Key;
    }
    public string AddSocket(WebSocket socket)
    {
        var id = CreateConnectionId();
        _sockets.TryAdd(CreateConnectionId(), socket);

        return id;
    }

    public async Task RemoveSocket(string id)
    {
        WebSocket socket;
        _sockets.TryRemove(id, out socket);

        await socket.CloseAsync(closeStatus: WebSocketCloseStatus.NormalClosure,
                                statusDescription: "Closed by the WebSocketManager",
                                cancellationToken: CancellationToken.None);
    }

    private string CreateConnectionId()
    {
        return Guid.NewGuid().ToString();
    }

    public async Task SendMessageToAllAsync(string message)
    {
        foreach (var pair in _sockets)
        {
            if (pair.Value.State == WebSocketState.Open)
                await SendMessageAsync(pair.Value, message);
        }
    }

    private async Task SendMessageAsync(WebSocket socket, string message)
    {
        if (socket.State != WebSocketState.Open)
            return;

        await socket.SendAsync(buffer: new ArraySegment<byte>(array: Encoding.ASCII.GetBytes(message),
                                                                offset: 0,
                                                                count: message.Length),
                                messageType: WebSocketMessageType.Text,
                                endOfMessage: true,
                                cancellationToken: CancellationToken.None);
    }
}
We also need WebSocket middleware to keep internal sockets dictionary fresh. Here we will use a little modified version of Radu Matei’s WebSocket middleware.
public class TemperatureSocketMiddleware
{
    private readonly RequestDelegate _next;
    private readonly TemperatureSocketManager _socketManager;

    public TemperatureSocketMiddleware(RequestDelegate next,
                                        TemperatureSocketManager socketManager)
    {
        _next = next;
        _socketManager = socketManager;
    }

    public async Task Invoke(HttpContext context)
    {
        if (!context.WebSockets.IsWebSocketRequest)
        {
            await _next.Invoke(context);
            return;
        }

        var socket = await context.WebSockets.AcceptWebSocketAsync();
        var id = _socketManager.AddSocket(socket);

        await Receive(socket, async (result, buffer) =>
        {
            if (result.MessageType == WebSocketMessageType.Close)
            {
                await _socketManager.RemoveSocket(id);
                return;
            }
        });
    }

    private async Task Receive(WebSocket socket, Action<WebSocketReceiveResult, byte[]> handleMessage)
    {
        var buffer = new byte[1024 * 4];

        while (socket.State == WebSocketState.Open)
        {
            var result = await socket.ReceiveAsync(buffer: new ArraySegment<byte>(buffer),
                                                    cancellationToken: CancellationToken.None);

            handleMessage(result, buffer);
        }
    }
}
Now let’s add reference to Microsoft.AspNetCore.WebSockets NuGet package and wire WebSocket stuff to application. We use Configure() method of Startup class for this.
app.UseStaticFiles();
app.UseWebSockets();
app.UseMiddleware<TemperatureSocketMiddleware>();

app.UseMvc(routes =>
{
    routes.MapRoute(
        name: "default",
        template: "{controller=Home}/{action=Index}/{id?}");
});
We have to register also WebSocket manager as a service to be able to broadcast data to browsers. Here is the ConfigureServices() method of application Startup class.
public void ConfigureServices(IServiceCollection services)
{
    services.AddMvc();
    services.AddSingleton<TemperatureSocketManager>();
}
Now we have everything we need to support WebSockets in out application.
Web API for IoT device
We need some web end-point where IoT device can send sensor readings.
public class ApiController : Controller
{
    private readonly TemperatureSocketManager _socketManager;

    public ApiController(TemperatureSocketManager socketManager)
    {
        _socketManager = socketManager;
    }

    public async Task Report(double liquidTemp)
    {
        var reading = new
        {
            Date = DateTime.Now,
            LiquidTemp = liquidTemp
        };

        await _socketManager.SendMessageToAllAsync(JsonConvert.SerializeObject(reading));
    }

    public async Task Generate()
    {
        var rnd = new Random();

        for(var i = 0; i < 100; i++)
        {
            await Report(rnd.Next(23, 35));
            await Task.Delay(5000);
        }
    }
}
Report() method accepts one sensor reading per time and broadcasts it to all registered sockets. Generate() method is there to simulate sensor that reports data. We can use this method if we don’t have any IoT device in our network.
Building user interface
Let’s build user interface for our solution to display real-time data to users. We start with simple home controller that just servers some views with no additional work.
public class HomeController : Controller
{
    public IActionResult Index()
    {
        return View();
    }

    public IActionResult Error()
    {
        return View();
    }
}
Home view of Index controller is also simple. There are references to some D3 chart and Knockout related scripts. We will come back to these later. The view has placeholder for D3 chart. There is also table where sensor readings are displayed.
@{
    ViewData["Title"] = "Home Page";
}
<div class="row">
    <div class="col-lg-8 bigChart" data-bind="lineChart: lineChartData"></div>
    <div class="col-lg-4">
        <table class="table">
            <thead>
                <tr>
                    <th>#</th>
                    <th>Time</th>
                    <th>Temperature</th>
                </tr>
            </thead>
            <tbody data-bind="foreach: lineChartData">
                <tr>
                    <td data-bind="text: $index() + 1"></td>
                    <td data-bind="text: Date.toLocaleTimeString()"></td>
                    <td data-bind="text: LiquidTemp"></td>
                </tr>
            </tbody>
        </table>
    </div>
</div>

@section Scripts {
    <script src="~/js/data-view-model.js"></script>
    <script src="~/js/line-chart-binding.js"></script>

    <script>
        var D3KD = this.D3KD || {};

        (function () {
            "use strict";
            var dataViewModel = new D3KD.dataViewModel();

            var protocol = location.protocol === "https:" ? "wss:" : "ws:";
            var wsUri = protocol + "//" + window.location.host;
            var socket = new WebSocket(wsUri);

            socket.onmessage = function (e) {
                var reading = JSON.parse(e.data);
                reading.Date = new Date(reading.Date);

                dataViewModel.addDataPoint(reading);
            };

            ko.applyBindings(dataViewModel);
        }());
    </script>
}
When page is loaded then WebSocket connection is established and script starts listening to WebSocket. When data comes in the script sets Date property to JavaScript date and adds reading to Knockout array of data model.
Before wiring everything together let’s also modify layout view. I removed environment based mess from layout view and made popular scripts to be downloaded from CDN-s.
<!DOCTYPE html>
<html>
<head>
<meta charset="utf-8" />
<meta name="viewport" content="width=device-width, initial-scale=1.0" />
<title>@ViewData["Title"] - AspNetCoreRealTimeChart</title>
<link rel="stylesheet" href="https://ajax.aspnetcdn.com/ajax/bootstrap/3.3.7/css/bootstrap.min.css" />
<link rel="stylesheet" href="~/css/site.css" asp-append-version="true" />
</head>
<body>
<nav class="navbar navbar-inverse navbar-fixed-top">
<div class="container">
<div class="navbar-header">
<button type="button" class="navbar-toggle" data-toggle="collapse" data-target=".navbar-collapse">
<span class="sr-only">Toggle navigation</span>
<span class="icon-bar"></span>
<span class="icon-bar"></span>
<span class="icon-bar"></span>
</button>
<a asp-area="" asp-controller="Home" asp-action="Index" class="navbar-brand">AspNetCoreRealTimeChart</a>
</div>
<div class="navbar-collapse collapse">
<ul class="nav navbar-nav">
<li><a asp-area="" asp-controller="Home" asp-action="Index">Home</a></li>
</ul>
</div>
</div>
</nav>
<div class="container body-content">
@RenderBody()
<hr />
<footer>
<p>© 2017 - AspNetCoreRealTimeChart</p>
</footer>
</div>
<script src="https://ajax.aspnetcdn.com/ajax/jquery/jquery-2.2.0.min.js"></script>
<script src="https://ajax.aspnetcdn.com/ajax/bootstrap/3.3.7/bootstrap.min.js"></script>
<script src="http://d3js.org/d3.v3.min.js"></script>
<script src="http://knockoutjs.com/downloads/knockout-3.0.0.js"></script>
@RenderSection("Scripts", required: false)
</body>
</html>
With visible part of user interface we are done now and it’s time to stitch all parts together.
Displaying real-time data
As we are using D3 chart and Knockout to display real-time data we need some classes to bind these two together. I found d3-knockout-demo by Teodor Elstad where this problem is solved. It’s simple demo you can download to your machine and run it directly from directory. It doesn’t need any external data services to work. We start with data model class that is simplified to minimum.The code below goes to data-view-model.js file (see Index view of home controller).
/*global ko, setInterval*/

var D3KD = this.D3KD || {};

(function (namespace) {
    "use strict";
    namespace.dataViewModel = function () {
        var self = this;

        self.lineChartData = ko.observableArray();
        self.addDataPoint = function (point) {
            if (self.lineChartData().length >= 10) {
                self.lineChartData.shift();
            }

            self.lineChartData.push(point);
        };
    };
}(D3KD));
The data model class holds Knockout observable array with readings. It also has addDataPoint() method that adds new reading to array. It aslo avoids array to grow over 10 elements. If array already has 10 readings then first reading is removed before new one is added.
To keep chart up to date we need Knockout bindingHandler. This comes also from Teodor’s demo project and it goes to line-chart-binding.js file (see Index view of home controller).
/*global ko, d3*/

ko.bindingHandlers.lineChart = {
    init: function (element) {
        "use strict";

        var margin = { top: 20, right: 20, bottom: 30, left: 50 },
            elementWidth = parseInt(d3.select(element).style("width"), 10),
            elementHeight = parseInt(d3.select(element).style("height"), 10),
            width = elementWidth - margin.left - margin.right,
            height = elementHeight - margin.top - margin.bottom,

            svg = d3.select(element).append("svg")
                .attr("width", width + margin.left + margin.right)
                .attr("height", height + margin.top + margin.bottom)
                .append("g")
                .attr("transform", "translate(" + margin.left + "," + margin.top + ")");

        svg.append("g")
            .attr("class", "x axis")
            .attr("transform", "translate(0," + height + ")");

        svg.append("g")
            .attr("class", "y axis")
            .append("text")
            .attr("transform", "rotate(-90)")
            .attr("y", 6)
            .attr("dy", ".71em")
            .style("text-anchor", "end")
            .text("Temperature");

        svg.append("path")
            .attr("class", "line data");

    },
    update: function (element, valueAccessor) {
        "use strict";

        var margin = { top: 20, right: 20, bottom: 30, left: 50 },
            elementWidth = parseInt(d3.select(element).style("width"), 10),
            elementHeight = parseInt(d3.select(element).style("height"), 10),
            width = elementWidth - margin.left - margin.right,
            height = elementHeight - margin.top - margin.bottom,

            // set the time it takes for the animation to take.
            animationDuration = 750,

            x = d3.time.scale()
                .range([0, width]),

            y = d3.scale.linear()
                .range([height, 0]),

            xAxis = d3.svg.axis()
                .scale(x)
                .orient("bottom"),

            yAxis = d3.svg.axis()
                .scale(y)
                .orient("left"),

            // define the graph line
            line = d3.svg.line()
                .x(function (d) { return x(d.Date); })
                .y(function (d) { return y(d.LiquidTemp); }),

            svg = d3.select(element).select("svg g"),

            // parse data from the data-view-model
            data = ko.unwrap(valueAccessor());

        // define the domain of the graph. max and min of the dimensions
        x.domain(d3.extent(data, function (d) { return d.Date; }));
        y.domain([0, d3.max(data, function (d) { return d.LiquidTemp; })]);

        svg.select("g.x.axis")
            .transition()
            .duration(animationDuration)
            .call(xAxis);

        svg.select("g.y.axis")
            .transition()
            .duration(animationDuration)
            .call(yAxis);

        // add the line to the canvas
        svg.select("path.line.data")
            .datum(data)
            .transition()
            .duration(animationDuration)
            .attr("d", line);
    }
};
No we have all ends connected and it’s time to see the web applicaton in action.
Real-time sensor data in action
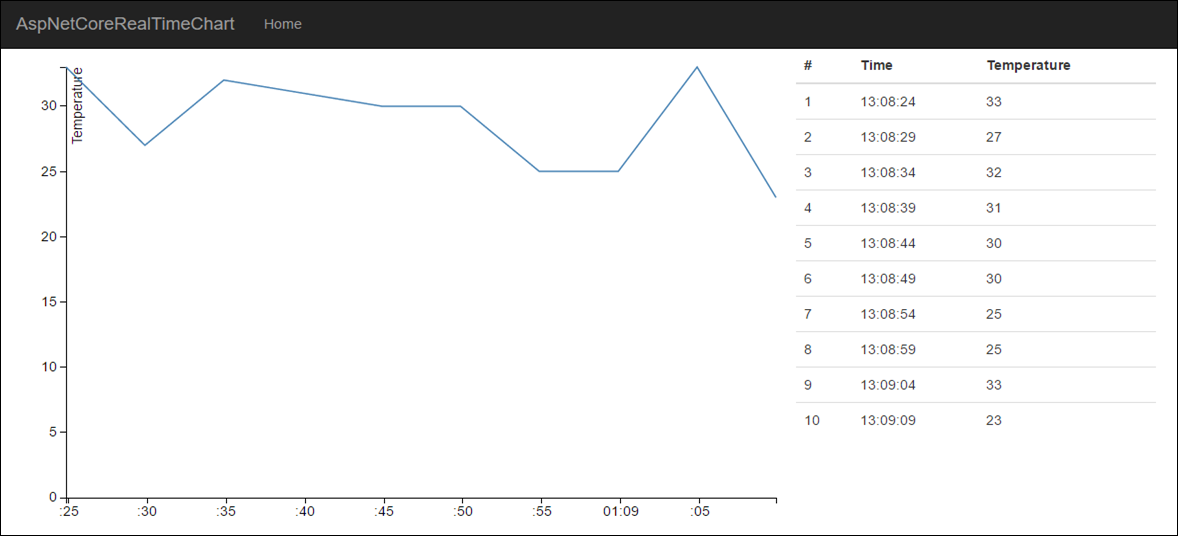
To illustrate the end result better I added here screenshot and video. Video demonstrates how call to /api/Generate broadcasts new reading to all registered sensors after every five seconds.

Screenshot of real-time sensor data.