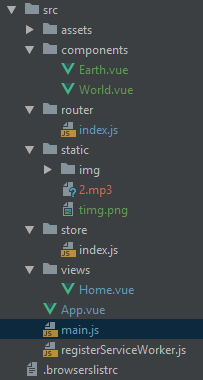
zoukankan      html  css  js  c++  java
  • vue用echarts 画3d地球 且画线

    页面效果如下:


    项目结构如下:

     引入的包

    "dependencies": {
        "core-js": "^3.3.2",
        "register-service-worker": "^1.6.2",
        "vue": "^2.6.10",
        "vue-aplayer": "^1.6.1",
        "vue-router": "^3.1.3",
        "vuex": "^3.0.1",
        "echarts": "^4.4.0",
        "echarts-gl": "^1.1.1",
        "element-ui": "^2.11.1"
      },

     地球的页面

    <template>
        <div class="earthmap" id="earth">
    
        </div>
    </template>
    
    <script>
        import echarts from 'echarts'
        import 'echarts/map/js/world.js'
        import 'echarts-gl'
        export default {
            data(){
                return{
                    mapChart:{},
                    //立体球形纹路
                    option :{
                        globe: {
                            globeRadius: 83,
                            baseTexture: '',//贴图 球形和平面的吻合
                            silent: true,
                            environment: require("../static/img/background.jpg"), //背景
                            heightTexture: require("../static/img/map.jpg"), //地球的整个纹路
                            shading: 'realistic',
                            light: {
                                main: {
                                    color: '#fff',
                                    intensity: 0,
                                    shadow: false,
                                    shadowQuality: 'high',
                                    alpha: 55,
                                    beta: 10
                                },
                                ambient: {
                                    color: '#fff',
                                    intensity: 1
                                }
                            },
                            postEffect: {
                                enable: false,
                                SSAO: {
                                    enable: true,
                                    radius: 10
                                }
                            },
    
                            //地球是否自己转动 autoRotate为true时自己转动
                            viewControl: {
                                autoRotate: true,
                                animationDurationUpdate: 2000,
                                targetCoord: ''
                            }
                        },
                        series: [
                           /* {
                                type: 'scatter3D',
                                coordinateSystem: 'globe',
                                blendMode: 'lighter',
                                symbolSize: 20,
                                symbol: 'pin',
                                silent: false,
                                itemStyle: {
                                    color: function (params) {
                                        var colorList = ['rgb(246, 153, 180)', 'rgb(118,77,209)'];
                                        if (params.dataIndex % 2 != 0) {
                                            return colorList[0]
                                        } else {
                                            return colorList[1]
                                        }
                                    },
                                    opacity: 1
                                },
                                label: {
                                    show: true,
                                    textStyle: {
                                        fontSize: 20
                                    },
                                    formatter: function (params) {
                                        if (params.dataIndex % 2 != 0) {
                                            return 'Destination:
    ' + params.name
                                        } else {
                                            return 'Departure:
    ' + params.name
                                        }
                                    },
                                    position: 'top'
                                }
                            }*/
                            {
                                name: 'lines3D',
                                type: 'lines3D',
                                coordinateSystem: 'globe',
                                effect: {
                                    show: true,
                                    period: 2,
                                    trailWidth: 3,
                                    trailLength: 0.5,
                                    trailOpacity: 1,
                                    trailColor: '#0087f4'
                                },
                                blendMode: 'lighter',
                                lineStyle: {
                                     1,
                                    color: '#0087f4',
                                    opacity: 0
                                },
                                data: [],
                                silent: false,
    
                            }
    
                        ]
    
                    },
    
                    //平面地球 主要是设置地球的样式
                    mapOption: {
                        backgroundColor: 'rgba(20,104,121,0.71)',//当和立体球形贴图是海洋的颜色
                        visualMap: {
                            show: false,
                            min: 0,
                            max: 100000
                        },
                        series: [
                            {
                                type: 'map',
                                map: 'world',
                                left: 0,
                                top: 0,
                                right: 0,
                                bottom: 0,
                                environment: 'rgba(0,0,0,0)',
                                boundingCoords: [
                                    [-180, 90],
                                    [180, -90]
                                ],
                                itemStyle: {
                                    normal: {
                                        borderWidth: 2,
                                        borderColor: 'rgb(0,232,232)',//地球纹路的颜色
                                        areaColor: {
                                            type: 'linear',
                                            x: 0,
                                            y: 0,
                                            x2: 0,
                                            y2: 1,
                                            //相邻每个板块 从上到下的颜色变化
                                            colorStops: [{
                                                offset: 0.2, color: 'rgb(0,48,62)' // 0% 处的颜色
                                            }, {
                                                offset: 0.8, color: 'rgba(0,179,188,0.8)' // 100% 处的颜色
                                            }],
                                            global: false // 缺省为 false
                                        },
                                    }
                                }
                            }
                        ]
                    }
    
                }
            },
            mounted(){
                this.initMap()
            },
            methods:{
                 initMap(){
    
                     this.mapChart = echarts.init(document.createElement('canvas'), null, {
                          3086,
                         height: 3048
                     });
                     //获取容器并对其初始化
                     this.myChart = echarts.init(document.getElementById('earth'))
    
                     //将平面地球和立体球形的纹路重叠
                     this.mapChart.setOption(this.mapOption)
                     this.option.globe.baseTexture = this.mapChart
    
                     //随机划多条线
                     for (let i = 0; i < 150; i++) {
                         this.option.series[0].data = this.option.series[0].data.concat(this.rodamData())
                     }
    
                     this.myChart.setOption(this.option);
                    // this.myChart.setOption(this.mapOption);// 平面展开图
                 },
    
                //调用划线方法
                rodamData() {
                    //let name = '随机点' + Math.random().toFixed(5) * 100000
                    // let longitude = Math.random() * 62 + 73
                    let longitude = 105.18
                    let longitude2 = Math.random() * 360 - 180
                    // let latitude = Math.random() * 50 + 3.52
                    let latitude = 37.51
                    let latitude2 = Math.random() * 180 - 90
                    return {
                        coords: [
                            [longitude2, latitude2],
                            [longitude, latitude]
                        ],
                        value: (Math.random() * 3000).toFixed(2)
                    }
                }


        }


        }
    
    </script>
    
    
    <style>
        .earthmap{
             100%;
            height: 700px;
            background: rgba(16, 167, 202, 0.39);
        }
    
    
    </style>

    统一的页面 home.vue

    <template>
        <div class="home">
    
            <div style=" 100%;height: 100%">
                <Earth></Earth>
            </div>
           
    
        </div>
    </template>
    
    <script>
    
        import Earth from "@/components/Earth";
    
    
        export default {
            components: {
               
                Earth
            },
            data() {
                return {
                }
            }
    
        };
    </script>

    首页 App.vue

    <template>
        <div id="app">
            <Home/>
            <router-view/>
        </div>
    </template>
    
    <script>
        import Home from '@/views/Home'
    
        export default {
            components: {
                Home
            }
        }
    </script>
    
    <style lang="less">
        #app {
            font-family: "Avenir", Helvetica, Arial, sans-serif;
            -webkit-font-smoothing: antialiased;
            -moz-osx-font-smoothing: grayscale;
            text-align: center;
            color: #2c3e50;
             100%;
            height:100%;
        }
    
    </style>
  • 相关阅读:
    Web后台项目学习2(代码部分)
    Web后台项目学习
    JDBC
    爬虫视频
    asyncio
    一篇做实验的随笔
    day14
    day13
    html+css 习题
    js-练习题
  • 原文地址:https://www.cnblogs.com/JonaLin/p/11856539.html
Copyright © 2011-2022 走看看