Matplotlib基本图形之条形图2
1.绘制多条条形图
示例代码:
import time
import numpy as np
import matplotlib.pyplot as plt


basedir = os.path.dirname(os.path.abspath(__file__))
resultdir = os.path.join(basedir, 'result')

index = np.arange(4)
A = [34,64,45,73]
B = [44,53, 49,69]
bar_width = 0.3
plt.bar(index,A,bar_width,color='b')
plt.bar(index+bar_width,B,bar_width,color='r')
plt.savefig(os.path.join(resultdir,'test.png'))
运行结果:

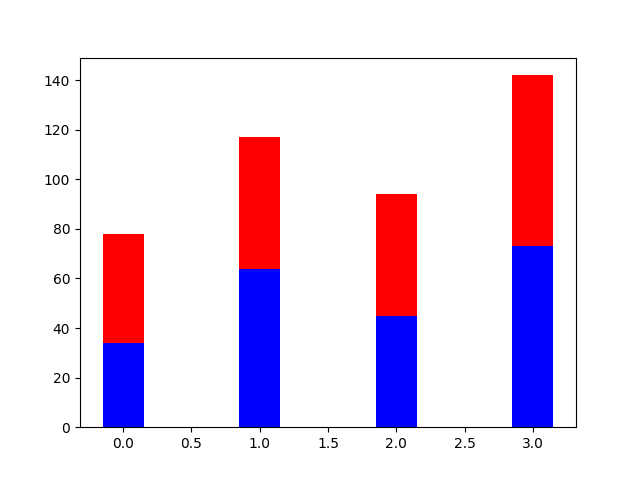
2.绘制叠加条形图
示例代码:
import os
import time
import numpy as np
import matplotlib.pyplot as plt
import matplotlib.dates as mdates


basedir = os.path.dirname(os.path.abspath(__file__))
resultdir = os.path.join(basedir, 'result')

index = np.arange(4)
A = [34,64,45,73]
B = [44,53, 49,69]
bar_width = 0.3
plt.bar(index,A,bar_width,color='b')
plt.bar(index,B,bar_width,color='r',bottom=A)
plt.savefig(os.path.join(resultdir,'test.png'))
运行结果: