新版的MongoDB中的Explain已经变样了
Explain支持三种Mode
queryPlanner Mode
db.collection.explain() 默认mode是queryPlanner,返回queryPlanner信息
executionStats Mode
当前mode返回queryPlanner和executionStats信息
allPlansExecution Mode
更加详细的信息~
比如:我这里有10万数据,做一个查询
db.my_collection.stats()
{
    "ns" : "test.my_collection",
    "size" : 8029384,
    "count" : 100500,
    "avgObjSize" : 79,
    "storageSize" : 1331200,
    "capped" : false,
    "wiredTiger" : {
        "metadata" : {
            "formatVersion" : 1
        },
        "creationString" : "access_pattern_hint=none,allocation_size=4KB,app_metadata=(formatVersion=1),assert=(commit_timestamp=none,read_timestamp=none),block_allocation=best,block_compressor=snappy,cache_resident=false,checksum=on,colgroups=,collator=,columns=,dictionary=0,encryption=(keyid=,name=),exclusive=false,extractor=,format=btree,huffman_key=,huffman_value=,ignore_in_memory_cache_size=false,immutable=false,internal_item_max=0,internal_key_max=0,internal_key_truncate=true,internal_page_max=4KB,key_format=q,key_gap=10,leaf_item_max=0,leaf_key_max=0,leaf_page_max=32KB,leaf_value_max=64MB,log=(enabled=true),lsm=(auto_throttle=true,bloom=true,bloom_bit_count=16,bloom_config=,bloom_hash_count=8,bloom_oldest=false,chunk_count_limit=0,chunk_max=5GB,chunk_size=10MB,merge_custom=(prefix=,start_generation=0,suffix=),merge_max=15,merge_min=0),memory_page_max=10m,os_cache_dirty_max=0,os_cache_max=0,prefix_compression=false,prefix_compression_min=4,source=,split_deepen_min_child=0,split_deepen_per_child=0,split_pct=90,type=file,value_format=u",
        "type" : "file",
        "uri" : "statistics:table:collection-8--701343360468677485",
        "LSM" : {
            "bloom filter false positives" : 0,
            "bloom filter hits" : 0,
            "bloom filter misses" : 0,
            "bloom filter pages evicted from cache" : 0,
            "bloom filter pages read into cache" : 0,
            "bloom filters in the LSM tree" : 0,
            "chunks in the LSM tree" : 0,
            "highest merge generation in the LSM tree" : 0,
            "queries that could have benefited from a Bloom filter that did not exist" : 0,
            "sleep for LSM checkpoint throttle" : 0,
            "sleep for LSM merge throttle" : 0,
            "total size of bloom filters" : 0
        },
        "block-manager" : {
            "allocations requiring file extension" : 303,
            "blocks allocated" : 307,
            "blocks freed" : 1,
            "checkpoint size" : 1298432,
            "file allocation unit size" : 4096,
            "file bytes available for reuse" : 16384,
            "file magic number" : 120897,
            "file major version number" : 1,
            "file size in bytes" : 1331200,
            "minor version number" : 0
        },
        "btree" : {
            "btree checkpoint generation" : 219,
            "column-store fixed-size leaf pages" : 0,
            "column-store internal pages" : 0,
            "column-store variable-size RLE encoded values" : 0,
            "column-store variable-size deleted values" : 0,
            "column-store variable-size leaf pages" : 0,
            "fixed-record size" : 0,
            "maximum internal page key size" : 368,
            "maximum internal page size" : 4096,
            "maximum leaf page key size" : 2867,
            "maximum leaf page size" : 32768,
            "maximum leaf page value size" : 67108864,
            "maximum tree depth" : 3,
            "number of key/value pairs" : 0,
            "overflow pages" : 0,
            "pages rewritten by compaction" : 0,
            "row-store internal pages" : 0,
            "row-store leaf pages" : 0
        },
        "cache" : {
            "bytes currently in the cache" : 17100143,
            "bytes read into cache" : 41465,
            "bytes written from cache" : 8650650,
            "checkpoint blocked page eviction" : 0,
            "data source pages selected for eviction unable to be evicted" : 0,
            "eviction walk passes of a file" : 0,
            "eviction walk target pages histogram - 0-9" : 0,
            "eviction walk target pages histogram - 10-31" : 0,
            "eviction walk target pages histogram - 128 and higher" : 0,
            "eviction walk target pages histogram - 32-63" : 0,
            "eviction walk target pages histogram - 64-128" : 0,
            "eviction walks abandoned" : 0,
            "eviction walks gave up because they restarted their walk twice" : 0,
            "eviction walks gave up because they saw too many pages and found no candidates" : 0,
            "eviction walks gave up because they saw too many pages and found too few candidates" : 0,
            "eviction walks reached end of tree" : 0,
            "eviction walks started from root of tree" : 0,
            "eviction walks started from saved location in tree" : 0,
            "hazard pointer blocked page eviction" : 0,
            "in-memory page passed criteria to be split" : 2,
            "in-memory page splits" : 1,
            "internal pages evicted" : 0,
            "internal pages split during eviction" : 0,
            "leaf pages split during eviction" : 0,
            "modified pages evicted" : 0,
            "overflow pages read into cache" : 0,
            "page split during eviction deepened the tree" : 0,
            "page written requiring lookaside records" : 0,
            "pages read into cache" : 3,
            "pages read into cache after truncate" : 0,
            "pages read into cache after truncate in prepare state" : 0,
            "pages read into cache requiring lookaside entries" : 0,
            "pages requested from the cache" : 101584,
            "pages seen by eviction walk" : 0,
            "pages written from cache" : 305,
            "pages written requiring in-memory restoration" : 0,
            "tracked dirty bytes in the cache" : 0,
            "unmodified pages evicted" : 0
        },
        "cache_walk" : {
            "Average difference between current eviction generation when the page was last considered" : 0,
            "Average on-disk page image size seen" : 0,
            "Average time in cache for pages that have been visited by the eviction server" : 0,
            "Average time in cache for pages that have not been visited by the eviction server" : 0,
            "Clean pages currently in cache" : 0,
            "Current eviction generation" : 0,
            "Dirty pages currently in cache" : 0,
            "Entries in the root page" : 0,
            "Internal pages currently in cache" : 0,
            "Leaf pages currently in cache" : 0,
            "Maximum difference between current eviction generation when the page was last considered" : 0,
            "Maximum page size seen" : 0,
            "Minimum on-disk page image size seen" : 0,
            "Number of pages never visited by eviction server" : 0,
            "On-disk page image sizes smaller than a single allocation unit" : 0,
            "Pages created in memory and never written" : 0,
            "Pages currently queued for eviction" : 0,
            "Pages that could not be queued for eviction" : 0,
            "Refs skipped during cache traversal" : 0,
            "Size of the root page" : 0,
            "Total number of pages currently in cache" : 0
        },
        "compression" : {
            "compressed pages read" : 2,
            "compressed pages written" : 302,
            "page written failed to compress" : 0,
            "page written was too small to compress" : 3,
            "raw compression call failed, additional data available" : 0,
            "raw compression call failed, no additional data available" : 0,
            "raw compression call succeeded" : 0
        },
        "cursor" : {
            "bulk-loaded cursor-insert calls" : 0,
            "create calls" : 3,
            "cursor-insert key and value bytes inserted" : 8309200,
            "cursor-remove key bytes removed" : 0,
            "cursor-update value bytes updated" : 0,
            "cursors cached on close" : 0,
            "cursors reused from cache" : 0,
            "insert calls" : 100000,
            "modify calls" : 0,
            "next calls" : 201002,
            "prev calls" : 1,
            "remove calls" : 0,
            "reserve calls" : 0,
            "reset calls" : 101580,
            "restarted searches" : 0,
            "search calls" : 6,
            "search near calls" : 1570,
            "truncate calls" : 0,
            "update calls" : 0
        },
        "reconciliation" : {
            "dictionary matches" : 0,
            "fast-path pages deleted" : 0,
            "internal page key bytes discarded using suffix compression" : 604,
            "internal page multi-block writes" : 1,
            "internal-page overflow keys" : 0,
            "leaf page key bytes discarded using prefix compression" : 0,
            "leaf page multi-block writes" : 2,
            "leaf-page overflow keys" : 0,
            "maximum blocks required for a page" : 1,
            "overflow values written" : 0,
            "page checksum matches" : 0,
            "page reconciliation calls" : 4,
            "page reconciliation calls for eviction" : 0,
            "pages deleted" : 0
        },
        "session" : {
            "cached cursor count" : 0,
            "object compaction" : 0,
            "open cursor count" : 2
        },
        "transaction" : {
            "update conflicts" : 0
        }
    },
    "nindexes" : 1,
    "totalIndexSize" : 1228800,
    "indexSizes" : {
        "_id_" : 1228800
    },
    "ok" : 1
}
以上是查看表信息的。。
下面查询id为25000的数据,我们以executionStats Mode 来查看
db.my_collection.find({_id:{$eq:25000}})
{ "_id" : NumberLong(25000), "name" : "Book-25000", "_class" : "com.example.demo.entity.Book" }
db.my_collection.explain("executionStats").find({_id:{$eq:25000}})
{
    "queryPlanner" : {
        "plannerVersion" : 1,
        "namespace" : "test.my_collection",
        "indexFilterSet" : false,
        "parsedQuery" : {
            "_id" : {
                "$eq" : 25000
            }
        },
        "winningPlan" : {
            "stage" : "FETCH",
            "inputStage" : {
                "stage" : "IXSCAN",
                "keyPattern" : {
                    "_id" : 1
                },
                "indexName" : "_id_",
                "isMultiKey" : false,
                "multiKeyPaths" : {
                    "_id" : [ ]
                },
                "isUnique" : true,
                "isSparse" : false,
                "isPartial" : false,
                "indexVersion" : 2,
                "direction" : "forward",
                "indexBounds" : {
                    "_id" : [
                        "[25000.0, 25000.0]"
                    ]
                }
            }
        },
        "rejectedPlans" : [ ]
    },
    "executionStats" : {
        "executionSuccess" : true,
        "nReturned" : 1,
        "executionTimeMillis" : 0,
        "totalKeysExamined" : 1,
        "totalDocsExamined" : 1,
        "executionStages" : {
            "stage" : "FETCH",
            "nReturned" : 1,
            "executionTimeMillisEstimate" : 0,
            "works" : 2,
            "advanced" : 1,
            "needTime" : 0,
            "needYield" : 0,
            "saveState" : 0,
            "restoreState" : 0,
            "isEOF" : 1,
            "invalidates" : 0,
            "docsExamined" : 1,
            "alreadyHasObj" : 0,
            "inputStage" : {
                "stage" : "IXSCAN",
                "nReturned" : 1,
                "executionTimeMillisEstimate" : 0,
                "works" : 2,
                "advanced" : 1,
                "needTime" : 0,
                "needYield" : 0,
                "saveState" : 0,
                "restoreState" : 0,
                "isEOF" : 1,
                "invalidates" : 0,
                "keyPattern" : {
                    "_id" : 1
                },
                "indexName" : "_id_",
                "isMultiKey" : false,
                "multiKeyPaths" : {
                    "_id" : [ ]
                },
                "isUnique" : true,
                "isSparse" : false,
                "isPartial" : false,
                "indexVersion" : 2,
                "direction" : "forward",
                "indexBounds" : {
                    "_id" : [
                        "[25000.0, 25000.0]"
                    ]
                },
                "keysExamined" : 1,
                "seeks" : 1,
                "dupsTested" : 0,
                "dupsDropped" : 0,
                "seenInvalidated" : 0
            }
        }
    },
    "serverInfo" : {
        "host" : "——",
        "port" : 27017,
        "version" : "3.6.5",
        "gitVersion" : "a20ecd3e3a174162052ff99913bc2ca9a839d618"
    },
    "ok" : 1
}
下面解释一下关心的参数:
explain.executionStats.nReturned         查询匹配的文档数

explain.executionStats.executionTimeMillis    查询所需要的时间(单位为毫秒)

explain.executionStats.totalKeysExamined    扫描的索引数

explain.executionStats.totalDocsExamined    扫描的文档数

explain.executionStats.allPlansExecution    只有以allPlansExecution模式运行才会显示这个字段
上面查询,用到了索引,匹配的文档数为1,时间为0(因为没有费力),索引数为1,扫描的文档数为1
那么下面我计划一个笨查询
db.my_collection.explain("executionStats").find()
{
    "queryPlanner" : {
        "plannerVersion" : 1,
        "namespace" : "test.my_collection",
        "indexFilterSet" : false,
        "parsedQuery" : {

        },
        "winningPlan" : {
            "stage" : "COLLSCAN",
            "direction" : "forward"
        },
        "rejectedPlans" : [ ]
    },
    "executionStats" : {
        "executionSuccess" : true,
        "nReturned" : 100500,
        "executionTimeMillis" : 39,
        "totalKeysExamined" : 0,
        "totalDocsExamined" : 100500,
        "executionStages" : {
            "stage" : "COLLSCAN",
            "nReturned" : 100500,
            "executionTimeMillisEstimate" : 24,
            "works" : 100502,
            "advanced" : 100500,
            "needTime" : 1,
            "needYield" : 0,
            "saveState" : 785,
            "restoreState" : 785,
            "isEOF" : 1,
            "invalidates" : 0,
            "direction" : "forward",
            "docsExamined" : 100500
        }
    },
    "serverInfo" : {
        "host" : "FC001977PC1",
        "port" : 27017,
        "version" : "3.6.5",
        "gitVersion" : "a20ecd3e3a174162052ff99913bc2ca9a839d618"
    },
    "ok" : 1
}
这样数据就明显一点了,不过话说回来,查这么多数据只用了39毫秒,的确挺牛逼的
更具体的说明见官网:https://docs.mongodb.com/manual/reference/method/db.collection.explain/#db.collection.explain
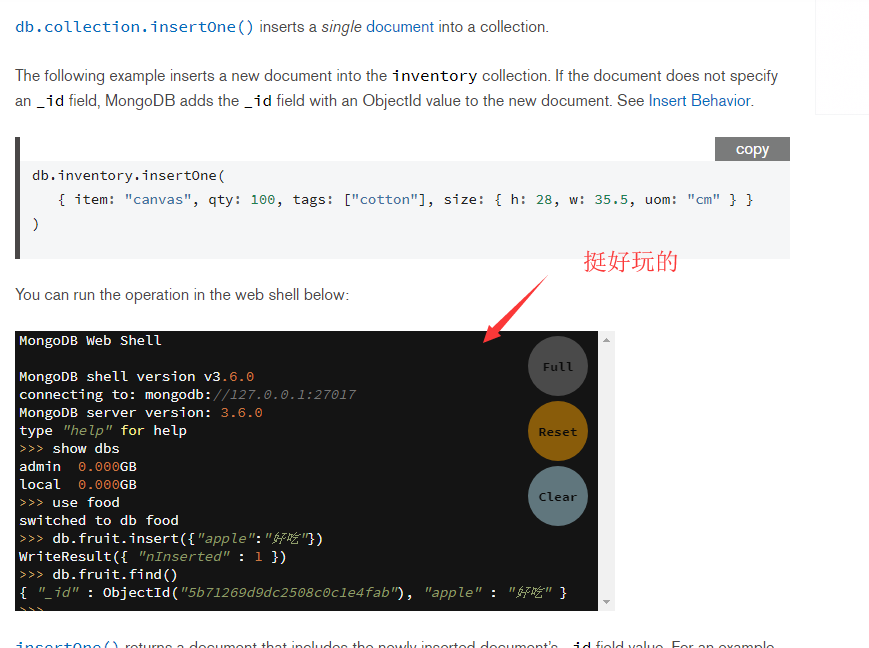
PS:无意间在官网上发现在线练习的控制台:https://docs.mongodb.com/manual/tutorial/insert-documents/