翻译、总结自How to debug binding in WPF、Debug Databinding Issues in WPF、How to debug WPF bindings、Debugging Data Bindings in a WPF or Silverlight Application、WPF Snippet - Detecting Binding Errors
官方调试内容包括调试 WPF、如何:显示 WPF 跟踪信息
Debug数据绑定的方式有以下几种:
DataBinding表达式无效, 使用跟踪输出(Trace Output)来解决。
DataBinding表达式有效,但结果不是预期的, 使用调试转换器(Debug Converter)来解决。
添加自定义跟踪侦听器以侦听绑定错误,并在发生错误时将其弹出为消息框。
设置WPF跟踪设置
方法1:在输出窗口中跟踪消息
在示例中,TextBlock的Text属性绑定到StackPanel的属性InvalidPath,InvalidPath是一个不存在的属性。
<Window x:Class="DebugDataBinding.Window1"
    xmlns="http://schemas.microsoft.com/winfx/2006/xaml/presentation"
    xmlns:x="http://schemas.microsoft.com/winfx/2006/xaml" >
    <StackPanel x:Name="stack">
        <TextBlock Text="{Binding ElementName=stack, Path=InvalidPath}" />
    </StackPanel>
</Window>
在这种情况下,无效的数据绑定表达式由输出窗口中的跟踪消息报告:
System.Windows.Data Error: 39 : BindingExpression path error: 'InvalidPath' property not found on 'object' ''StackPanel' (Name='stack')'. BindingExpression:Path=InvalidPath; DataItem='StackPanel' (Name='stack'); target element is 'TextBlock' (Name=''); target property is 'Text' (type 'String')
注意:绑定到具有NULL值的属性的路径是有效的表达式,并且不会生成错误消息(例如,绑定到数据上下文的NULL的属性)。
调整跟踪级别(.NET 3.5及更高版本)
NET3.5具有一项新功能,可让你将跟踪消息的详细信息级别设置为无(None),低(Low),中(Medium)或高(High)。
要设置跟踪级别,你必须在XAML中包括一个额外的名称空间:
<Window x:Class="DebugDataBinding.Window1"
    xmlns="http://schemas.microsoft.com/winfx/2006/xaml/presentation"
    xmlns:x="http://schemas.microsoft.com/winfx/2006/xaml"
    xmlns:diag="clr-namespace:System.Diagnostics;assembly=WindowsBase">

    <StackPanel x:Name="stack">
        <TextBlock Text="{Binding ElementName=stack, Path=InvalidPath,
                          diag:PresentationTraceSources.TraceLevel=High}" />
    </StackPanel>
</Window>
以下代码段显示了如何通过代码调整跟踪级别:
PresentationTraceSources.DataBindingSource.Listeners.Add(new ConsoleTraceListener());
PresentationTraceSources.DataBindingSource.Switch.Level = SourceLevels.All;
方法2:使用ValueConverter进行调试
一个简单的技巧是编写一个值转换器(ValueConverter),除了进入调试器外,它什么也不做。
/// <summary>
/// This converter does nothing except breaking the
/// debugger into the convert method
/// </summary>
public class DatabindingDebugConverter : IValueConverter
{
    public object Convert(object value, Type targetType,
        object parameter, CultureInfo culture)
    {
        Debugger.Break();
        return value;
    }

    public object ConvertBack(object value, Type targetType,
        object parameter, CultureInfo culture)
    {
        Debugger.Break();
        return value;
    }
}
<Window x:Class="DebugDataBinding.Window1"
    xmlns="http://schemas.microsoft.com/winfx/2006/xaml/presentation"
    xmlns:x="http://schemas.microsoft.com/winfx/2006/xaml"
    xmlns:local="clr-namespace:DebugDataBinding"
    Title="Window1" Height="300" Width="300">

    <Window.Resources>
        <local:DatabindingDebugConverter x:Key="debugConverter" />
    </Window.Resources>

    <StackPanel x:Name="stack">
        <TextBlock Text="{Binding ElementName=stack, Path=ActualWidth,
                          Converter={StaticResource debugConverter}}" />
    </StackPanel>
</Window>
这样,在ValueConverter中就可以对TextBlock的Text进行调试了。
方法3:自定义跟踪侦听器
添加自定义跟踪侦听器以侦听绑定错误,并在发生错误时将其弹出为消息框。
为此,我们必须创建一个自定义的跟踪侦听器——我们自己的从DefaultTraceListener派生的类。
跟踪侦听器是.NET中几乎所有调试/错误报告的背后——这几乎是所有调试输出的来源。你与跟踪侦听器的最直接交互可能来自于使用Debug.WriteLine和Debug.Assert。跟踪侦听器用于在发生故障时进行调试输出和消息框。
我们的自定义跟踪侦听器实际上是一个非常简单的代码块,因此,我将所有内容放在一个块中,然后逐步进行遍历。
using System.Diagnostics;
using System.Text;
using System.Windows;

namespace SOTC_BindingErrorTracer
{
  public class BindingErrorTraceListener : DefaultTraceListener
  {
    private static BindingErrorTraceListener _Listener;

    public static void SetTrace()
    { SetTrace(SourceLevels.Error, TraceOptions.None); }

    public static void SetTrace(SourceLevels level, TraceOptions options)
    {
      if (_Listener == null)
      {
        _Listener = new BindingErrorTraceListener();
        PresentationTraceSources.DataBindingSource.Listeners.Add(_Listener);
      }

      _Listener.TraceOutputOptions = options;
      PresentationTraceSources.DataBindingSource.Switch.Level = level;
    }

    public static void CloseTrace()
    {
      if (_Listener == null)
      { return; }

      _Listener.Flush();
      _Listener.Close();
      PresentationTraceSources.DataBindingSource.Listeners.Remove(_Listener);
      _Listener = null;
    }


    private StringBuilder _Message = new StringBuilder();

    private BindingErrorTraceListener()
    { }

    public override void Write(string message)
    { _Message.Append(message); }

    public override void WriteLine(string message)
    {
      _Message.Append(message);

      var final = _Message.ToString();
      _Message.Length = 0;

      MessageBox.Show(final, "Binding Error", MessageBoxButton.OK,
        MessageBoxImage.Error);
    }
  }
}
所以首先,实际上是设置跟踪侦听器。 SetTrace是采用SourceLevel和TraceOptions的静态方法。 SourceLevel本质上是要执行多少跟踪。在我们的例子中,Error是一个很好的值——否则我们可能会被消息框轰炸。 TraceOptions是一个标志枚举,指出应在跟踪中包括哪些类型的信息。通常,我发现你不需要任何其他信息即可调试数据绑定错误,因此我默认将其设置为无(None)。
调用SetTrace时,我们将创建自定义跟踪侦听器的实例(除非我们的自定义跟踪侦听器已在侦听)。然后,将其添加到DataBindingSource跟踪的侦听器列表中。 PresentationTraceSources具有许多不同的跟踪,但是今天我们只关心DataBindingSource。但是,如果您碰巧正在寻找其他WPF调试信息,则该类是一个不错的起点。
将我们的侦听器实例添加到列表后,现在将通知它是否有任何错误。这是我们覆盖Write和WriteLine方法的地方。DefaultTraceListener的基本方法执行诸如写入调试输出之类的操作-但在这种情况下,我们不想这样做。在我们的例子中,我们想显示一个带有错误的消息框。但是,因为我们不想被消息框轰炸,所以我们只为写入的每一行显示一个-我们只累加传递给Write调用的字符串,直到进行WriteLine调用为止,此时我们将显示整个错误串。
最后,如你所料,静态方法CloseTrace从列表中删除了跟踪侦听器,因此不会再收到错误通知。
那么,我们如何使用这个跟踪侦听器?发生错误时会显示什么?好吧,下面你可以看到一个不错的绑定错误正在等待发生:
<Window x:Class="SOTC_BindingErrorTracer.Window1"
   xmlns="http://schemas.microsoft.com/winfx/2006/xaml/presentation"
   xmlns:x="http://schemas.microsoft.com/winfx/2006/xaml"
   Title="Window1" Height="300" Width="300">
  <Button Content="{Binding ElementName=foo, Path=bar}" />
</Window>
跟踪只需要设置一次,然后对整个应用程序起作用,直到将其关闭。 因此,在这种情况下,我们在此Window的构造函数中设置了跟踪:
public partial class Window1 : Window
{
  public Window1()
  {
    BindingErrorTraceListener.SetTrace();
    InitializeComponent();
  }
}
现在,当你启动应用程序时,你将收到以下非常明显的错误:

方法4:设置WPF跟踪设置
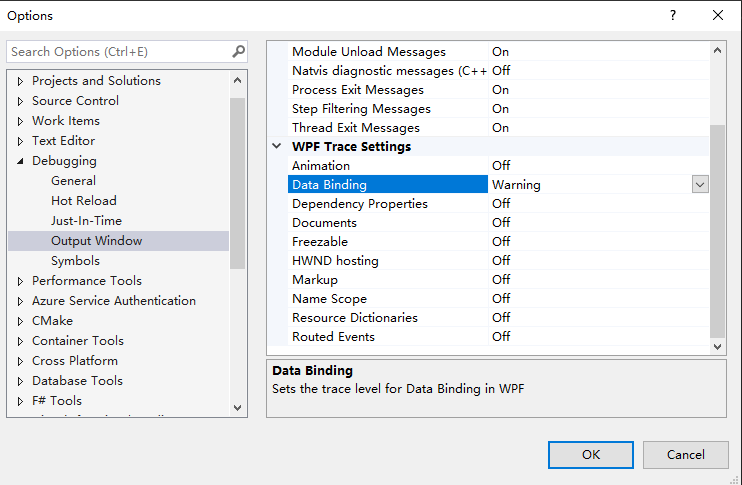
WPF跟踪设置数据绑定的默认值为错误。 建议你将此设置更改为警告。设置为“错误”时,不会输出“警告”消息。
Tips:如果将此设置设置为“关”,则在“调试输出”窗口中将看不到任何WPF数据绑定错误。
参考资料
如何:显示 WPF 跟踪信息
Visual Studio 2010 WPF Trace Settings Default Is Incorrect