安装
1、下载
安装php版本下载对应的xdebug版本,xdebug官网https://xdebug.org/download.php
2、安装
安装xdebug其实和php配置mysql一样,都是在php中添加拓展,即修改php.ini文件
在php.ini中追加:
[Xdebug]
;指定Xdebug扩展文件的绝对路径
zend_extension="E:Developwampxdebug2.5.5php_xdebug-2.5.5-5.6-vc11-x86_64.dll"
;启用性能检测分析
xdebug.profiler_enable=on
;启用代码自动跟踪
xdebug.auto_trace=on
;允许收集传递给函数的参数变量
xdebug.collect_params=on
;允许收集函数调用的返回值
xdebug.collect_return=on
;指定堆栈跟踪文件的存放目录
xdebug.trace_output_dir="E:Developwampdebug"
;指定性能分析文件的存放目录
xdebug.profiler_output_dir="E:Developwampdebug"
xdebug.profiler_output_name = cachegrind.out.%t.%p
注:在上述配置内容中,zend_extension用于指定Xdebug扩展模块的文件路径(由于Xdebug是基于Zend引擎的扩展,因此必须使用zend_extension配置指令,而不是extension。zend_extension指令的配置路径必须是绝对路径)。之后的配置语句是Xdebug的配置参数
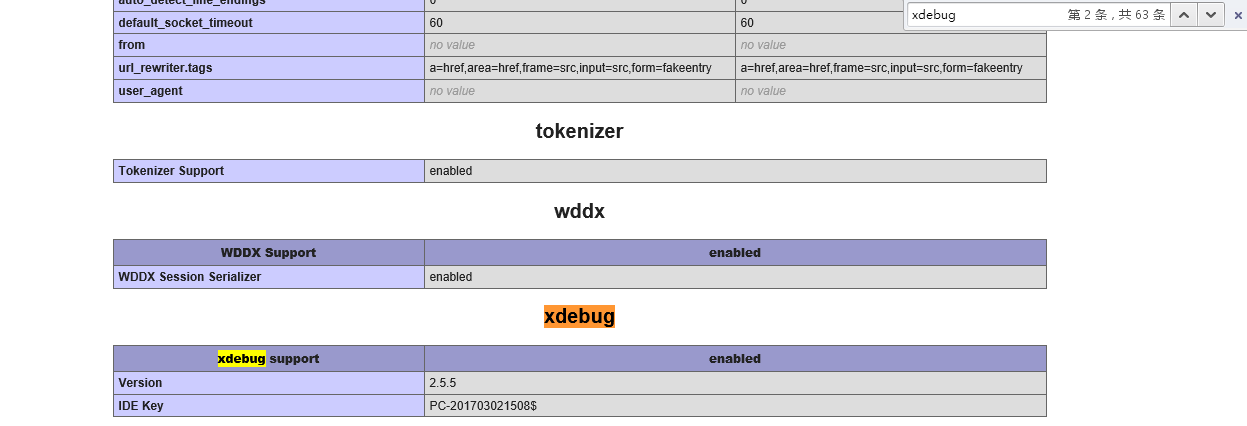
3、重启apache,并在用phpinfo()查看配置情况
xdebug配置说明官方文档:https://xdebug.org/docs/all_settings
使用
1、非集成编译环境使用xdebug:http://www.blogdaren.com/post-2062.html
 1 <?php
 2 class MyClass
 3 {
 4     public function myCaller($other)
 5     {
 6         $other->myCallee();
 7     }
 8 }
 9 class MyOtherClass
10 {
11     public function myCallee()
12     {
13         printf("%s",xdebug_call_class());
14         printf("::%s ",xdebug_call_function());
15         printf("in %s ",xdebug_call_file());
16         printf(":%s
",xdebug_call_line());
17     }
18 }
19 $a=new MyClass();
20 $b=new MyOtherClass();
21 $a->myCaller($b);
22 ?
2、phpstorm编译环境下使用xdebug
环境配置:https://blog.csdn.net/qq_31803357/article/details/65963644
基本操作:https://blog.csdn.net/qq_21386275/article/details/78109498