zoukankan      html  css  js  c++  java
  • 记录一次基于Echart的数据可视化平台开发

    最近公司有需求开发一个用于生产车间的数据可视化平台的项目,基于公司目前的WEB平台。

    于是采用了之前就使用过几次的Echart来开发,使用起来也比较熟悉,作为展示也比较方便,故在此记录一下。

    由于本人对于前台网页布局设计也不是很精通,所有开发出来的页面在美观方面表现不佳。

    正文

    1.页面布局方面,先上图

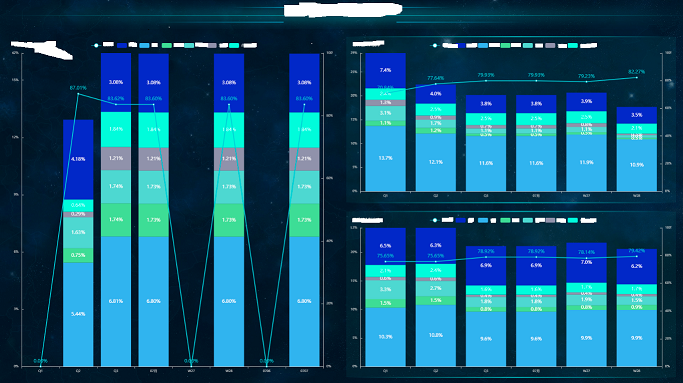
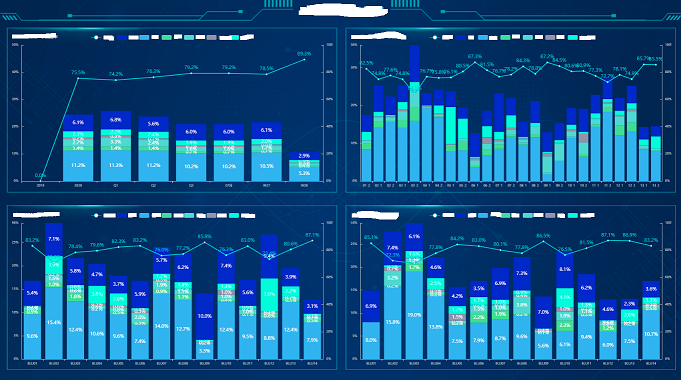
    以上就是数据可视化平台的其中几个,对于页面的布局,大多采用Bootstrap 的布局规则进行。

    2.使用Echart进行数据可视化渲染。

    使用ajax请求后台数据。获取到数据后,再使用echart进行画图。这里省略了echart使用的介绍,详细的可以参考官网的API文档及Demo。

    function GetForeLatterCapacityChart() {
        $.getJSON(ApiUrl + '/api/DataVApi/GetWipChart',
           function (data) {
               $.each(data.charts, function (index, chart) {
                   var SeriesLineMachine = [];
                   //再画echart图
                   var option = {
                       title: {
                           text: chart.title + "-前后段WIP",
                           x: 'left',
                           textStyle: {
                               color: '#ccc',
                               fontSize: 12
                           }
                       },
                       tooltip: {
                           show: false
                       },
                       legend: {
                           data: chart.legend,
                           itemHeight: 12,
                           textStyle: {
                               color: '#ccc',
                               fontSize: 10
                           },
                           left: '30%'
                       },
                       xAxis: [{
                           type: 'category',
                           data: chart.xAxis,
                           axisLine: {
                               lineStyle: {
                                   color: '#ccc'
                               }
                           },
                           axisLabel: {
                               interval: 0,//横轴信息全部显示
                               fontSize: 10
                           },
                       }],
                       yAxis: [{
                           type: 'value',
                           splitLine: { show: false },//去除网格线
                           min: function (value) {
                               return value.min;
                           },
                           max: function (value) {
                               return value.max;
                           },
                           axisLine: {
                               lineStyle: {
                                   color: '#ccc'
                               }
                           },
                           axisLabel: {
                               show: true,
                               fontSize: 10,
                               formatter: '{value}'
                           },
                           //刻度朝内
                           axisTick: {
                               inside: true
                           }
                       }],
                       series: [
                           {
                               name: '前段',
                               type: 'bar',
                               color: '#0083D3',
                               stack: 'WIP',
                               itemStyle: {
                                   normal: {
                                       color: '#0083D3'
                                   }
                               },
                               label: {
                                   normal: {
                                       show: true,
                                       position: 'inside',
                                       align: 'center',
                                       verticalAlign: 'middle',
                                       color: 'white',
                                       borderColor: '#9ACD32',
                                       formatter: function (params) {
                                           if (params.value == '0') {
                                               return '';
                                           } else {
                                               return params.value;
                                           }
                                       }
                                   }
                               },
                               data: chart.CapacityForePart
                           },
                                {
                                    name: '后段',
                                    type: 'bar',
                                    color: '#18FFF9',
                                    stack: 'WIP',
                                    itemStyle: {
                                        normal: {
                                            color: '#18FFF9'
                                        }
                                    },
                                    label: {
                                        normal: {
                                            show: true,
                                            position: 'inside',
                                            align: 'center',
                                            verticalAlign: 'middle',
                                            color: 'white',
                                            borderColor: '#E0FFFF',
                                            formatter: function (params) {
                                                if (params.value == '0') {
                                                    return '';
                                                } else {
                                                    return params.value;
                                                }
                                            }
                                        }
                                    },
                                    data: chart.CapacityLatterPart
                                }
                       ],
                       label: {
                           show: true,
                           position: 'top',
                           textStyle: {
                               color: 'black'
                           }
                       },
                       grid: {
                           left: 24,
                           top: 30,
                           right: 24,
                           bottom: 20
                       }
                   };
    
                   if (option && typeof option === "object") {
                       var dom = document.getElementById('WipCa' + index.toString());
                       var WIPCapacityChar = echarts.init(dom);
                       WIPCapacityChar.setOption(option);
                   }
    
                   window.addEventListener("resize", function () {
                       WIPCapacityChar.resize();
                   });
               });
           });
        
    }
    

      有时候需求轮播的图形,可以参考使用Swiper,但是Swiper5对Echart的支持还有点问题。Echart图形的点击事件会失效。

    所有我使用的是Swiper3来对图形进行定时轮播。Swiper的使用介绍可以参考官网API。API挺详细的。

    var mySwiper0 = new Swiper('.visual_swiper0', {
                loop: true,
                observer: true,
                observeParents: true
            })
    setInterval(function () {
                mySwiper0.slidePrev();
            }, 60000);


  • 相关阅读:
    SpringAOP-基于@AspectJ的简单入门
    SpringAOP-切面优先级
    Commons_IO_FileUtils的使用
    java_IO_装饰器
    java_IO_3
    java_IO_2
    java_IO_1
    App Inventor
    java学习_5_24
    java学习_5_23
  • 原文地址:https://www.cnblogs.com/PingPo/p/13500782.html
Copyright © 2011-2022 走看看