zoukankan      html  css  js  c++  java
  • echart图是用细节

    1.图形上的文本标签

    series: [
        {
            name: '奶粉',
            type: 'bar',
            stack: '总量',      //数据堆叠
            barMaxWidth:'50px',  //柱条的最大宽度,不设时自适应。
            label: {        //图形上的文本标签,可用于说明图形的一些数据信息
                normal: {
                    show: false,
                    position: 'insideRight'
                }
            },
            data: [2, 3, 8, 10, 40, 20, 60]
        },
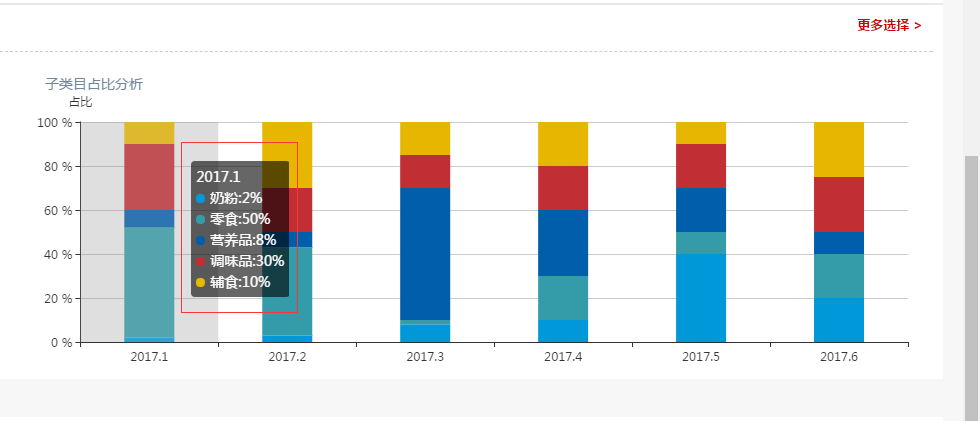
    2.气泡窗的内容改变

    tooltip : {
            trigger: 'axis',   //同时可以取多条记录
            formatter:
            function(params){   
                          var result = '';
                          result=params[0].name+"<br/>";//让series 中的文字进行换行 
                          params.forEach(function (item) {
                          //result=item.name+"<br/>";
                          result +='<span style="display:inline-block;margin-right:5px;border-radius:10px;9px;height:9px;background-color:' +
                           item.color + '"></span>'+item.seriesName+":"+item.value+"%"+"<br/>"
                        
                          })
                        return result;
                        
                     },
                             
                       
            axisPointer : {            // 坐标轴指示器,坐标轴触发有效
                type : 'shadow'        // 默认为直线,可选为:'line' | 'shadow'
            }

  • 相关阅读:
    MongoClient类
    MongoDB基本操作(增删改查)
    为什么MongoDB适合大数据的存储?
    npm的使用
    nodejs安装教程
    c#byte数组和string类型转换
    C#中数组、ArrayList和List三者的区别
    eclspse魔板
    mysql的备份
    shell的使用
  • 原文地址:https://www.cnblogs.com/Rookie-upgrade/p/7339736.html
Copyright © 2011-2022 走看看