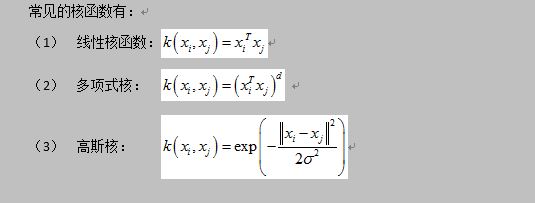
在现实任务中,原始样本空间中可能不存在这样可以将样本正确分为两类的超平面,但是我们知道如果原始空间的维数是有限的,也就是说属性数是有限的,则一定存在一个高维特征空间能够将样本划分。

事实上,在做任务中,我们并不知道什么样的核函数是合适的。但是核函数的选择却对支持向量机的性能有着至关重要的作用。如果核函数选择不合适,则意味着样本映射到一个不合适的特征空间,这样就有可能导致性能不佳。故“核函数选择”是非常重要的一项任务。

对于线性数据集的分类来说,我们当然会选择线性核函数。但如果要分割非线性数据集,我们该如何做呢?答案是,我们可以改变损失函数中的核函数。我们今天就以高斯核函数来进行案例说明:
#导入库
import matplotlib.pyplot as plt
import numpy as np
import tensorflow as tf
from sklearn import datasets
sess=tf.Session()
#生成模拟数据:得到两个同心圆数据,每个不同的环代表不同的类,分为类-1或者1
(x_vals,y_vals)=datasets.make_circles(n_samples=500,factor=.5,noise=.1)
y_vals=np.array([1 if y==1 else -1 for y in y_vals])
class1_x=[x[0] for i,x in enumerate(x_vals) if y_vals[i]==1]
class1_y=[x[1] for i,x in enumerate(x_vals) if y_vals[i]==1]
class2_x=[x[0] for i,x in enumerate(x_vals) if y_vals[i]==-1]
class2_y=[x[1] for i,x in enumerate(x_vals) if y_vals[i]==-1]
#声明批量大小、占位符以及变量b
batch_size=250
x_data=tf.placeholder(shape=[None,2],dtype=tf.float32)
y_target=tf.placeholder(shape=[None,1],dtype=tf.float32)
prediction_grid=tf.placeholder(shape=[None,2],dtype=tf.float32)
b=tf.Variable(tf.random_normal(shape=[1,batch_size]))
#创建高斯函数
gamma=tf.constant(-50.0)
dist=tf.reduce_sum(tf.square(x_data),1)
dist=tf.reshape(dist,[-1,1])
sq_dists=tf.add(tf.subtract(dist,tf.multiply(2.,tf.matmul(x_data,tf.transpose(x_data)))),tf.transpose(dist))
my_kernel=tf.exp(tf.multiply(gamma,tf.abs(sq_dists)))
#PS:线性核函数的表达式可以为:my_kernel=tf.matmul(x_data,tf.transpose(x_data))
#声明对偶问题,为了最大化,这里采用最小损失函数的负数:tf.negative()
model_output=tf.matmul(b,my_kernel)
first_term=tf.reduce_sum(b)
b_vec_cross=tf.matmul(tf.transpose(b),b)
y_target_cross=tf.matmul(y_target,tf.transpose(y_target))
second_term=tf.reduce_sum(tf.multiply(my_kernel,tf.multiply(b_vec_cross,y_target_cross)))
loss=tf.negative(tf.subtract(first_term,second_term))
#创建预测函数和准确度函数
rA=tf.reshape(tf.reduce_sum(tf.square(x_data),1),[-1,1])
rB=tf.reshape(tf.reduce_sum(tf.square(prediction_grid),1),[-1,1])
pred_sq_dist=tf.add(tf.subtract(rA,tf.multiply(2.,tf.matmul(x_data,tf.transpose(prediction_grid)))),tf.transpose(rB))
pred_kernel=tf.exp(tf.multiply(gamma,tf.abs(pred_sq_dist)))

prediction_output=tf.matmul(tf.multiply(tf.transpose(y_target),b),pred_kernel)
prediction=tf.sign(prediction_output-tf.reduce_mean(prediction_output))
accuracy=tf.reduce_mean(tf.cast(tf.equal(tf.squeeze(prediction),tf.squeeze(y_target)),tf.float32))
#创建优化器
my_opt=tf.train.GradientDescentOptimizer(0.001)
train_step=my_opt.minimize(loss)
#初始化变量
init=tf.global_variables_initializer()
sess.run(init)
#迭代训练,记录每次迭代的损失向量和准确度
loss_vec=[]
batch_accuracy=[]
for i in range(7500):
    rand_index=np.random.choice(len(x_vals),size=batch_size)
    rand_x=x_vals[rand_index]
    rand_y=np.transpose([y_vals[rand_index]])
    sess.run(train_step,feed_dict={x_data:rand_x,y_target:rand_y})
    temp_loss=sess.run(loss,feed_dict={x_data:rand_x,y_target:rand_y})
    loss_vec.append(temp_loss)

    acc_temp=sess.run(accuracy,feed_dict={x_data:rand_x,y_target:rand_y,prediction_grid:rand_x})
    batch_accuracy.append(acc_temp)
    if(i+1)%500==0:
        print('step#'+str(i+1))
        print('loss='+str(temp_loss))

#创建数据点网格用于后续的数据空间可视化分类
x_min,x_max=x_vals[:,0].min()-1,x_vals[:,0].max()+1
y_min,y_max=x_vals[:,1].min()-1,x_vals[:,1].max()+1
xx,yy=np.meshgrid(np.arange(x_min,x_max,0.02),
                 np.arange(y_min,y_max,0.02))
grid_points=np.c_[xx.ravel(),yy.ravel()]
[grid_predictions]=sess.run(prediction,feed_dict={x_data:rand_x,
                                                 y_target:rand_y,
                                                 prediction_grid:grid_points})
grid_predictions=grid_predictions.reshape(xx.shape)
#绘制预测结果
plt.contourf(xx,yy,grid_predictions,cmap=plt.cm.Paired,alpha=0.8)
plt.plot(class1_x,class1_y,'ro',label='得病')
plt.plot(class2_x,class2_y,'kx',label='没得病')
plt.legend(loc='lower right')
plt.ylim([-1.5,1.5])
plt.xlim([-1.5,1.5])
plt.show()
#绘制批量结果准确度
plt.plot(batch_accuracy,'k-',label='精确度')
plt.title('批量精确度')
plt.xlabel('迭代次数')
plt.ylabel('精确度')
plt.legend(loc='lower right')
plt.show()

#绘制损失函数
plt.plot(loss_vec,'k-')
plt.title('损失函数/迭代')
plt.xlabel('迭代次数')
plt.ylabel('损失误差')
plt.show()
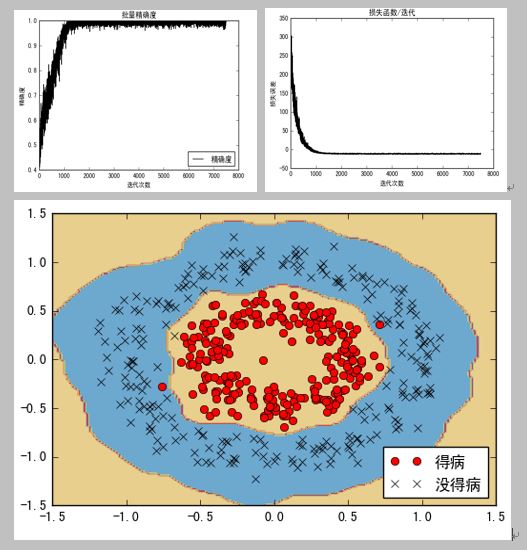
训练效果与分类结果:

更多技术干货请关注:
