Box画法笔记
import pandas as pd
normal_sample = np.random.normal(loc=0.0, scale=1.0, size=10000)
random_sample = np.random.random(size=10000)
gamma_sample = np.random.gamma(2, size=10000)

df = pd.DataFrame({'normal': normal_sample,
                   'random': random_sample,
                   'gamma': gamma_sample})
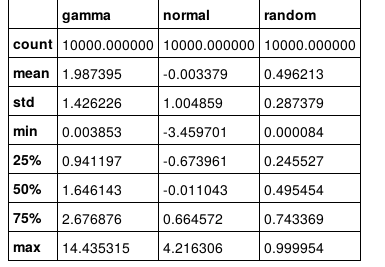
df.describe()
2.作图
plt.figure()
# create a boxplot of the normal data, assign the output to a variable to supress output
_ = plt.boxplot(df['normal'], whis='range')

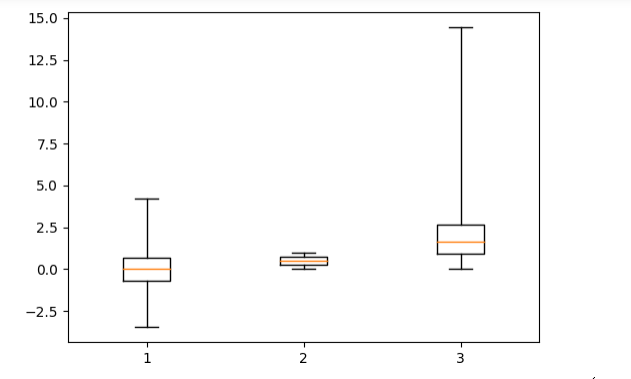
3. 显示三列
# clear the current figure
plt.clf()
# plot boxplots for all three of df's columns
_ = plt.boxplot([ df['normal'], df['random'], df['gamma'] ], whis='range')
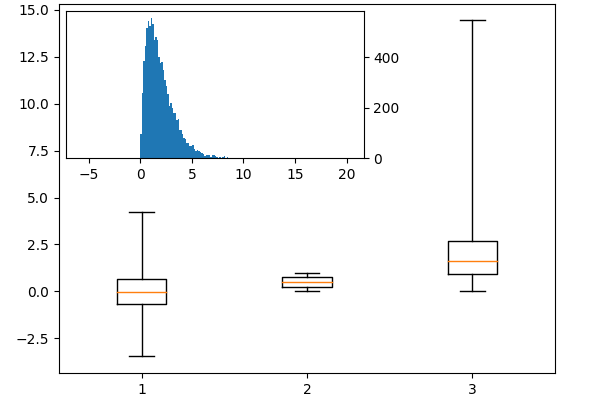
4.
import mpl_toolkits.axes_grid1.inset_locator as mpl_il

plt.figure()
plt.boxplot([ df['normal'], df['random'], df['gamma'] ], whis='range')
# overlay axis on top of another
ax2 = mpl_il.inset_axes(plt.gca(), width='60%', height='40%', loc=2)
ax2.hist(df['gamma'], bins=100)
ax2.margins(x=0.5)
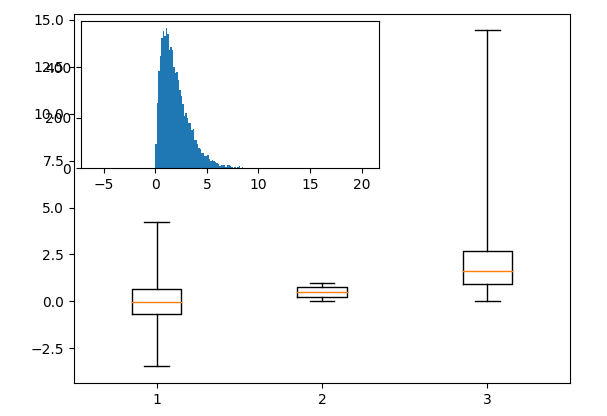
5. y坐标标记转换位置
# switch the y axis ticks for ax2 to the right side
ax2.yaxis.tick_right()
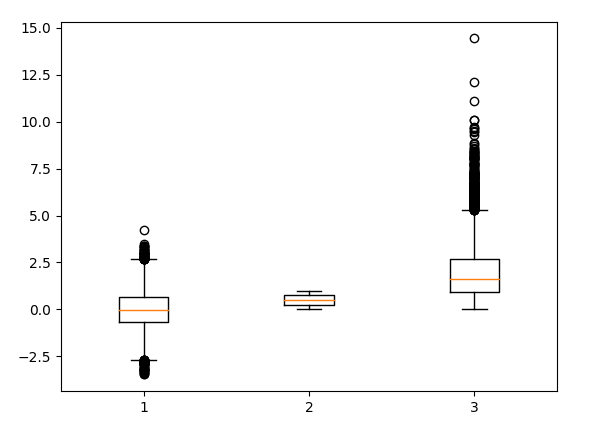
6. whis的妙用
# if `whis` argument isn't passed, boxplot defaults to showing 1.5*interquartile (IQR) whiskers with outliers
plt.figure()
_ = plt.boxplot([ df['normal'], df['random'], df['gamma'] ] )