zoukankan      html  css  js  c++  java
  • echarts ajax请求demo

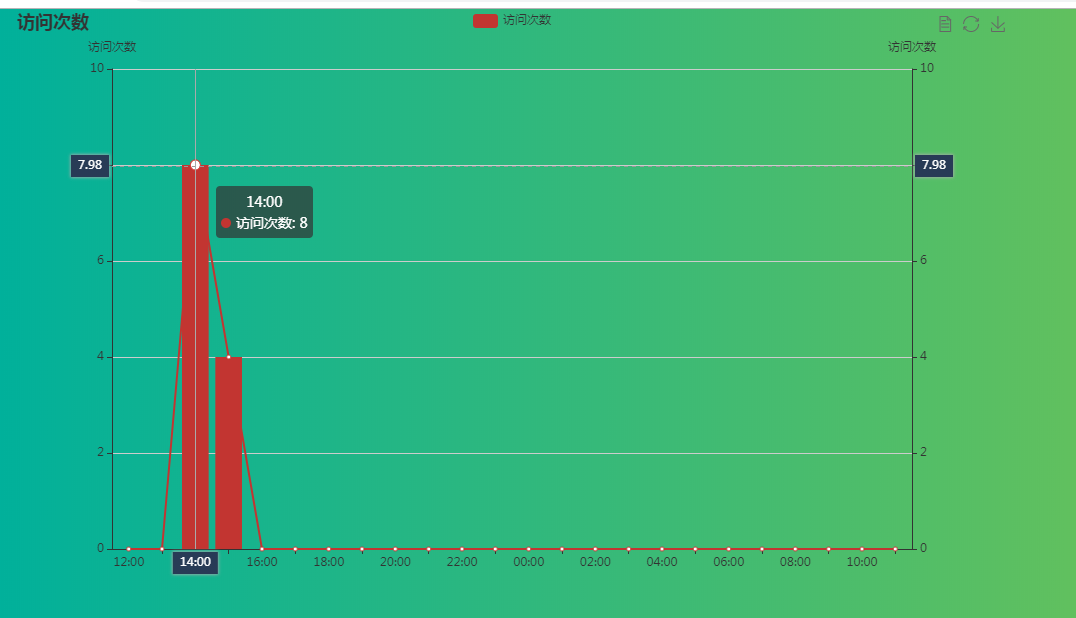
    <body>
     <!--为ECharts准备一个具备大小(宽高)的Dom-->
    <div id="main" style=" 1000px;height:600px;margin-left: 20px"></div>
    <script type="text/javascript">
        // 基于准备好的dom,初始化echarts实例
        var myChart = echarts.init(document.getElementById('main'));
        // 指定图表的配置项和数据
        var option = {};
        var seriesData = []
        var xAxisData = [];
        $(function () {
            $.ajax({
                type: 'GET',
                url: 'admin/logData',
                dataType: 'JSON',
                success: function (res) {
                    if(res.code !="000"){
                        return;
                    }
                    var data = res.data;
                    for(var i=0;i<data.length;i++){
                        xAxisData.unshift(data[i].hour);
                        seriesData.unshift(data[i].count);
                    }
                    setOptions(xAxisData,seriesData);
                }
            });
    
        })
        function setOptions(xAxisData,seriesData){
            option = {
                title: {
                    text: '访问次数',
                },
                tooltip: {
                    trigger: 'axis',
                    axisPointer: {
                        type: 'cross',
                        label: {
                            backgroundColor: '#283b56'
                        }
                    }
                },
                legend: {
                    data:['访问次数']
                },
                toolbox: {
                    show: true,
                    feature: {
                        dataView: {readOnly: false},
                        restore: {},
                        saveAsImage: {}
                    }
                },
                dataZoom: {
                    show: false,
                    start: 0,
                    end: 100
                },
                xAxis: [
                    {
                        type: 'category',
                        boundaryGap: true,
                        data: xAxisData,
                    },
                    {
                        type: 'category',
                        boundaryGap: true,
                        data: (function (){
                            var res = [];
                            return res;
                        })()
                    }
                ],
                yAxis: [
                    {
                        type: 'value',
                        scale: true,
                        name: '访问次数',
                        max: 10,
                        min: 0,
                        boundaryGap: [1, 1]
                    },
                    {
                        type: 'value',
                        scale: true,
                        name: '访问次数',
                        max: 10,
                        min: 0,
                        boundaryGap: [1, 1]
                    }
                ],
                series: [
                    {
                        name:'访问次数',
                        type:'bar',
                        xAxisIndex: 1,
                        yAxisIndex: 1,
                        data:seriesData
                    },
                    {
                        name:'访问次数',
                        type:'line',
                        data:seriesData
                    }
                ]
            };
            // 使用刚指定的配置项和数据显示图表。
            myChart.setOption(option);
        };
    
    
    </script>
    </body>

     请求数据参考:https://www.cnblogs.com/SimonHu1993/p/11021929.html

  • 相关阅读:
    常见加密算法概述
    IDEA常见错误解决
    linux Find命令教程
    用注册表更改DNS的代码分享
    关于javascript中的typeof和instanceof介绍
    javascript instanceof,typeof的区别
    Javascript typeof 用法
    浅析JavaScript中的typeof运算符
    玩转Linux文件描述符和重定向
    shell脚本 批量转换目录下文件编码
  • 原文地址:https://www.cnblogs.com/SimonHu1993/p/11022310.html
Copyright © 2011-2022 走看看