import pandas as pd
import matplotlib.pyplot as plt
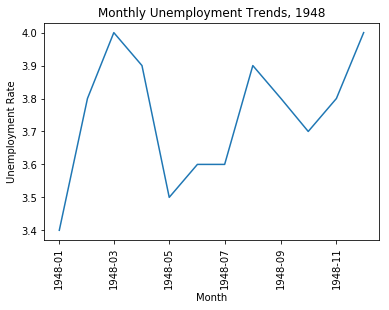
unrate = pd.read_csv('unrate.csv')
unrate['DATE'] = pd.to_datetime(unrate['DATE'])
first_twelve = unrate[0:12]
plt.plot(first_twelve['DATE'], first_twelve['VALUE'])
plt.xticks(rotation=90)
plt.xlabel('Month')
plt.ylabel('Unemployment Rate')
plt.title('Monthly Unemployment Trends, 1948')
plt.show()
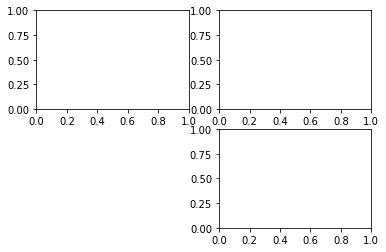
# add_subplot(first,second,index) first means number of Row, second means number of Column
import matplotlib.pyplot as plt
fig = plt.figure()
ax1 = fig.add_subplot(2,2,1)
ax2 = fig.add_subplot(2,2,2)
ax3 = fig.add_subplot(2,2,4)
plt.show()
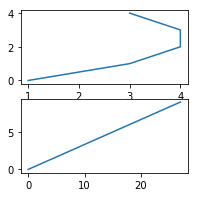
import numpy as np
fig = plt.figure()
fig = plt.figure(figsize=(3,3))
ax1 = fig.add_subplot(2,1,1)
ax2 = fig.add_subplot(2,1,2)

ax1.plot(np.random.randint(1,5,5),np.arange(5))
ax2.plot(np.arange(10)*3,np.arange(10))
plt.show()
<Figure size 432x288 with 0 Axes>

unrate['MONTH'] = unrate['DATE'].dt.month
unrate['MONTH'] = unrate['DATE'].dt.month
fig = plt.figure(figsize=(6,3))
plt.plot(unrate[0:12]['MONTH'],unrate[0:12]['VALUE'],c='red')
plt.plot(unrate[12:24]['MONTH'],unrate[12:24]['VALUE'],c='blue')
plt.show()
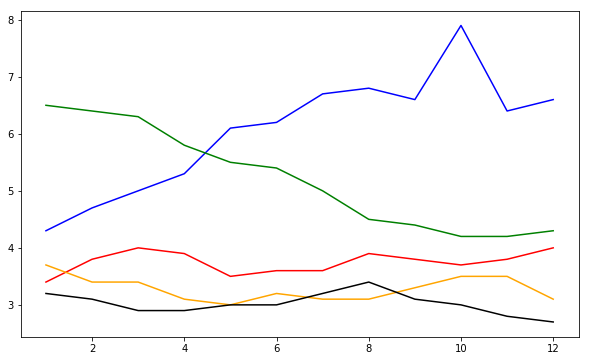
fig = plt.figure(figsize=(10,6))
colors = ['red','blue','green','orange','black']
for i in range(5):
    start_index = i*12
    end_index = (i+1)*12
    subset = unrate[start_index:end_index]
    plt.plot(subset['MONTH'],subset['VALUE'],c=colors[i])
plt.show()
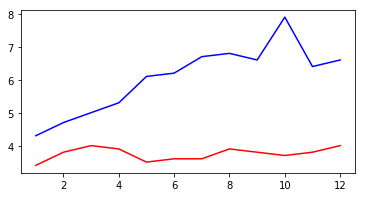
fig = plt.figure(figsize=(10,6))
colors = ['red','blue','green','orange','black']
for i in range(5):
    start_index = i*12
    end_index = (i+1)*12
    subset = unrate[start_index:end_index]
    label = str(1948+i)
    plt.plot(subset['MONTH'],subset['VALUE'],c=colors[i],label=label)
plt.legend(loc='best')
plt.show()

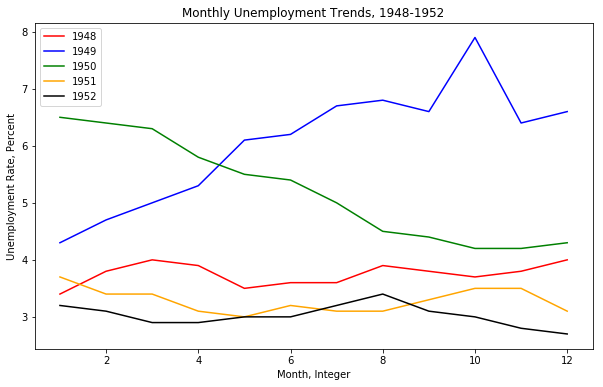
fig = plt.figure(figsize=(10,6))
colors = ['red', 'blue', 'green', 'orange', 'black']
for i in range(5):
    start_index = i*12
    end_index = (i+1)*12
    subset = unrate[start_index:end_index]
    label = str(1948 + i)
    plt.plot(subset['MONTH'], subset['VALUE'], c=colors[i], label=label)
plt.legend(loc='upper left')
plt.xlabel('Month, Integer')
plt.ylabel('Unemployment Rate, Percent')
plt.title('Monthly Unemployment Trends, 1948-1952')

plt.show()