http://www.jqplot.com/tests/coretests.php
http://jpuzi.com/html/effect16.html
A Versatile and Expandable jQuery Plotting Plugin!
jqPlot is a plotting and charting plugin for the jQuery Javascript framework. jqPlot produces beautiful line, bar and pie charts with many features:
- Numerous chart style options.
- Date axes with customizable formatting.
- Up to 9 Y axes.
- Rotated axis text.
- Automatic trend line computation.
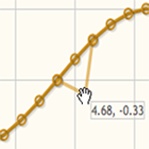
- Tooltips and data point highlighting.
- Sensible defaults for ease of use.
jqPlot is an open source project by Chris Leonello
Download Now! 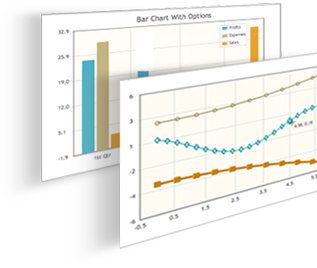
Free and Open Source...but worth more!
Consider a Donation.
jqPlot's Strongest Feature is its Pluggability!
Computation and drawing of lines, axes, shadows even the grid itself is handled by pluggable "renderers". Not only are the plot elements customizable, plugins can expand functionality of the plot too! There are plenty of hooks into the core jqPlot code allowing for custom event handlers, creation of new plot types, adding canvases to the plot, and more!
 |
 |
 |
|
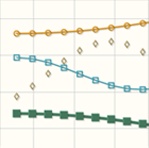
Numerous line style options with 6 built in marker styles! |
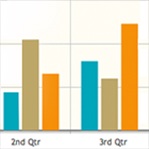
Horizontal and vertical Bar charts! |
Shadow control on lines, markers, the grid, everything! |
 |
 |
 |
|
Drag and drop points with auto updating of data! |
Log Axes with flexible tick marks! |
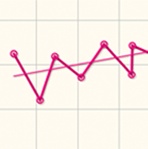
Trend lines computed automatically! |
jqPlot has been tested on IE 6, IE 7, IE 8, Firefox, Safari, and Opera. You can see jqPlot in action on the tests & examples page.