一、简介:
blackbox_exporter是Prometheus 官方提供的 exporter 之一,可以提供 http、dns、tcp、icmp 的监控数据采集。
Blackbox_exporter 应用场景
HTTP 测试
定义 Request Header 信息
判断 Http status / Http Respones Header / Http Body 内容
TCP 测试
业务组件端口状态监听
应用层协议定义与监听
ICMP 测试
主机探活机制
POST 测试
接口联通性
SSL 证书过期时间
2、安装blackbox_exporter:
$ wget https://github.com/prometheus/blackbox_exporter/releases/download/v0.16.0/blackbox_exporter-0.16.0.linux-amd64.tar.gz
$ cd /usr/local/src
$ tar -xvf blackbox_exporter-0.16.0.linux-amd64.tar.gz
$ mv blackbox_exporter-0.16.0.linux-amd64.tar.gz blackbox_exporter
验证是安装版本
cd /usr/local/src/blackbox_exporter
[root@localhost blackbox_exporter]# ./blackbox_exporter --version
blackbox_exporter, version 0.16.0 (branch: HEAD, revision: 991f89846ae10db22a3933356a7d196642fcb9a9)
build user: root@64f600555645
build date: 20191111-16:27:24
go version: go1.13.4
创建systemd服务
 vim /lib/systemd/system/blackbox_exporter.service

[Unit]
Description=blackbox_exporter
After=network.target

[Service]
User=root
Type=simple
ExecStart=/usr/local/src/blackbox_exporter/blackbox_exporter --config.file=/usr/local/src/blackbox_exporter/blackbox.yml
Restart=on-failure

[Install]
WantedBy=multi-user.target
如果以非root用户运行blackbox_exporter,为了使用icmp prober,需要设置CAP_NET_RAW,即对可执行文件blackbox_exporter执行下面的命令:
$ cd /usr/local/src/blackbox_exporter
$ setcap cap_net_raw+ep blackbox_exporter
启动blackbox_exporter
$ systemctl daemon-reload
$ systemctl start blackbox_exporter
验证是否启动成功
默认监听端口为9115
$ systemctl status blackbox_exporter
$ netstat -lnpt|grep 9115
3、安装prometheus
wget https://github.com/prometheus/prometheus/releases/download/v2.19.2/prometheus-2.19.2.linux-amd64.tar.gz
tar -xvf prometheus-2.19.2.linux-amd64.tar.gz
mv  prometheus-2.19.2.linux-amd64 prometheus
验证安装版本:
[root@localhost prometheus]# ./prometheus --version
prometheus, version 2.19.2 (branch: HEAD, revision: c448ada63d83002e9c1d2c9f84e09f55a61f0ff7)
  build user:       root@dd72efe1549d
  build date:       20200626-09:02:20
  go version:       go1.14.4
创建systemd服务
vim /lib/systemd/system/prometheus.service
[Unit]
Description=prometheus
After=network.target

[Service]
User=root
Type=simple
ExecStart=/usr/local/src/prometheus/prometheus --config.file=/usr/local/src/prometheus/prometheus.yml
Restart=on-failure

[Install]
WantedBy=multi-user.target
启动 prometheus:
systemctl daemon-reload
systemctl start prometheus.service
4、grafana安装部署:
参考Grafana官网文档:https://grafana.com/docs/grafana/latest/installation/rpm/#install-from-yum-repository
下载rpm文件,并使用yum install命令安装
wget https://dl.grafana.com/oss/release/grafana-7.0.4-1.x86_64.rpm
sudo yum install grafana-7.0.4-1.x86_64.rpm
grafana启动和查看状态:
sudo systemctl daemon-reload
sudo systemctl start grafana-server
sudo systemctl status grafana-server
grafana查看版本:
grafana-server -v
grafana设置开机自启:
systemctl enable grafana-server
grafana安装包信息:
二进制文件: /usr/sbin/grafana-server
init.d 脚本: /etc/init.d/grafana-server
环境变量文件: /etc/sysconfig/grafana-server
配置文件: /etc/grafana/grafana.ini
启动项: grafana-server.service
日志文件:/var/log/grafana/grafana.log
默认配置的sqlite3数据库:/var/lib/grafana/grafana.db
grafana访问地址:
默认端口是3000,访问地址:http://IP:3000
默认账号/密码:admin/admin

5、prometheus.yml中加入blackbox_exporter
1.检查主机存活状态:
$ vim /usr/local/prometheus/prometheus.yml

  - job_name: 'node_status'
    metrics_path: /probe
    params:
      module: [icmp]
    static_configs:
      - targets: ['127.0.0.1']
        labels:
          instance: 'node_status'
          group: 'node'
    relabel_configs:
      - source_labels: [__address__]
        target_label: __param_target
        #      - source_labels: [__param_target]
        #        target_label: instance
      - target_label: __address__
        replacement: 127.0.0.1:9115
2.监控主机端口存活状态
$ vim /usr/local/prometheus/prometheus.yml

  - job_name: 'port_status'
    metrics_path: /probe
    params:
      module: [tcp_connect]
    static_configs:
      - targets: ['127.0.0.1:9100','127.0.0.1:9090']
        labels:
          instance: 'port_status'
          group: 'tcp'
    relabel_configs:
      - source_labels: [__address__]
        target_label: __param_target
        #      - source_labels: [__param_target]
        #        target_label: instance
      - target_label: __address__
        replacement: 127.0.0.1:9115
3.监控网站状态
$ vim /usr/local/prometheus/prometheus.yml

  - job_name: web_status
    metrics_path: /probe
    params:
      module: [http_2xx]
    static_configs:
      - targets: ['https://www.baidu.com']
        labels:
          instance: web_status
          group: web
    relabel_configs:
      - source_labels: [__address__]
        target_label: __param_target
      - target_label: __address__
        replacement: 127.0.0.1:9115
检查配置文件是否书写正确:
$ cd /usr/local/src/prometheus
[root@localhost prometheus]# ./promtool check config prometheus.yml
Checking prometheus.yml
SUCCESS: 0 rule files found
重新加载prometheus的配置
systemctl reload prometheus
或
curl -X POST http://127.0.0.1:9090/-/reload (启用了--web.enable-lifecycle选项)
访问web界面
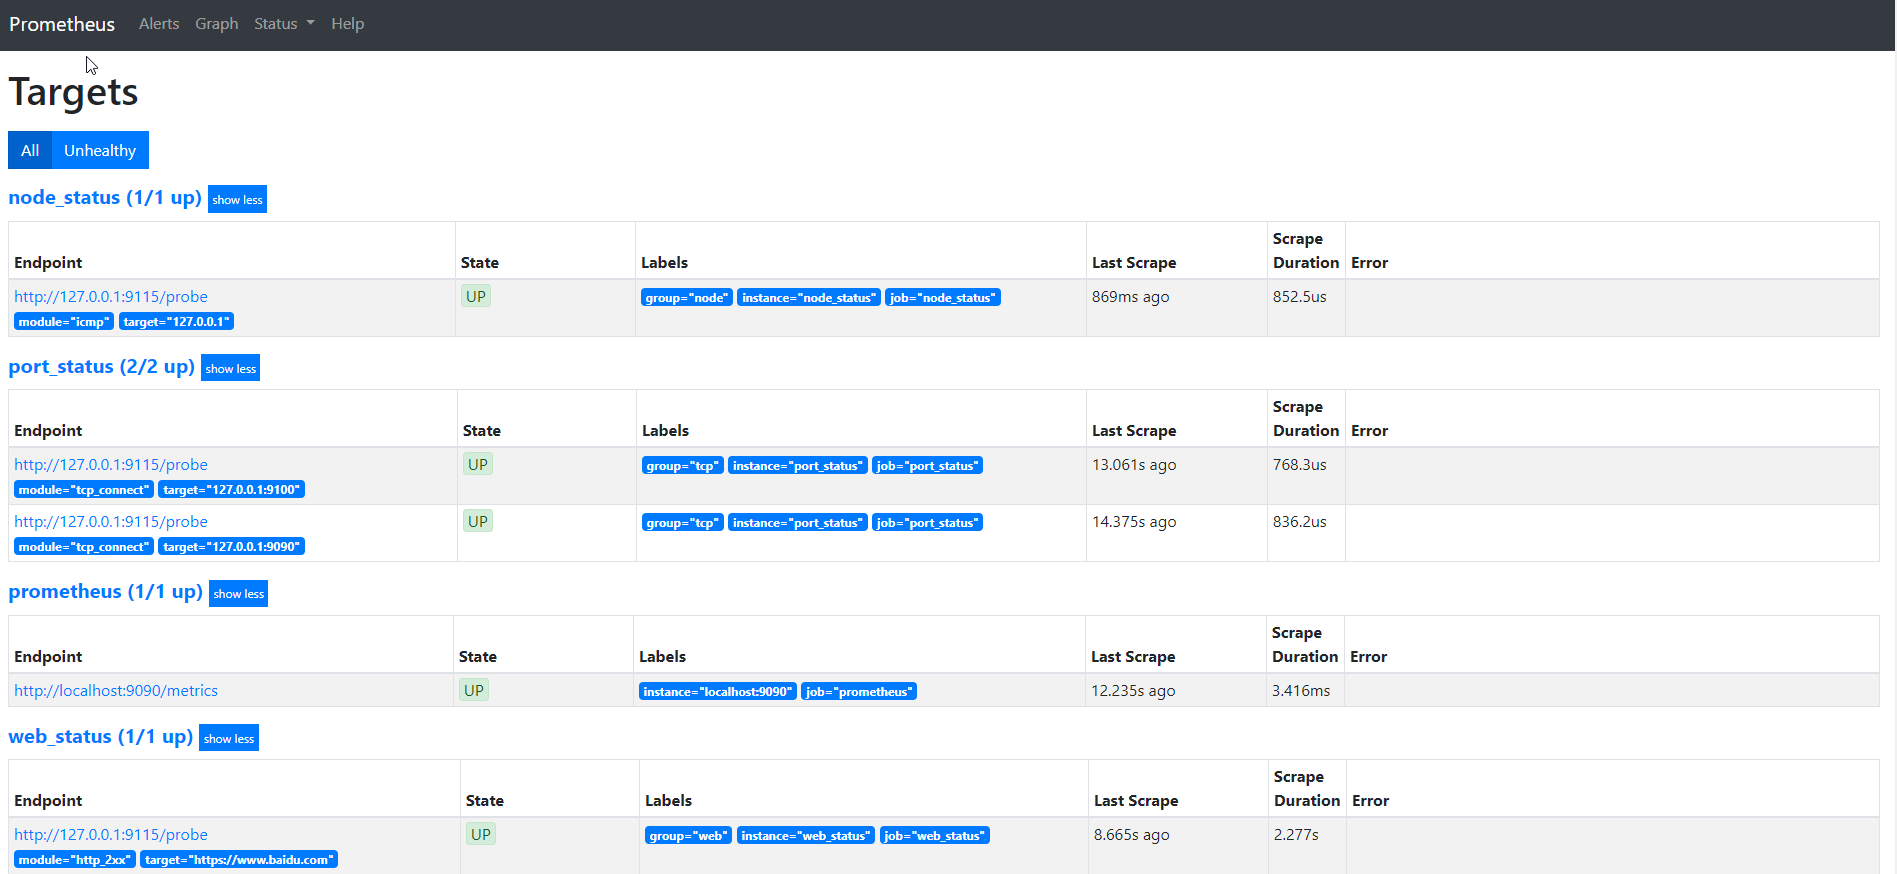
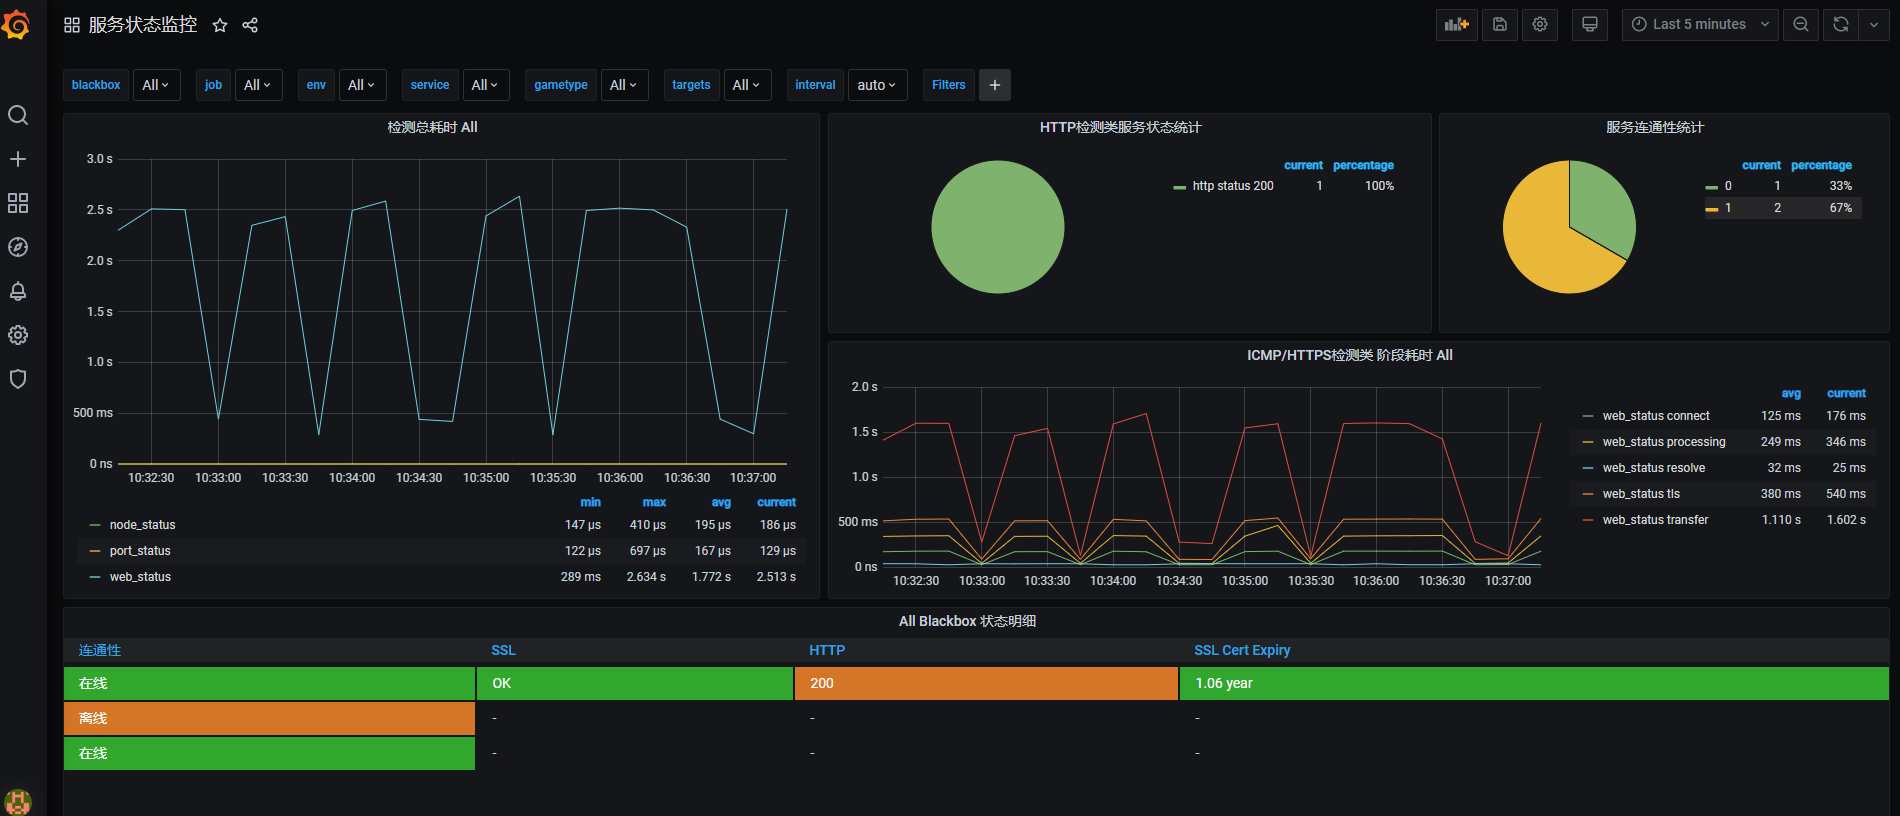
6、grafana中加入blackbox_exporter监控数据
导入blackbox_exporter模板 此模板为9965号模板,数据源选择Prometheus 模板下载地址 https://grafana.com/grafana/dashboards/9965

此模板需要安装饼状图插件 下载地址 https://grafana.com/grafana/plugins/grafana-piechart-panel
安装插件,重启grafana生效。
$ grafana-cli plugins install grafana-piechart-panel
$ service grafana-server restart
查看监控数据:
备注:本文是监控本机的相关端口进行测试的,如果需要监听其它主机。需要在其它主机上面安装 blackbox_exportex
安装完成后,需要在prometheus.yml今天添加相关监控指标: