zoukankan      html  css  js  c++  java
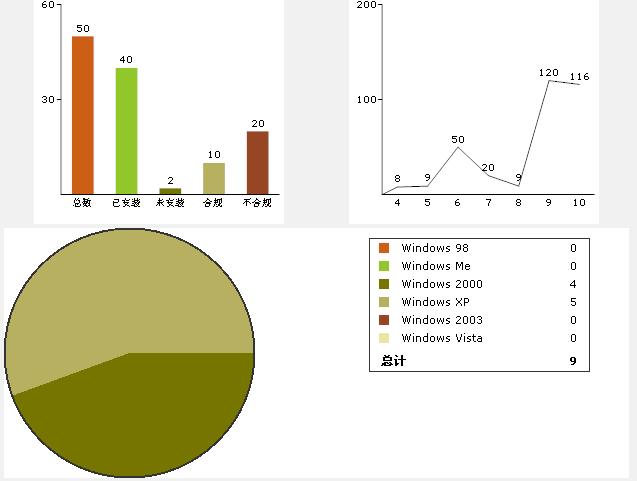
  • .net web图表类


    https://files.cnblogs.com/ahuo/Chart.rar

    用法:
                Response.ContentType = "image/png";
                string[] xValues, yValues;
                LineChart line = new LineChart(Color.White);
                line.VerticalLabel = "告警数量";
                line.ShowLegend = false;
                line.ShowData = true;
                line.Height = 250;
                line.Width = 250;
                GetValues(out xValues, out yValues); //填充数据
                line.CollectDataPoints(xValues, yValues);
                Bitmap StockBitMap = line.Draw();
                MemoryStream memStream = new MemoryStream();
                StockBitMap.Save(memStream, ImageFormat.Png);
                memStream.WriteTo(Response.OutputStream);
  • 相关阅读:
    npx
    EOS踩坑记 2
    Communication Model
    EOS踩坑记
    Windows导入EOS工程
    搭建EOS环境
    加入EOS主网
    Add Inline Actions
    Secondary Indices
    Data Persistence
  • 原文地址:https://www.cnblogs.com/ahuo/p/814232.html
Copyright © 2011-2022 走看看