对于有图形化界面的用户来,jconsole就可以搞定,界面使用很简单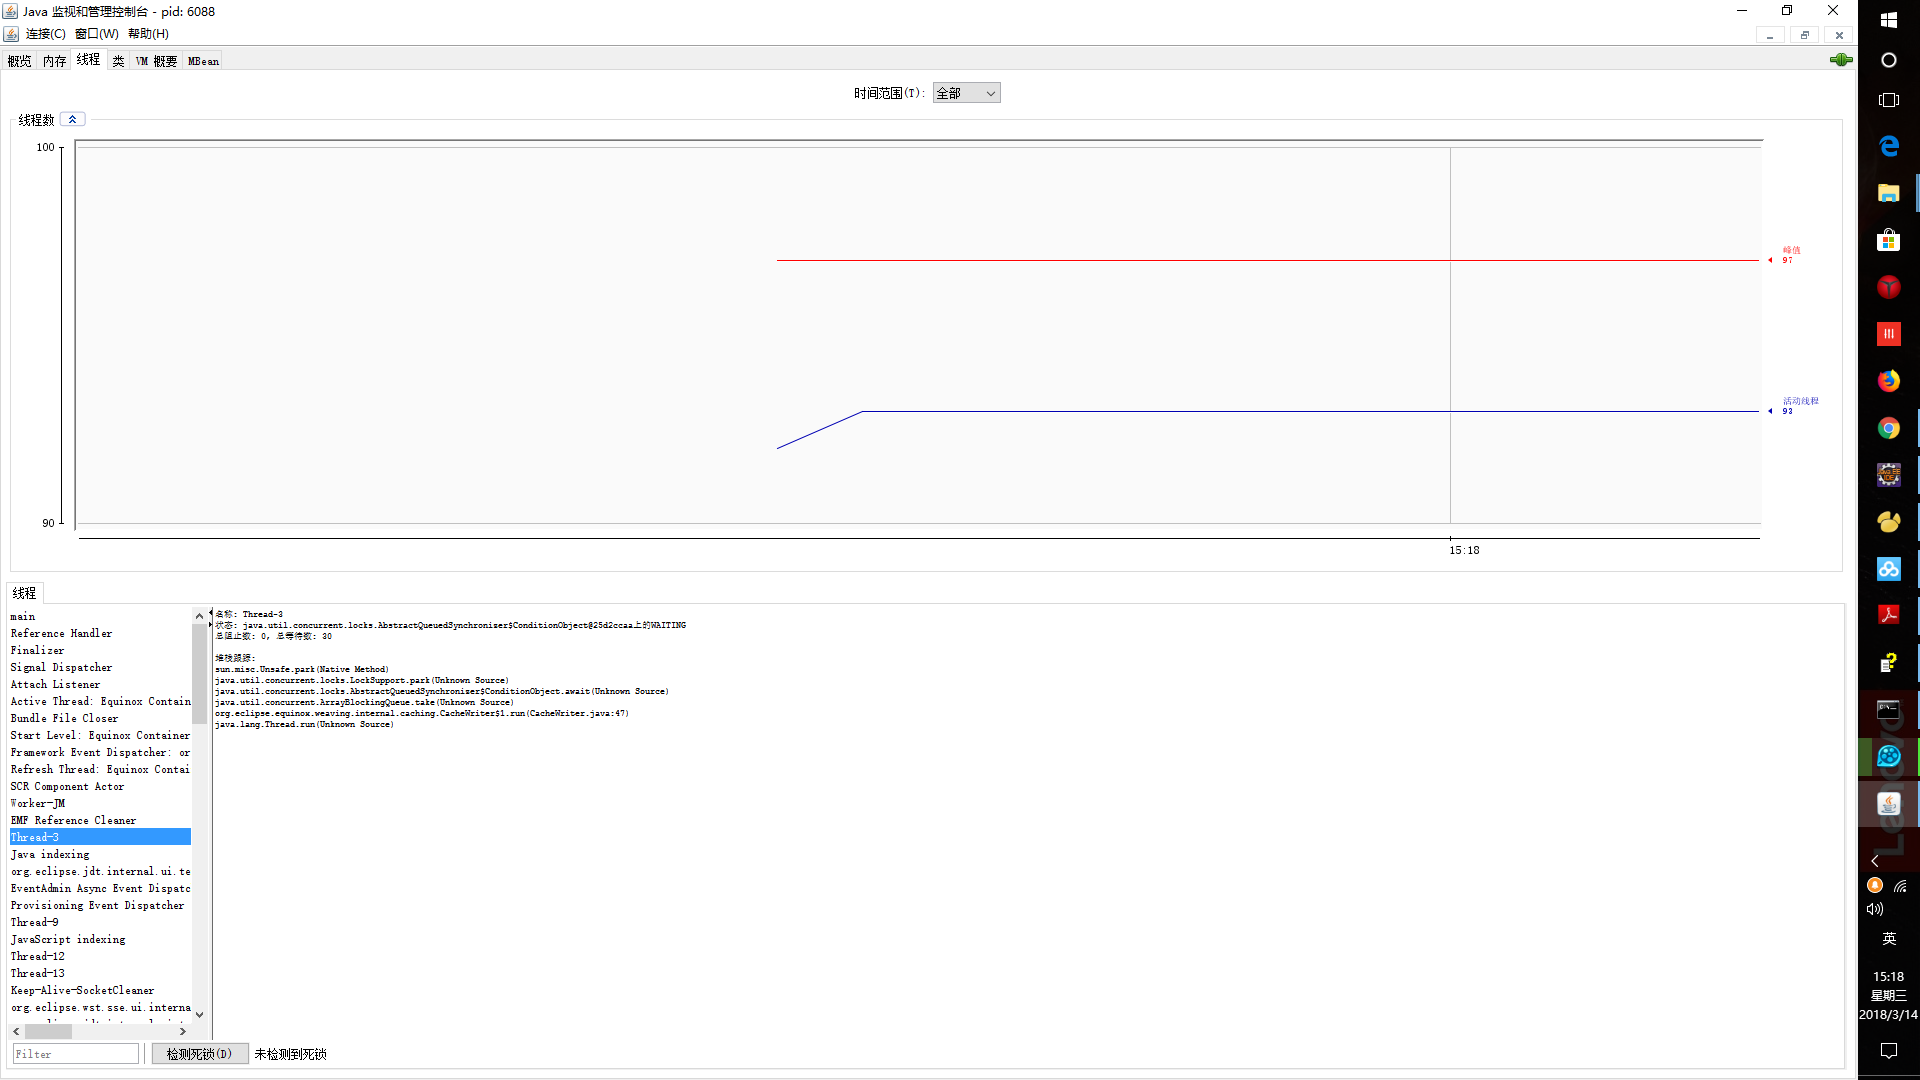
还可以查看很多信息,例如检测死锁。
下面是没有图形化界面的系统 可以用命令 :
jps
查看jvm 进程
jstack -l 6088
查看 jvm 启动参数的命令
root@VM-185-251-ubuntu:/home/ubuntu# jinfo -flags 17809
返回值如下
Attaching to process ID 17809, please wait...
Debugger attached successfully.
Server compiler detected.
JVM version is 25.161-b12
Non-default VM flags: -XX:CICompilerCount=2 -XX:InitialHeapSize=31457280 -XX:+ManagementServer -XX:MaxHeapSize=1048576000 -XX:MaxNewSize=349503488 -XX:MinHeapDeltaBytes=196608 -XX:NewSize=10485760 -XX:OldSize=20971520 -XX:+UseCompressedClassPointers -XX:+UseCompressedOops
Command line: -Dzookeeper.log.dir=. -Dzookeeper.root.logger=INFO,CONSOLE -Xmx1000m -Dcom.sun.management.jmxremote -Dcom.sun.management.jmxremote.local.only=false
root@VM-185-251-ubuntu:/home/ubuntu# jmap -heap 17809
Attaching to process ID 17809, please wait...
Debugger attached successfully.
Server compiler detected.
JVM version is 25.161-b12
root@VM-185-251-ubuntu:/home/ubuntu# jmap -heap 17809
Attaching to process ID 17809, please wait...
Debugger attached successfully.
Server compiler detected.
JVM version is 25.161-b12
using thread-local object allocation.
Mark Sweep Compact GC
Heap Configuration:
MinHeapFreeRatio = 40
MaxHeapFreeRatio = 70
MaxHeapSize = 1048576000 (1000.0MB)
NewSize = 10485760 (10.0MB)
MaxNewSize = 349503488 (333.3125MB)
OldSize = 20971520 (20.0MB)
NewRatio = 2
SurvivorRatio = 8
MetaspaceSize = 21807104 (20.796875MB)
CompressedClassSpaceSize = 1073741824 (1024.0MB)
MaxMetaspaceSize = 17592186044415 MB
G1HeapRegionSize = 0 (0.0MB)
Heap Usage:
New Generation (Eden + 1 Survivor Space):
capacity = 9437184 (9.0MB)
used = 5564648 (5.306861877441406MB)
free = 3872536 (3.6931381225585938MB)
58.96513197157118% used
Eden Space:
capacity = 8388608 (8.0MB)
used = 5457256 (5.204444885253906MB)
free = 2931352 (2.7955551147460938MB)
65.05556106567383% used
From Space:
capacity = 1048576 (1.0MB)
used = 107392 (0.1024169921875MB)
free = 941184 (0.8975830078125MB)
10.24169921875% used
To Space:
capacity = 1048576 (1.0MB)
used = 0 (0.0MB)
free = 1048576 (1.0MB)
0.0% used
tenured generation:
capacity = 20971520 (20.0MB)
used = 3766176 (3.591705322265625MB)
free = 17205344 (16.408294677734375MB)
17.958526611328125% used
4090 interned Strings occupying 322344 bytes.
root@VM-185-251-ubuntu:/home/ubuntu# jcmd 17809 VM.flags
17809:
-XX:CICompilerCount=2 -XX:InitialHeapSize=31457280 -XX:+ManagementServer -XX:MaxHeapSize=1048576000 -XX:MaxNewSize=349503488 -XX:MinHeapDeltaBytes=196608 -XX:NewSize=10485760 -XX:OldSize=20971520 -XX:+UseCompressedClassPointers -XX:+UseCompressedOops
jmap -histo:live 12001 查看(活着)类的数量
num #instances #bytes class name
----------------------------------------------
1: 3497 1966552 [Ljava.lang.Object;
2: 4274 1108280 [B
3: 13508 1038624 [C
4: 858 562848 io.netty.util.internal.shaded.org.jctools.queues.MpscArrayQueue
5: 3249 372384 java.lang.Class
6: 13374 320976 java.lang.String
7: 1964 136536 [I
8: 2438 78016 java.util.HashMap$Node
9: 2373 75936 java.util.concurrent.ConcurrentHashMap$Node
10: 1410 56400 java.util.LinkedHashMap$Entry
11: 73 53840 [Lio.netty.util.Recycler$DefaultHandle;
12: 313 49520 [Ljava.util.HashMap$Node;
13: 1316 42112 sun.security.util.DerInputBuffer
14: 1316 42112 sun.security.util.DerValue
15: 10 32960 [Ljava.nio.channels.SelectionKey;
16: 397 32712 [Ljava.lang.String;
17: 1316 31584 sun.security.util.DerInputStream
18: 780 31200 java.util.TreeMap$Entry
19: 1297 31128 [Lsun.security.x509.AVA;
20: 1297 31128 sun.security.x509.AVA
21: 1297 31128 sun.security.x509.RDN
22: 1795 28720 java.lang.Object
23: 811 25952 java.util.Hashtable$Entry
24: 792 25344 io.netty.buffer.PoolThreadCache$SubPageMemoryRegionCache
25: 633 25320 java.lang.ref.SoftReference
26: 625 25000 java.math.BigInteger
27: 45 24880 [Ljava.util.concurrent.ConcurrentHashMap$Node;
28: 668 21376 sun.security.util.ObjectIdentifier
29: 630 20160 java.lang.ref.WeakReference
30: 10 17120 [Lio.netty.buffer.PoolSubpage;
31: 343 16464 sun.security.x509.X500Name
32: 180 15840 java.lang.reflect.Method
33: 658 15792 java.util.ArrayList
34: 491 15712 sun.security.x509.AlgorithmId
35: 312 14976 java.util.HashMap
36: 613 14712 org.apache.rocketmq.common.MQVersion$Version
显示活着的类的数量,所占空间 类全名
jstat -gc 6892 3000
S0C S1C S0U S1U EC EU OC OU MC MU CCSC CCSU YGC YGCT FGC FGCT GCT
0.0 16384.0 0.0 16384.0 131072.0 65536.0 114688.0 25684.5 22320.0 21724.9 2304.0 2163.4 121 0.792 0 0.000 0.792
0.0 16384.0 0.0 16384.0 131072.0 65536.0 114688.0 25684.5 22320.0 21724.9 2304.0 2163.4 121 0.792 0 0.000 0.792
0.0 16384.0 0.0 16384.0 131072.0 65536.0 114688.0 25684.5 22320.0 21724.9 2304.0 2163.4 121 0.792 0 0.000 0.792
0.0 16384.0 0.0 16384.0 131072.0 65536.0 114688.0 25684.5 22320.0 21724.9 2304.0 2163.4 121 0.792 0 0.000 0.792
0.0 16384.0 0.0 16384.0 131072.0 65536.0 114688.0 25684.5 22320.0 21724.9 2304.0 2163.4 121 0.792 0 0.000 0.792
0.0 16384.0 0.0 16384.0 131072.0 65536.0 114688.0 25684.5 22320.0 21724.9 2304.0 2163.4 121 0.792 0 0.000 0.792
0.0 16384.0 0.0 16384.0 131072.0 65536.0 114688.0 25684.5 22320.0 21724.9 2304.0 2163.4 121 0.792 0 0.000 0.792
查看GC情况。
无法attach进程的错误
Error attaching to process: sun.jvm.hotspot.debugger.DebuggerException: Can't attach to the process: ptrace(PTRACE_ATTACH, ..) failed for 17: Operation not permitted
sun.jvm.hotspot.debugger.DebuggerException: sun.jvm.hotspot.debugger.DebuggerException: Can't attach to the process: ptrace(PTRACE_ATTACH, ..) failed for 17: Operation not permitted
at sun.jvm.hotspot.debugger.linux.LinuxDebuggerLocal$LinuxDebuggerLocalWorkerThread.execute(LinuxDebuggerLocal.java:163)
at sun.jvm.hotspot.debugger.linux.LinuxDebuggerLocal.attach(LinuxDebuggerLocal.java:278)
at sun.jvm.hotspot.HotSpotAgent.attachDebugger(HotSpotAgent.java:671)
at sun.jvm.hotspot.HotSpotAgent.setupDebuggerLinux(HotSpotAgent.java:611)
at sun.jvm.hotspot.HotSpotAgent.setupDebugger(HotSpotAgent.java:337)
at sun.jvm.hotspot.HotSpotAgent.go(HotSpotAgent.java:304)
at sun.jvm.hotspot.HotSpotAgent.attach(HotSpotAgent.java:140)
at sun.jvm.hotspot.tools.Tool.start(Tool.java:185)
at sun.jvm.hotspot.tools.Tool.execute(Tool.java:118)
at sun.jvm.hotspot.tools.JInfo.main(JInfo.java:138)
at sun.reflect.NativeMethodAccessorImpl.invoke0(Native Method)
at sun.reflect.NativeMethodAccessorImpl.invoke(NativeMethodAccessorImpl.java:62)
at sun.reflect.DelegatingMethodAccessorImpl.invoke(DelegatingMethodAccessorImpl.java:43)
at java.lang.reflect.Method.invoke(Method.java:498)
at sun.tools.jinfo.JInfo.runTool(JInfo.java:108)
at sun.tools.jinfo.JInfo.main(JInfo.java:76)
Caused by: sun.jvm.hotspot.debugger.DebuggerException: Can't attach to the process: ptrace(PTRACE_ATTACH, ..) failed for 17: Operation not permitted
at sun.jvm.hotspot.debugger.linux.LinuxDebuggerLocal.attach0(Native Method)
at sun.jvm.hotspot.debugger.linux.LinuxDebuggerLocal.access$100(LinuxDebuggerLocal.java:62)
at sun.jvm.hotspot.debugger.linux.LinuxDebuggerLocal$1AttachTask.doit(LinuxDebuggerLocal.java:269)
at sun.jvm.hotspot.debugger.linux.LinuxDebuggerLocal$LinuxDebuggerLocalWorkerThread.run(LinuxDebuggerLocal.java:138)
sudo vi /etc/sysctl.d/10-ptrace.conf
编辑下面这行:
kernel.yama.ptrace_scope = 1
修改为:
kernel.yama.ptrace_scope = 0
重启系统,使修改生效。