关键词:sar、sadc、ksar、/proc/stat、/proc/cpuinfo、/proc/meminfo、/proc/diskstats。
在之前有简单介绍过sar/ksar,最近在使用中感觉需要再深入了解一下。
ksar/sar从内核采集数据,并输出可读性数据。分析相关源码,有助于知道数据来龙去脉。--------------------------------------1. sar源码概览
ksar显示sar/sadc获取的数据,并图形化显示。数据从内核节点,到sadc/sar转换,再到ksar显示。----------------------------2. ksar处理流程
对照ksar每张图表,然后sar/sadc对应的采集转换,再到内核每个数据项含义解析。--------------------------------------------3. ksar解读
期望是从ksar上的图表能对应到内核的代码,明白这些图表数据根源。
1. sar源码概览
sar作为sysstat一部分,相关的工具还包括sadc、sa1、sa2。
sa1负责收集并存储每天系统动态信息到一个二进制的文件中,sa1是sadc所涉及的程序前端程序。通常由计划任务工具cron来调用。打开sa1文件不难看出就是调用sadc今次那个采集数据。
sa2就是调用sar命令,将当日二进制日志文件数据存储到文本文件中。
sadc是系统动态数据收集工具,收集的数据被写入一个二进制文件中,它是sar工具后端。
sar负责解析sadc保存的数据,并显示出来。
当使用sar进行数据统计的时候,通过pstree `pidof sar`,可以看出sar调用了sadc。
sar───sadc
1.1 sadc信息采样
sadc入口在sadc.c中,主要是解析参数、启动一个interval alarm、rw_sa_stat_loop()读取数据。
通过alarm触发SIGALRM实现周期性读取,SIGINT停止读取。
int main(int argc, char **argv) { int opt = 0; char ofile[MAX_FILE_LEN], sa_dir[MAX_FILE_LEN]; int stdfd = 0, ofd = -1; int restart_mark; long count = 0; /* Get HZ */ get_HZ(); /* Compute page shift in kB */ get_kb_shift(); ofile[0] = sa_dir[0] = comment[0] = '�'; ...-----------------------------------------------------------解析参数并进行配置。 /* Set a handler for SIGALRM */ memset(&alrm_act, 0, sizeof(alrm_act)); alrm_act.sa_handler = alarm_handler; sigaction(SIGALRM, &alrm_act, NULL); alarm(interval);------------------------------------------启动一个alarm,超时未interval,并通过在alarm_handler()中重新起一个alarm实现周期性处理。 /* Main loop */ rw_sa_stat_loop(count, stdfd, ofd, ofile, sa_dir); #ifdef HAVE_SENSORS /* Cleanup sensors */ sensors_cleanup(); #endif /* HAVE_SENSORS */ /* Free structures */ sa_sys_free(); return 0; }
rw_sa_stat_loop()是整个sadc的核心循环,这里从个sysfs读取信息,并提取关键信息,然后保存。
void rw_sa_stat_loop(long count, int stdfd, int ofd, char ofile[],
             char sa_dir[])
{
    int do_sa_rotat = 0;
    unsigned int save_flags;
    char new_ofile[MAX_FILE_LEN] = "";
    struct tm rectime = {0, 0, 0, 0, 0, 0, 0, 0, 0, 0, NULL};

    /* Set a handler for SIGINT */
    memset(&int_act, 0, sizeof(int_act));
    int_act.sa_handler = int_handler;
    sigaction(SIGINT, &int_act, NULL);
/* Main loop */
    do {

        reset_stats();
...
        /* Read then write stats */
        read_stats();--------------------------------------------------------遍历act[]中所有的struct activity,进行采样。

        if (stdfd >= 0) {
            save_flags = flags;
            flags &= ~S_F_LOCK_FILE;
            write_stats(stdfd);----------------------------------------------通过标准输出文件打印信息。
            flags = save_flags;
        }

        /* If the record type was R_LAST_STATS, tag it R_STATS before writing it */
        record_hdr.record_type = R_STATS;
        if (ofile[0]) {
            write_stats(ofd);------------------------------------------------将结果写到指定文件中。
        }
...
        fflush(stdout);

        if (count > 0) {
            count--;
        }

        if (count) {
            /* Wait for a signal (probably SIGALRM or SIGINT) */
            pause();----------------------------------------------------------此处和alarm()配合达到周期性采样的效果。
        }

        if (sigint_caught)----------------------------------------------------如果收到SIGINT信号,提前终止采样。
            /* SIGINT caught: Stop now */
            break;
...
    }
    while (count);------------------------------------------------------------达到总采样数,同样停止采样。

    /* Close file descriptors if they have actually been used */
    CLOSE(stdfd);
    CLOSE(ofd);
}
read_stats()是核心采集数据函数,核心数据结构式act[]。
void read_stats(void)
{
    int i;
    __nr_t cpu_nr = act[get_activity_position(act, A_CPU, EXIT_IF_NOT_FOUND)]->nr;

    record_hdr.uptime0 = 0;
    if (cpu_nr > 2) {
        read_uptime(&(record_hdr.uptime0));
    }

    for (i = 0; i < NR_ACT; i++) {
        if (IS_COLLECTED(act[i]->options)) {---------------------------------------遍历所有act[],如果act[]中对应的options包含AO_COLLECTED则进行f_read()。
            /* Read statistics for current activity */            (*act[i]->f_read)(act[i]);
        }
    }

    if (cpu_nr == 1) {
        record_hdr.uptime0 = record_hdr.uptime;
    }
}
act[]存放了所有统计事件的struct activity。
struct activity *act[NR_ACT] = {
    &cpu_act,
    &pcsw_act,
    &irq_act,
    &swap_act,
    &paging_act,
    &io_act,
    &memory_act,
    &huge_act,
    &ktables_act,
    &queue_act,
    &serial_act,
    &disk_act,
    /* <network> */
    &net_dev_act,
    &net_edev_act,
    &net_nfs_act,
    &net_nfsd_act,
    &net_sock_act,
    &net_ip_act,
    &net_eip_act,
    &net_icmp_act,
    &net_eicmp_act,
    &net_tcp_act,
    &net_etcp_act,
    &net_udp_act,
    &net_sock6_act,
    &net_ip6_act,
    &net_eip6_act,
    &net_icmp6_act,
    &net_eicmp6_act,
    &net_udp6_act,
    &fchost_act,
    &softnet_act,    /* AO_CLOSE_MARKUP */
    /* </network> */
    /* <power-management> */
    &pwr_cpufreq_act,
    &pwr_fan_act,
    &pwr_temp_act,
    &pwr_in_act,
    &pwr_wghfreq_act,
    &pwr_usb_act,        /* AO_CLOSE_MARKUP */
    /* </power-management> */
    &filesystem_act
};
1.2 sar显示统计信息
read_sadc_stat_bunch()读取统计信息,write_stats()调用每个struct activity的f_print()函数,write_stats_avg()调用每个struct activity的f_print_avg()函数。
f_print()和f_print_avg()或从文件中解析字符串,或启动sadc采样,然后再解析。
2 ksar处理流程
2.1 ksar介绍
ksar资源:ksar安装文件。
ksar中看到的图标是结果,这些数据是通过sadc采集,sar解析出来的。
sadc是通过读取sysfs/procfs节点来获取信息,这些节点都是内核提供的统计信息。
sar -o temp.bin 1 600--------------------------------------------------sar将采样数据保存在temp.bin中。
LC_ALL=C sar -A -f temp.bin > sar.txt----------------------------将保存的采样数据temp.bin,转换成更可读性强的文本文件。
所以ksar的每一张图标,都对应了内核统计信息。
sar是数据搬运整理工具,ksar是图形化工具。
下面对每张图标从ksar,到sar/sadc,最终到内核中每个数据。
2.2 ksar操作
2.2.1 数据导入
通过Data->Append from a file...从txt中加载数据,还有其他两种数据来源方式。

2.2.2 数据导出
如果要将图表导出,可以在每张图标下面选择Export PNG之类。
或者通过Export->Export to PDF...,选择指定选项。

3. ksar解析
下面结合ksar图表来逐项解析。
3.1 CPU信息
cpu_act读取/proc/stat节点,解析其中cpu信息,包括合计cpu信息以及单个cpu信息。
/proc/stat中的信息包括一个合计以及多个cpu单独统计信息。
从/proc/stat中读取的信息都是从启动以来的累计时间,在图标中显示的是一个时间段的差值。
然后计算不同模块耗时占比。
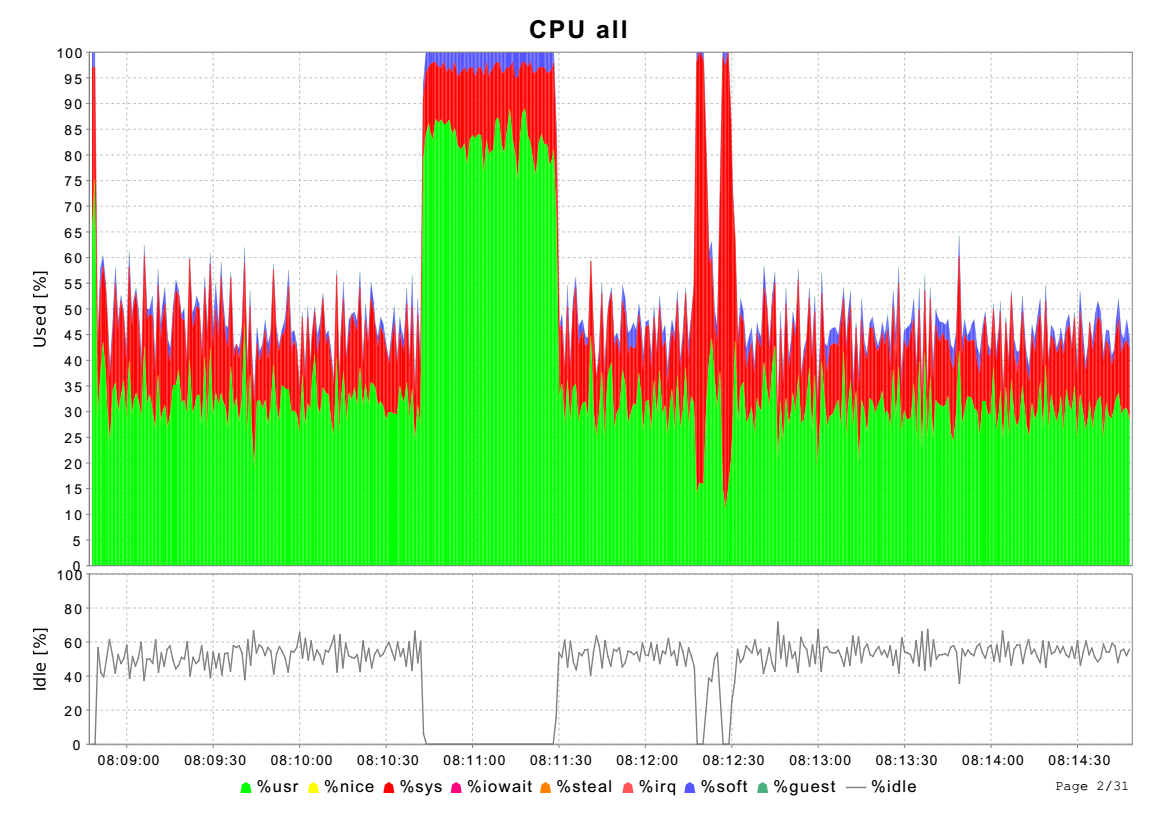
void read_stat_cpu(struct stats_cpu *st_cpu, int nbr,
           unsigned long long *uptime, unsigned long long *uptime0)
{
    FILE *fp;
    struct stats_cpu *st_cpu_i;
    struct stats_cpu sc;
    char line[8192];
    int proc_nb;

    if ((fp = fopen(STAT, "r")) == NULL) {----------------------------------------------------/proc/stat
        fprintf(stderr, _("Cannot open %s: %s
"), STAT, strerror(errno));
        exit(2);
    }

    while (fgets(line, sizeof(line), fp) != NULL) {

        if (!strncmp(line, "cpu ", 4)) {------------------------------------------------------统计总cpu不同类别耗时,详细信息参考/proc/stat。这里的信息和内核中一一对应。
            memset(st_cpu, 0, STATS_CPU_SIZE);
            sscanf(line + 5, "%llu %llu %llu %llu %llu %llu %llu %llu %llu %llu",
                   &st_cpu->cpu_user,
                   &st_cpu->cpu_nice,
                   &st_cpu->cpu_sys,
                   &st_cpu->cpu_idle,
                   &st_cpu->cpu_iowait,
                   &st_cpu->cpu_hardirq,
                   &st_cpu->cpu_softirq,
                   &st_cpu->cpu_steal,
                   &st_cpu->cpu_guest,
                   &st_cpu->cpu_guest_nice);

            *uptime = st_cpu->cpu_user + st_cpu->cpu_nice    +
                st_cpu->cpu_sys    + st_cpu->cpu_idle    +
                st_cpu->cpu_iowait + st_cpu->cpu_hardirq +
                st_cpu->cpu_steal  + st_cpu->cpu_softirq;
        }

        else if (!strncmp(line, "cpu", 3)) {
...
    }

    fclose(fp);
}
3.2 进程创建及切换
pcsw_act读取/proc/stat节点,解析其中的ctxt和processes信息。
同样的/proc/stat中,统计信息是启动以来的累计值,图标中现实的不同时间段的差值。
proc/s表示每秒创建的进程数目,cswch/s表示每秒进程切换次数。
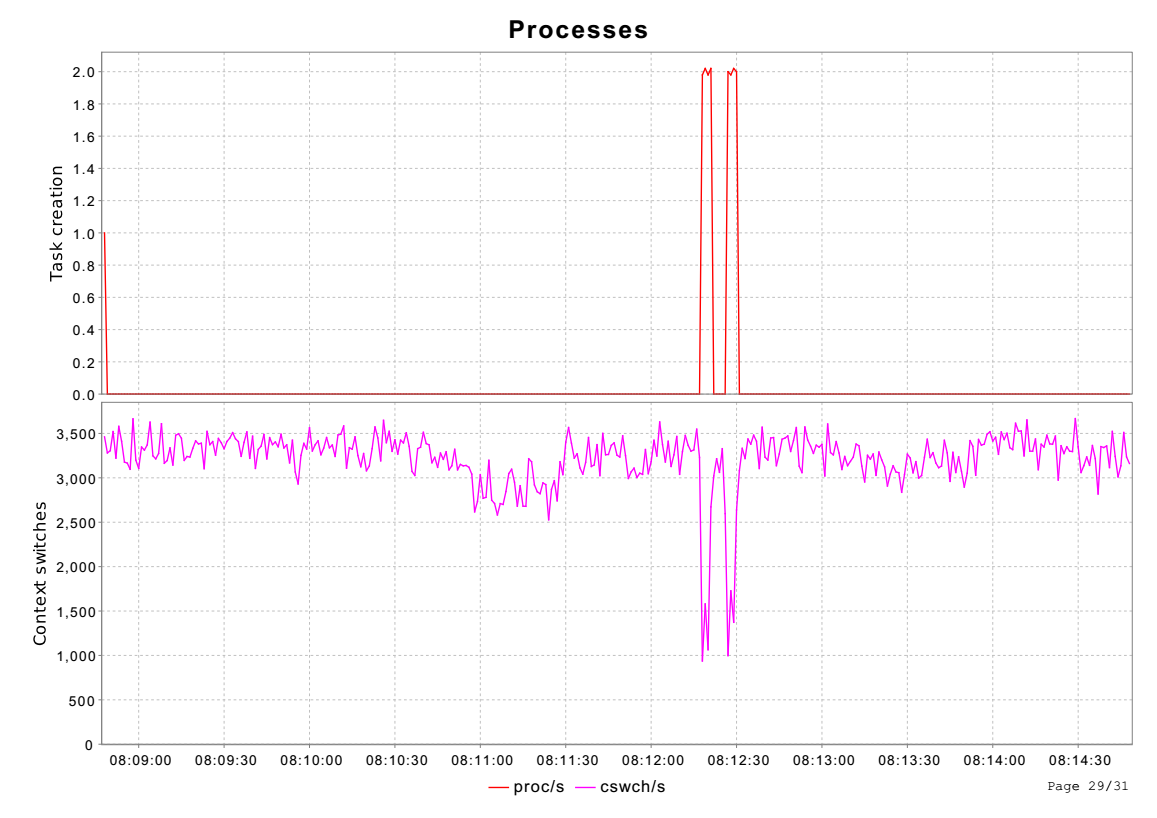
void read_stat_pcsw(struct stats_pcsw *st_pcsw)
{
    FILE *fp;
    char line[8192];

    if ((fp = fopen(STAT, "r")) == NULL)
        return;

    while (fgets(line, sizeof(line), fp) != NULL) {

        if (!strncmp(line, "ctxt ", 5)) {--------------------------------------------ctxt是所有CPU的进程切换次数。
            /* Read number of context switches */
            sscanf(line + 5, "%llu", &st_pcsw->context_switch);
        }

        else if (!strncmp(line, "processes ", 10)) {---------------------------------是整个系统创建进程的次数,total_forks,
            /* Read number of processes created since system boot */
            sscanf(line + 10, "%lu", &st_pcsw->processes);
        }
    }

    fclose(fp);
}
3.3 swap信息
swap_act读取/proc/vmstat节点,解析其中的pswpin和pswpout两个信息。
pswpin/s表示系统每秒从swap分区读入的页面数量,即移除掉swap;pswpout/s表示系统每秒写到swap分区的页面数量,即产生swap。
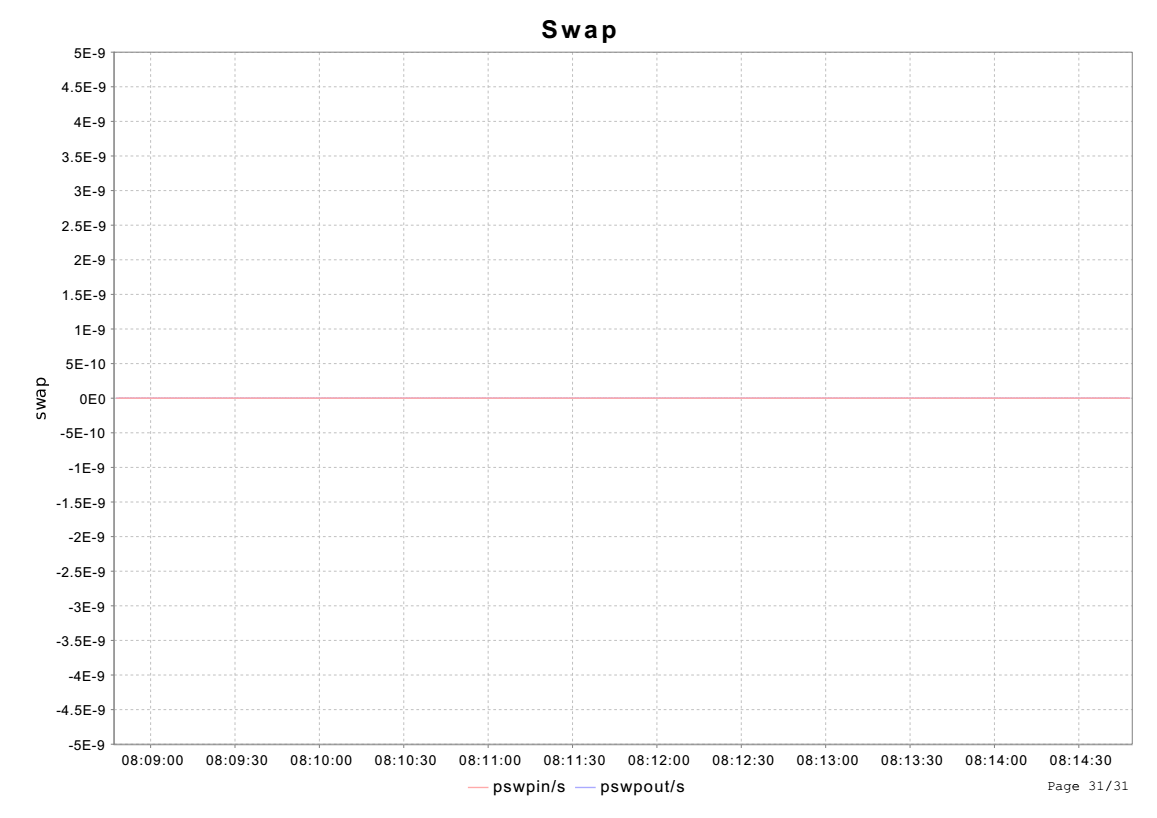
void read_vmstat_swap(struct stats_swap *st_swap)
{
    FILE *fp;
    char line[128];

    if ((fp = fopen(VMSTAT, "r")) == NULL)
        return;

    while (fgets(line, sizeof(line), fp) != NULL) {

        if (!strncmp(line, "pswpin ", 7)) {-------------------------------对应PSWPIN,表示从swap分区读入页面。
            /* Read number of swap pages brought in */
            sscanf(line + 7, "%lu", &st_swap->pswpin);
        }
        else if (!strncmp(line, "pswpout ", 8)) {-------------------------对应PSWPOUT,表示将page写入到swap分区。
            /* Read number of swap pages brought out */
            sscanf(line + 8, "%lu", &st_swap->pswpout);
        }
    }

    fclose(fp);
}
3.4 页面统计信息
paging_act统计/proc/vmstat中页面交换统计信息。
Paging包括四张图标,分别统计/proc/vmstat中的PGPGIN、PGPGOUT、PGFAULT、PGMAJFAULT等等信息。
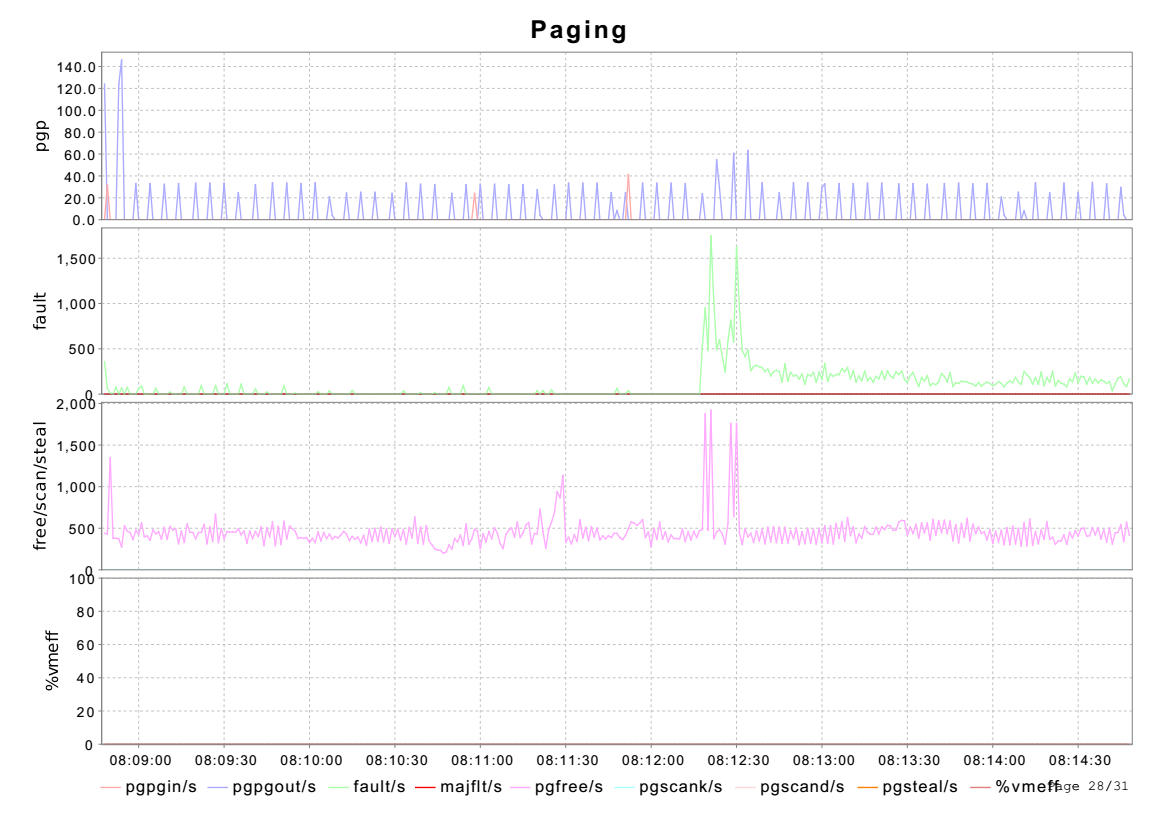
pgpgin/s表示系统每秒从磁盘中paged多少KB;pgpgout/s则表示到磁盘中多少KB。
fault/s表示系统每秒产生的页面异常数目,包括major和minor;majflt/s则表示页面异常是从磁盘中产生的。
pgfree/s表示每秒放入到free list的页面数量;pgscank/s、pgscand/s都表示扫描的页面数量,只不过前者表示kswapd扫描结果,后者表示直接扫描;pgsteal/s都表示从pagecache和swapcache中回收的页面数量。
%vmeff是pgsteal/pgscan表示页面回收的效率。
看fault/s和pgfree/s存在一定关系,前者表示内存申请,后者表示内存释放,存在先后关系。但是单位不一致,前者是次数,后者是页面。
void read_vmstat_paging(struct stats_paging *st_paging)
{
    FILE *fp;
    char line[128];
    unsigned long pgtmp;

    if ((fp = fopen(VMSTAT, "r")) == NULL)
        return;

    st_paging->pgsteal = 0;
    st_paging->pgscan_kswapd = st_paging->pgscan_direct = 0;

    while (fgets(line, sizeof(line), fp) != NULL) {

        if (!strncmp(line, "pgpgin ", 7)) {------------------------------------------------pgpgin和pgpgout分别对应PGPGIN和PGPGOUT,在submit_io()中更新。指内存和块设备志坚page数目,这里的page指的是disk sector。pgpgin表示从块设备读入,pgpgout写入到跨设备。
            /* Read number of pages the system paged in */
            sscanf(line + 7, "%lu", &st_paging->pgpgin);
        }
        else if (!strncmp(line, "pgpgout ", 8)) {
            /* Read number of pages the system paged out */
            sscanf(line + 8, "%lu", &st_paging->pgpgout);
        }
        else if (!strncmp(line, "pgfault ", 8)) {-------------------------------------------在vm_event_item[]中对应PGFAULT,在handle_mm_fault()中更新。统计产生page fault的信息。
            /* Read number of faults (major+minor) made by the system */
            sscanf(line + 8, "%lu", &st_paging->pgfault);
        }
        else if (!strncmp(line, "pgmajfault ", 11)) {---------------------------------------对应PGMAJFAULT,表示从磁盘而不是从内存中获取数据。
            /* Read number of faults (major only) made by the system */
            sscanf(line + 11, "%lu", &st_paging->pgmajfault);
        }
        else if (!strncmp(line, "pgfree ", 7)) {--------------------------------------------对应PGFREE,统计释放的页面次数。
            /* Read number of pages freed by the system */
            sscanf(line + 7, "%lu", &st_paging->pgfree);
        }
        else if (!strncmp(line, "pgsteal_", 8)) {-------------------------------------------统计PGSTEAL_KSWAPD和PGSTEAL_DIRECT信息,表示系统回收的kswapd和直接回收的页面数目。
            /* Read number of pages stolen by the system */
            sscanf(strchr(line, ' '), "%lu", &pgtmp);
            st_paging->pgsteal += pgtmp;
        }
        else if (!strncmp(line, "pgscan_kswapd", 13)) {--------------------------------------统计PGSCAN_KSWAPD信息,表示从系统启动到现在kswapd后台进程扫描的页面数。
            /* Read number of pages scanned by the kswapd daemon */
            sscanf(strchr(line, ' '), "%lu", &pgtmp);
            st_paging->pgscan_kswapd += pgtmp;
        }
        else if (!strncmp(line, "pgscan_direct", 13)) {--------------------------------------统计PGSCAN_DIRECT和PGSCAN_DIRECT_THROTTLE,统计世界回收页面数。
            /* Read number of pages scanned directly */
            sscanf(strchr(line, ' '), "%lu", &pgtmp);
            st_paging->pgscan_direct += pgtmp;
        }
    }

    fclose(fp);
}
3.5 IO统计信息
io_act从/proc/diskstats读取IO统计信息。
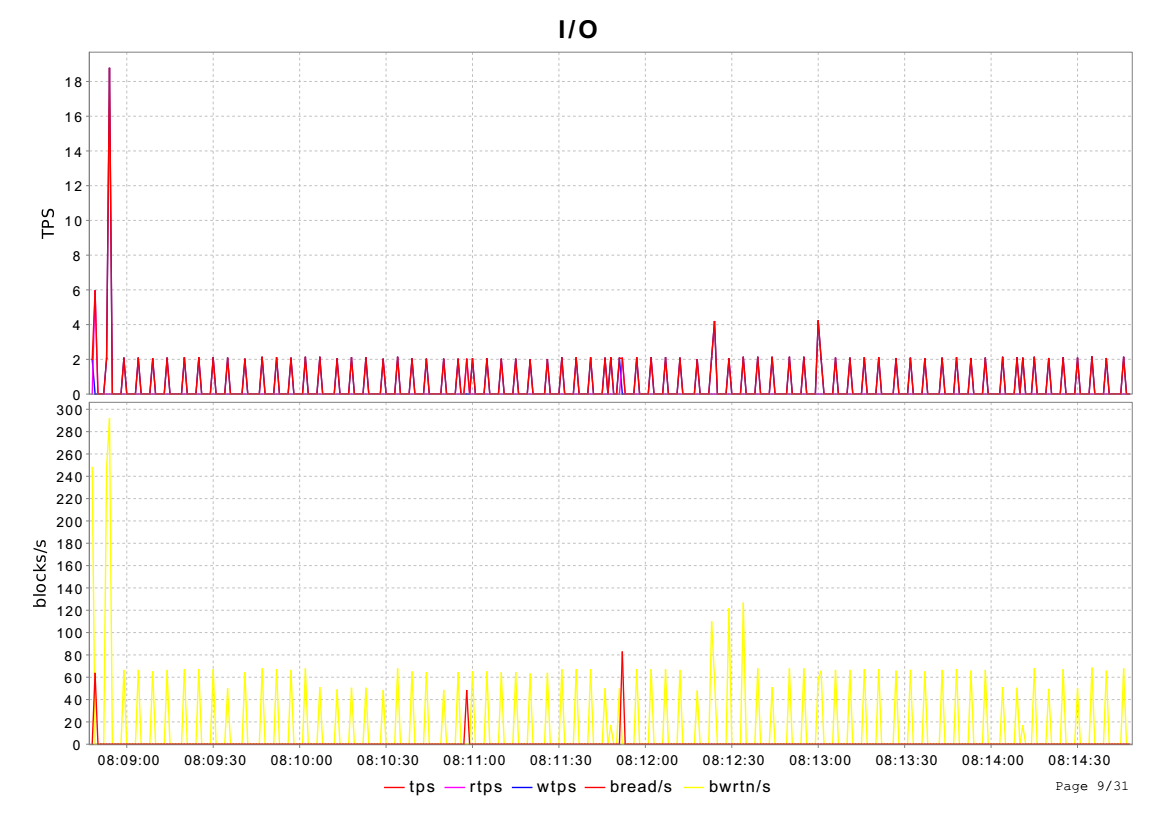
上面的tps、rtps、wtps、bread/s、bwrtn/s分别对应采样结果dk_drive、dk_drive_rio、dk_drive_wio、dk_drive_rblk、dk_drive_wblk。
其中tps为rtps和wtps之和,表示完成读写次数;bread/s和bwrtn/s表示读、写扇区数目。
这5个参数都来源于diskstats_show()函数。
void read_diskstats_io(struct stats_io *st_io)
{
    FILE *fp;
    char line[256];
    char dev_name[MAX_NAME_LEN];
    unsigned int major, minor;
    unsigned long rd_ios, wr_ios, rd_sec, wr_sec;

    if ((fp = fopen(DISKSTATS, "r")) == NULL)
        return;

    while (fgets(line, sizeof(line), fp) != NULL) {

        if (sscanf(line, "%u %u %s %lu %*u %lu %*u %lu %*u %lu",-----------scanf的%u之间的星号,表示跳过此输入。
               &major, &minor, dev_name,
               &rd_ios, &rd_sec, &wr_ios, &wr_sec) == 7) {

            if (is_device(dev_name, IGNORE_VIRTUAL_DEVICES)) {--------------虚拟设备没有/sys/block/<device>/device,此特性用以判断dev_name对应的设备是否是真实的块设备。
                st_io->dk_drive      += (unsigned long long) rd_ios + (unsigned long long) wr_ios;
                st_io->dk_drive_rio  += rd_ios;
                st_io->dk_drive_rblk += rd_sec;
                st_io->dk_drive_wio  += wr_ios;
                st_io->dk_drive_wblk += wr_sec;
            }
        }
    }
    fclose(fp);
}
/proc/diskstats来源于内核的diskstats_show()
static int diskstats_show(struct seq_file *seqf, void *v)
{
    struct gendisk *gp = v;
    struct disk_part_iter piter;
    struct hd_struct *hd;
    char buf[BDEVNAME_SIZE];
    int cpu;

    /*
    if (&disk_to_dev(gp)->kobj.entry == block_class.devices.next)
        seq_puts(seqf,    "major minor name"
                "     rio rmerge rsect ruse wio wmerge "
                "wsect wuse running use aveq"
                "

");
    */

    disk_part_iter_init(&piter, gp, DISK_PITER_INCL_EMPTY_PART0);
    while ((hd = disk_part_iter_next(&piter))) {
        cpu = part_stat_lock();
        part_round_stats(cpu, hd);
        part_stat_unlock();
        seq_printf(seqf, "%4d %7d %s %lu %lu %lu "
               "%u %lu %lu %lu %u %u %u %u
",
               MAJOR(part_devt(hd)), MINOR(part_devt(hd)),
               disk_name(gp, hd->partno, buf),
               part_stat_read(hd, ios[READ]),-------------------------------------------------成功完成读的次数。
               part_stat_read(hd, merges[READ]),----------------------------------------------合并读次数,为了效率可能会合并相邻的读和写。
               part_stat_read(hd, sectors[READ]),---------------------------------------------读扇区的次数。
               jiffies_to_msecs(part_stat_read(hd, ticks[READ])),-----------------------------读花的时间,这里是所有读操作所花费的毫秒数。
               part_stat_read(hd, ios[WRITE]),------------------------------------------------成功完成写的次数。
               part_stat_read(hd, merges[WRITE]),---------------------------------------------合并写次数。
               part_stat_read(hd, sectors[WRITE]),--------------------------------------------写扇区次数。
               jiffies_to_msecs(part_stat_read(hd, ticks[WRITE])),----------------------------写花的时间。
               part_in_flight(hd),
               jiffies_to_msecs(part_stat_read(hd, io_ticks)),
               jiffies_to_msecs(part_stat_read(hd, time_in_queue))
            );
    }
    disk_part_iter_exit(&piter);

    return 0;
}
3.6 内存及swap统计信息
memory_act统计/proc/meminfo的内存和swap信息。
kbmemfree是所有free内存大小,kbavail是扣除保留内存,加上部分pagecache和可回收内存;kbmemused是目前系统内存使用量,不包括内核使用量。
%memused是内存使用占总内存百分比。
kbcommit是当前场景系统需要使用到的内存量,实际上可能并没有申请这么多内存。这是因为分配的内存只有在使用到时,才会产生缺页异常。
这里的kbcommit和页面统计信息相呼应,此处kbcommit突然增加,产生了很多page fault。

从图表中的名称大概就能找到对应的/proc/meminfo中的字符项。
其中%memused和%commit查看stub_print_memory_stats(),%memused为(MemTotal-MemFree)/MemTotal。
%commit为Commited_AS/(MemTotal+SwapTotal)。
在/proc/meminfo中看到的CommitLimit可能是proc/sys/vm/overcommit_kbytes;或者按照当前可以用内存乘以overcommit_ratio这个比例得到。
在实际使用中,还需要结合overcommit_memory类型来看,参考overcommit_memory和overcommit_ratio。
unsigned long vm_commit_limit(void)
{
    unsigned long allowed;

    if (sysctl_overcommit_kbytes)
        allowed = sysctl_overcommit_kbytes >> (PAGE_SHIFT - 10);
    else
        allowed = ((totalram_pages - hugetlb_total_pages())
               * sysctl_overcommit_ratio / 100);
    allowed += total_swap_pages;

    return allowed;
}
read_meminfo()从/proc/meminfo中解析数据。
void read_meminfo(struct stats_memory *st_memory)
{
    FILE *fp;
    char line[128];

    if ((fp = fopen(MEMINFO, "r")) == NULL)
        return;

    while (fgets(line, sizeof(line), fp) != NULL) {

        if (!strncmp(line, "MemTotal:", 9)) {
            /* Read the total amount of memory in kB */
            sscanf(line + 9, "%lu", &st_memory->tlmkb);
        }
        else if (!strncmp(line, "MemFree:", 8)) {
            /* Read the amount of free memory in kB */
            sscanf(line + 8, "%lu", &st_memory->frmkb);
        }
        else if (!strncmp(line, "MemAvailable:", 13)) {
            /* Read the amount of available memory in kB */
            sscanf(line + 13, "%lu", &st_memory->availablekb);
        }
        else if (!strncmp(line, "Buffers:", 8)) {
            /* Read the amount of buffered memory in kB */
            sscanf(line + 8, "%lu", &st_memory->bufkb);
        }
        else if (!strncmp(line, "Cached:", 7)) {
            /* Read the amount of cached memory in kB */
            sscanf(line + 7, "%lu", &st_memory->camkb);
        }
        else if (!strncmp(line, "SwapCached:", 11)) {
            /* Read the amount of cached swap in kB */
            sscanf(line + 11, "%lu", &st_memory->caskb);
        }
        else if (!strncmp(line, "Active:", 7)) {
            /* Read the amount of active memory in kB */
            sscanf(line + 7, "%lu", &st_memory->activekb);
        }
        else if (!strncmp(line, "Inactive:", 9)) {
            /* Read the amount of inactive memory in kB */
            sscanf(line + 9, "%lu", &st_memory->inactkb);
        }
        else if (!strncmp(line, "SwapTotal:", 10)) {
            /* Read the total amount of swap memory in kB */
            sscanf(line + 10, "%lu", &st_memory->tlskb);
        }
        else if (!strncmp(line, "SwapFree:", 9)) {
            /* Read the amount of free swap memory in kB */
            sscanf(line + 9, "%lu", &st_memory->frskb);
        }
        else if (!strncmp(line, "Dirty:", 6)) {
            /* Read the amount of dirty memory in kB */
            sscanf(line + 6, "%lu", &st_memory->dirtykb);
        }
        else if (!strncmp(line, "Committed_AS:", 13)) {
            /* Read the amount of commited memory in kB */
            sscanf(line + 13, "%lu", &st_memory->comkb);
        }
        else if (!strncmp(line, "AnonPages:", 10)) {
            /* Read the amount of pages mapped into userspace page tables in kB */
            sscanf(line + 10, "%lu", &st_memory->anonpgkb);
        }
        else if (!strncmp(line, "Slab:", 5)) {
            /* Read the amount of in-kernel data structures cache in kB */
            sscanf(line + 5, "%lu", &st_memory->slabkb);
        }
        else if (!strncmp(line, "KernelStack:", 12)) {
            /* Read the kernel stack utilization in kB */
            sscanf(line + 12, "%lu", &st_memory->kstackkb);
        }
        else if (!strncmp(line, "PageTables:", 11)) {
            /* Read the amount of memory dedicated to the lowest level of page tables in kB */
            sscanf(line + 11, "%lu", &st_memory->pgtblkb);
        }
        else if (!strncmp(line, "VmallocUsed:", 12)) {
            /* Read the amount of vmalloc area which is used in kB */
            sscanf(line + 12, "%lu", &st_memory->vmusedkb);
        }
    }

    fclose(fp);
}
下图的kbswpfree、kbswpused、kbswpcad通过字面意思即可知其对应的meminfo项为SwapFree、SwapTotal-SwapFree、SwapCached。

3.7 中断统计信息
中断你统计信息同样来自/proc/stat,解析intr字段。第一个是启动以来所有中断触发次数,后面是单个中断触发次数。
生成的表格中包含了对应的图标sum,以及每个中断统计信息。

void read_stat_irq(struct stats_irq *st_irq, int nbr)
{
    FILE *fp;
    struct stats_irq *st_irq_i;
    char line[8192];
    int i, pos;

    if ((fp = fopen(STAT, "r")) == NULL)
        return;

    while (fgets(line, sizeof(line), fp) != NULL) {

        if (!strncmp(line, "intr ", 5)) {-------------------------------------------------/proc/stat的intr字段。
            /* Read total number of interrupts received since system boot */
            sscanf(line + 5, "%llu", &st_irq->irq_nr);
            pos = strcspn(line + 5, " ") + 5;

            for (i = 1; i < nbr; i++) {
                st_irq_i = st_irq + i;
                sscanf(line + pos, " %llu", &st_irq_i->irq_nr);
                pos += strcspn(line + pos + 1, " ") + 1;
            }
        }
    }

    fclose(fp);
}
3.8
ktables_act
#define FDENTRY_STATE    "/proc/sys/fs/dentry-state"
#define FFILE_NR    "/proc/sys/fs/file-nr"
#define FINODE_STATE    "/proc/sys/fs/inode-state"
#define PTY_NR        "/proc/sys/kernel/pty/nr"

void read_kernel_tables(struct stats_ktables *st_ktables)
{
    FILE *fp;
    unsigned int parm;
    int rc = 0;

    /* Open /proc/sys/fs/dentry-state file */
    if ((fp = fopen(FDENTRY_STATE, "r")) != NULL) {
        rc = fscanf(fp, "%*d %u",
                &st_ktables->dentry_stat);
        fclose(fp);
        if (rc == 0) {
            st_ktables->dentry_stat = 0;
        }
    }

    /* Open /proc/sys/fs/file-nr file */
    if ((fp = fopen(FFILE_NR, "r")) != NULL) {
        rc = fscanf(fp, "%u %u",
                &st_ktables->file_used, &parm);
        fclose(fp);
        /*
         * The number of used handles is the number of allocated ones
         * minus the number of free ones.
         */
        if (rc == 2) {
            st_ktables->file_used -= parm;
        }
        else {
            st_ktables->file_used = 0;
        }
    }

    /* Open /proc/sys/fs/inode-state file */
    if ((fp = fopen(FINODE_STATE, "r")) != NULL) {
        rc = fscanf(fp, "%u %u",
                &st_ktables->inode_used, &parm);
        fclose(fp);
        /*
         * The number of inuse inodes is the number of allocated ones
         * minus the number of free ones.
         */
        if (rc == 2) {
            st_ktables->inode_used -= parm;
        }
        else {
            st_ktables->inode_used = 0;
        }
    }

    /* Open /proc/sys/kernel/pty/nr file */
    if ((fp = fopen(PTY_NR, "r")) != NULL) {
        rc = fscanf(fp, "%u",
                &st_ktables->pty_nr);
        fclose(fp);
        if (rc == 0) {
            st_ktables->pty_nr = 0;
        }
    }
}
3.9 load和queue统计信息
queue_act从/proc/loadavg获取load信息,从/proc/stat获取queue统计信息。
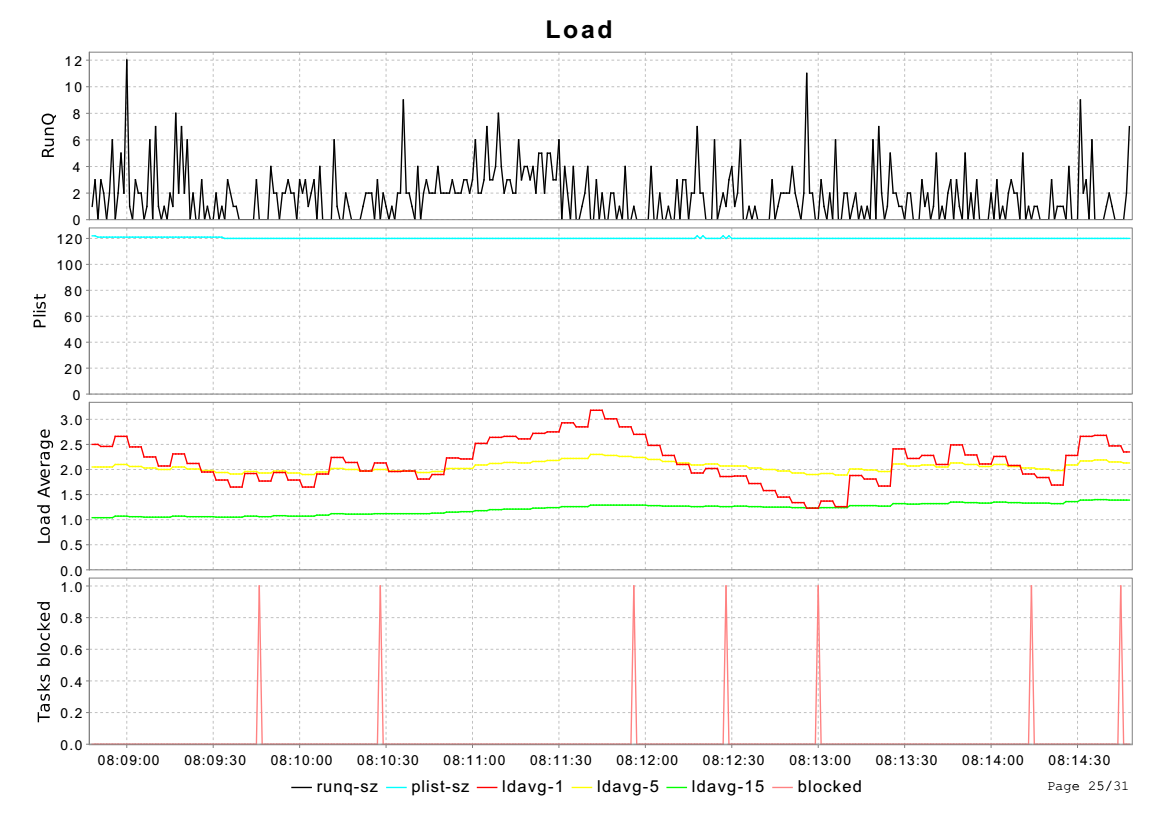
ldavg-1、ldavg-5、ldavg-15分别表示1、5、15分钟内进程对立中平均进程数目,包括正在运行的进程和准备好等待运行的进程数目。
runq-sz表示运行队列大小,plist-sz表示所有进程总数nr_threads。
runq-sz大表示等待运行的进程数目较多。
blocked表示处于iowait状态的进程数目。
void read_loadavg(struct stats_queue *st_queue)
{
    FILE *fp;
    char line[8192];
    int load_tmp[3];
    int rc;

    if ((fp = fopen(LOADAVG, "r")) == NULL)
        return;

    /* Read load averages and queue length */
    rc = fscanf(fp, "%d.%u %d.%u %d.%u %lu/%u %*d
",------------------------------可以看出从/proc/loadavg中获取信息,然后最后一个数据忽略。
            &load_tmp[0], &st_queue->load_avg_1,
            &load_tmp[1], &st_queue->load_avg_5,
            &load_tmp[2], &st_queue->load_avg_15,
            &st_queue->nr_running,
            &st_queue->nr_threads);

    fclose(fp);

    if (rc < 8)
        return;

    st_queue->load_avg_1  += load_tmp[0] * 100;
    st_queue->load_avg_5  += load_tmp[1] * 100;
    st_queue->load_avg_15 += load_tmp[2] * 100;

    if (st_queue->nr_running) {
        /* Do not take current process into account */
        st_queue->nr_running--;
    }

    /* Read nr of tasks blocked from /proc/stat */
    if ((fp = fopen(STAT, "r")) == NULL)
        return;

    while (fgets(line, sizeof(line), fp) != NULL) {

        if (!strncmp(line, "procs_blocked ", 14)) {--------------------------------从/proc/stat中获取procs_blocked项,表示处于iowait状态的进程数目。
            /* Read number of processes blocked */
            sscanf(line + 14, "%lu", &st_queue->procs_blocked);
            break;
        }
    }

    fclose(fp);
}
3.10 块设备统计信息
disk_act和io_act一样是从/proc/diskstats中获取统计信息,
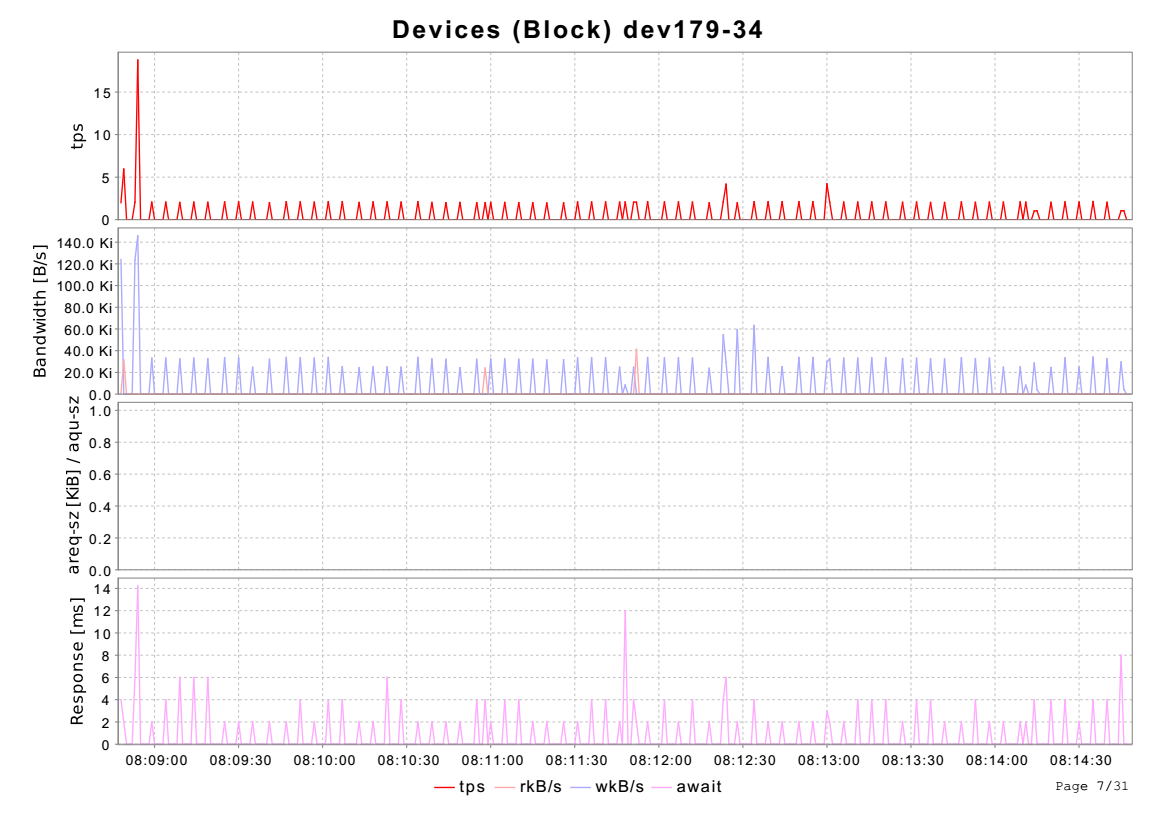
图标中的四项tps表示块设备读写次数频率;rkB/s和wkB/s表示块设备读写速率;await表示一次读或写耗时。
tps值大说明此段时间读写较频繁。
await值大表示当前读写耗时较大,可能存在问题。
__print_funct_t print_disk_stats(struct activity *a, int prev, int curr,
                 unsigned long long itv)
{
...

    for (i = 0; i < a->nr; i++) {
...
        printf("%-11s", timestamp[curr]);

        cprintf_in(IS_STR, " %9s", dev_name, 0);-----------------------------sdc是设备当前统计信息,sdp是设备前一次统计信息,itv是两次时间间隔。
        cprintf_f(NO_UNIT, 1, 9, 2,
              S_VALUE(sdp->nr_ios, sdc->nr_ios,  itv));----------------------对应图标中的tps,nr_ios表示块设备读写次数之和。tps表示块设备读写频率。
        cprintf_f(unit, 2, 9, 2,
              S_VALUE(sdp->rd_sect, sdc->rd_sect, itv) / 2,
              S_VALUE(sdp->wr_sect, sdc->wr_sect, itv) / 2);-----------------对应图标的rkB/s和wkB/s,同样rd_sect和wr_sect可以计算出以KB为单位的读写速率。
        /* See iostat for explanations */
        cprintf_f(unit, 1, 9, 2,
              xds.arqsz / 2);
        cprintf_f(NO_UNIT, 3, 9, 2,
              S_VALUE(sdp->rq_ticks, sdc->rq_ticks, itv) / 1000.0,
              xds.await,------------------------------------------------------对应await,在compute_ext_disk_stats()中计算。表示每次读写平均耗时。
              xds.svctm);
        cprintf_pc(DISPLAY_UNIT(flags), 1, 9, 2,
               xds.util / 10.0);
        printf("
");
    }
}
3.11 CPU频率
pwr_cpufreq_act从/proc/cpuinfo中获取频率信息,CPU Frequency all显示的是所有CPU频率的平均值。
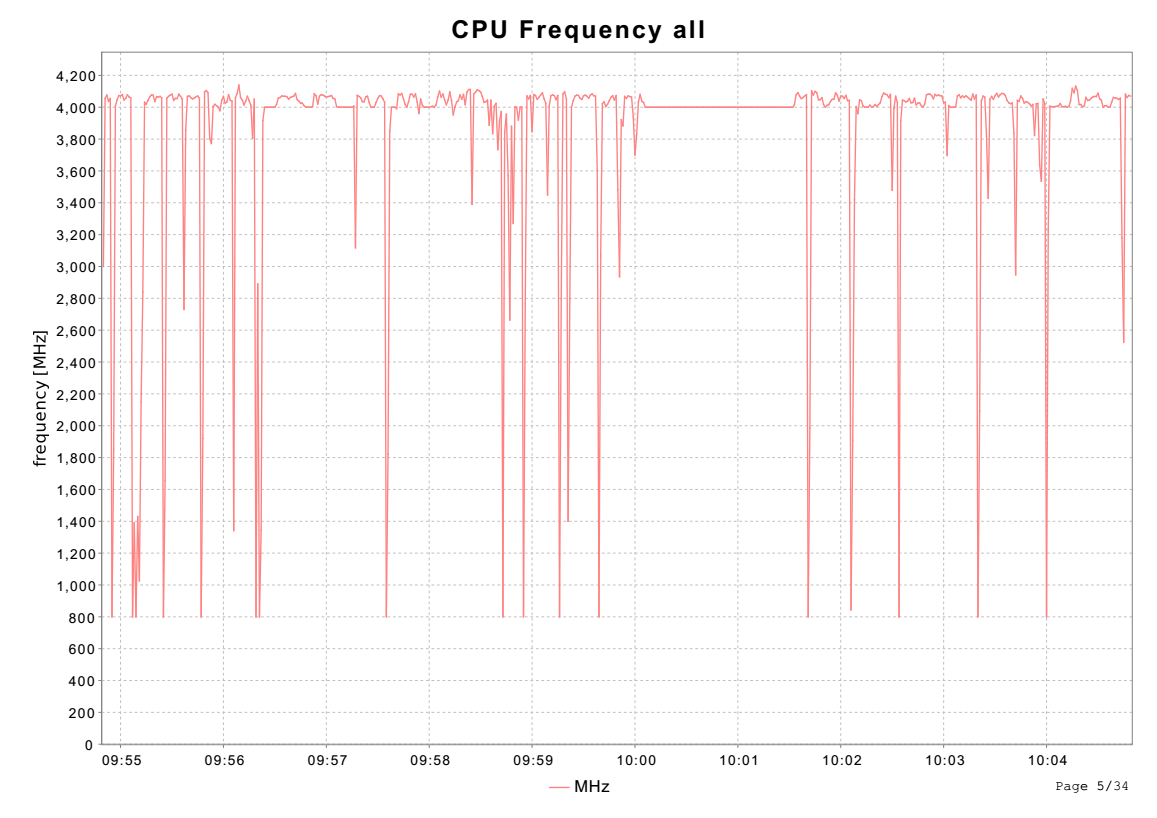
从下面代码分析可知,从关键词processor中获取CPU号,从cpu MHz获取CPU频率。
void read_cpuinfo(struct stats_pwr_cpufreq *st_pwr_cpufreq, int nbr)
{
    FILE *fp;
    struct stats_pwr_cpufreq *st_pwr_cpufreq_i;
    char line[1024];
    int nr = 0;
    unsigned int proc_nb = 0, ifreq, dfreq;

    if ((fp = fopen(CPUINFO, "r")) == NULL)
        return;

    st_pwr_cpufreq->cpufreq = 0;

    while (fgets(line, sizeof(line), fp) != NULL) {

        if (!strncmp(line, "processor	", 10)) {
            sscanf(strchr(line, ':') + 1, "%u", &proc_nb);
        }
        /* Entry in /proc/cpuinfo is different between Intel and Power architectures */
        else if (!strncmp(line, "cpu MHz	", 8) ||
             !strncmp(line, "clock	", 6)) {
            sscanf(strchr(line, ':') + 1, "%u.%u", &ifreq, &dfreq);

            if (proc_nb < (nbr - 1)) {
                st_pwr_cpufreq_i = st_pwr_cpufreq + proc_nb + 1;
                st_pwr_cpufreq_i->cpufreq = ifreq * 100 + dfreq / 10;

                st_pwr_cpufreq->cpufreq += st_pwr_cpufreq_i->cpufreq;
                nr++;
            }
            else if (!proc_nb && (nbr == 1)) {
                st_pwr_cpufreq->cpufreq = ifreq * 100 + dfreq / 10;
            }
        }
    }

    fclose(fp);
...
}
3.12 统计串口线信息
serial_act从/proc/tty/driver/serial获取串口线统计信息。
void read_tty_driver_serial(struct stats_serial *st_serial, int nbr)
{
    FILE *fp;
    struct stats_serial *st_serial_i;
    int sl = 0;
    char line[256];
    char *p;

    if ((fp = fopen(SERIAL, "r")) == NULL)
        return;

    while ((fgets(line, sizeof(line), fp) != NULL) && (sl < nbr)) {

        if ((p = strstr(line, "tx:")) != NULL) {
            st_serial_i = st_serial + sl;
            sscanf(line, "%u", &st_serial_i->line);
            /*
             * A value of 0 means an unused structure.
             * So increment it to make sure it is not zero.
             */
            (st_serial_i->line)++;
            /*
             * Read the number of chars transmitted and received by
             * current serial line.
             */
            sscanf(p + 3, "%u", &st_serial_i->tx);
            if ((p = strstr(line, "rx:")) != NULL) {
                sscanf(p + 3, "%u", &st_serial_i->rx);
            }
            if ((p = strstr(line, "fe:")) != NULL) {
                sscanf(p + 3, "%u", &st_serial_i->frame);
            }
            if ((p = strstr(line, "pe:")) != NULL) {
                sscanf(p + 3, "%u", &st_serial_i->parity);
            }
            if ((p = strstr(line, "brk:")) != NULL) {
                sscanf(p + 4, "%u", &st_serial_i->brk);
            }
            if ((p = strstr(line, "oe:")) != NULL) {
                sscanf(p + 3, "%u", &st_serial_i->overrun);
            }

            sl++;
        }
    }

    fclose(fp);
}
3.13 获取网口统计信息
net_dev_act从/proc/net/dev中获取网口的统计信息,从/sys/class/net/xxx/duplex和/sys/class/net/xxx/speed中获取双工和速度信息。
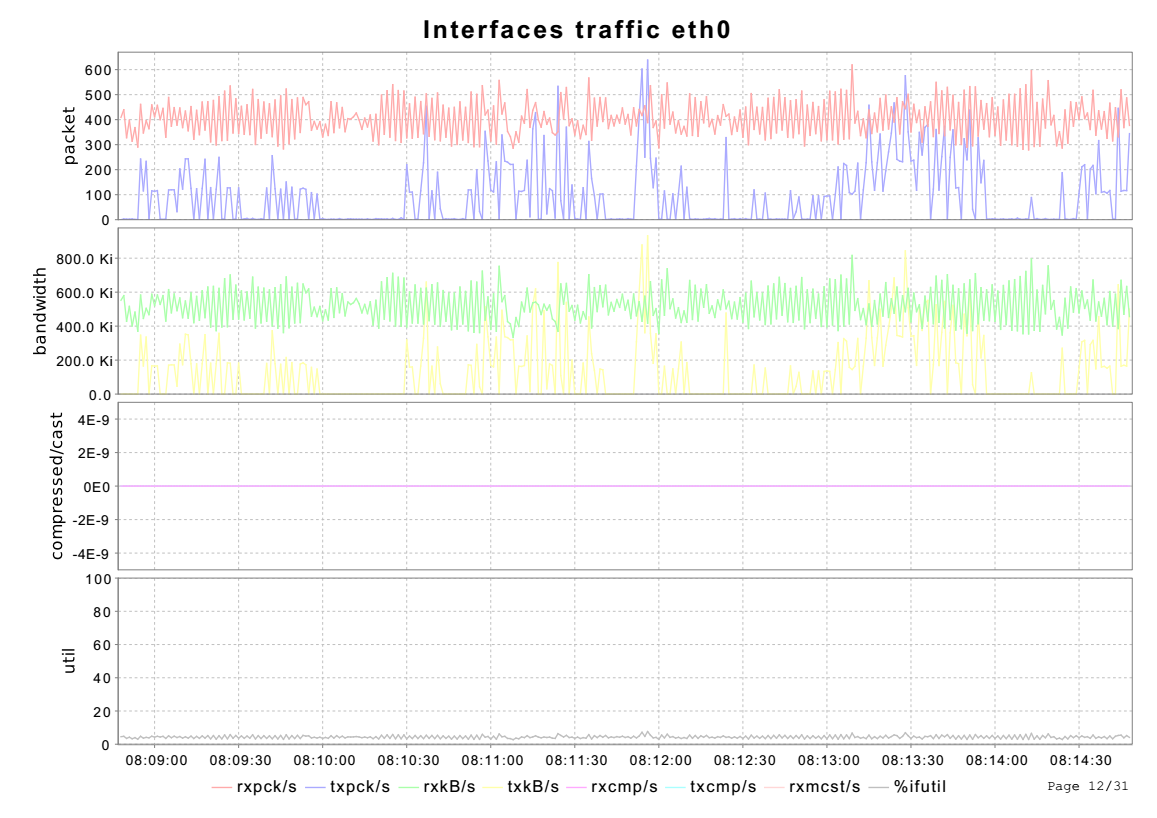
从下面关于/proc/net/dev解释可知,rxpck对应rx_packets,rxpck/s就是每秒接收packet数;txpck/s就是每个发送packet数目。
rxkB/s是每秒接受多少k字节;txkB/s是每秒发送多少k字节。
rxmcst/s表示每秒接收到的multicast packet数目。
%ifutil跟每秒发送接收的KB数有关,还跟全双工,单双工有关,以及设备的速度有关;表示网络设备使用率。
双工信息从/sys/class/net/%s/duplex获取,速度信息从从/sys/class/net/%s/speed获取。
从此图看,网络的使用率并不高,说明网络不频繁。
int read_net_dev(struct stats_net_dev *st_net_dev, int nbr) { FILE *fp; struct stats_net_dev *st_net_dev_i; char line[256]; char iface[MAX_IFACE_LEN]; int dev = 0; int pos; if ((fp = fopen(NET_DEV, "r")) == NULL)----------------------------------------------------------------从/proc/net/dev获取信息。 return 0; while ((fgets(line, sizeof(line), fp) != NULL) && (dev < nbr)) { pos = strcspn(line, ":"); if (pos < strlen(line)) { st_net_dev_i = st_net_dev + dev; strncpy(iface, line, MINIMUM(pos, MAX_IFACE_LEN - 1)); iface[MINIMUM(pos, MAX_IFACE_LEN - 1)] = '�'; sscanf(iface, "%s", st_net_dev_i->interface); /* Skip heading spaces */ sscanf(line + pos + 1, "%llu %llu %*u %*u %*u %*u %llu %llu %llu %llu " "%*u %*u %*u %*u %*u %llu", &st_net_dev_i->rx_bytes, &st_net_dev_i->rx_packets, &st_net_dev_i->rx_compressed, &st_net_dev_i->multicast, &st_net_dev_i->tx_bytes, &st_net_dev_i->tx_packets, &st_net_dev_i->tx_compressed); dev++; } } fclose(fp); return dev; } void read_if_info(struct stats_net_dev *st_net_dev, int nbr) { FILE *fp; struct stats_net_dev *st_net_dev_i; char filename[128], duplex[32]; int dev, n; for (dev = 0; dev < nbr; dev++) { st_net_dev_i = st_net_dev + dev; /* Read speed info */ sprintf(filename, IF_DUPLEX, st_net_dev_i->interface);----------------------------------------------从/sys/class/net/%s/duplex获取信息。 if ((fp = fopen(filename, "r")) == NULL) /* Cannot read NIC duplex */ continue; n = fscanf(fp, "%31s", duplex); fclose(fp); if (n != 1) /* Cannot read NIC duplex */ continue; if (!strcmp(duplex, K_DUPLEX_FULL)) { st_net_dev_i->duplex = C_DUPLEX_FULL; } else if (!strcmp(duplex, K_DUPLEX_HALF)) { st_net_dev_i->duplex = C_DUPLEX_HALF; } else continue; /* Read speed info */ sprintf(filename, IF_SPEED, st_net_dev_i->interface);--------------------------------------------------从/sys/class/net/%s/speed获取信息。 if ((fp = fopen(filename, "r")) == NULL) /* Cannot read NIC speed */ continue; n = fscanf(fp, "%u", &st_net_dev_i->speed); fclose(fp); if (n != 1) { st_net_dev_i->speed = 0; } } }
3.13.1 /proc/net/dev
/proc/net/dev节点在dev_proc_net_init()中创建,对应的fops是dev_seq_fops。
这里重点看一下dev_seq_show():
static int dev_seq_show(struct seq_file *seq, void *v)
{
    if (v == SEQ_START_TOKEN)
        seq_puts(seq, "Inter-|   Receive                            "
                  "                    |  Transmit
"
                  " face |bytes    packets errs drop fifo frame "
                  "compressed multicast|bytes    packets errs "
                  "drop fifo colls carrier compressed
");
    else
        dev_seq_printf_stats(seq, v);
    return 0;
}

static void dev_seq_printf_stats(struct seq_file *seq, struct net_device *dev)
{
    struct rtnl_link_stats64 temp;
    const struct rtnl_link_stats64 *stats = dev_get_stats(dev, &temp);

    seq_printf(seq, "%6s: %7llu %7llu %4llu %4llu %4llu %5llu %10llu %9llu "
           "%8llu %7llu %4llu %4llu %4llu %5llu %7llu %10llu
",
           dev->name, stats->rx_bytes, stats->rx_packets,
           stats->rx_errors,
           stats->rx_dropped + stats->rx_missed_errors,
           stats->rx_fifo_errors,
           stats->rx_length_errors + stats->rx_over_errors +
            stats->rx_crc_errors + stats->rx_frame_errors,
           stats->rx_compressed, stats->multicast,
           stats->tx_bytes, stats->tx_packets,
           stats->tx_errors, stats->tx_dropped,
           stats->tx_fifo_errors, stats->collisions,
           stats->tx_carrier_errors +
            stats->tx_aborted_errors +
            stats->tx_window_errors +
            stats->tx_heartbeat_errors,
           stats->tx_compressed);
}
3.14 网络错误统计信息
net_edev_act从/proc/net/dev网络错误统计信息。

网络错误信息数据来源和网络信息一样,都来自于/proc/net/dev。
关键结构体也是struct rtnl_link_stats64。
void read_net_edev(struct stats_net_edev *st_net_edev, int nbr) { FILE *fp; struct stats_net_edev *st_net_edev_i; static char line[256]; char iface[MAX_IFACE_LEN]; int dev = 0; int pos; if ((fp = fopen(NET_DEV, "r")) == NULL) return; while ((fgets(line, sizeof(line), fp) != NULL) && (dev < nbr)) { pos = strcspn(line, ":"); if (pos < strlen(line)) { st_net_edev_i = st_net_edev + dev; strncpy(iface, line, MINIMUM(pos, MAX_IFACE_LEN - 1)); iface[MINIMUM(pos, MAX_IFACE_LEN - 1)] = '�'; sscanf(iface, "%s", st_net_edev_i->interface); /* Skip heading spaces */ sscanf(line + pos + 1, "%*u %*u %llu %llu %llu %llu %*u %*u %*u %*u " "%llu %llu %llu %llu %llu", &st_net_edev_i->rx_errors,------------------对应rx_erros,表示接受到的bad packet。 &st_net_edev_i->rx_dropped,-----------------对应rx_dropped+rx_missed_errors。 &st_net_edev_i->rx_fifo_errors,-------------对应rx_fifo_errors。 &st_net_edev_i->rx_frame_errors,------------对应rx_length_errors+rx_over_errros。 &st_net_edev_i->tx_errors, &st_net_edev_i->tx_dropped, &st_net_edev_i->tx_fifo_errors, &st_net_edev_i->collisions,-----------------对应collisions &st_net_edev_i->tx_carrier_errors);---------包括tx_carrier_errors+tx_aborted_errors+tx_window_errors+tx_heartbeat_errors。
            dev++;
        }
    }

    fclose(fp);
}
获取网络设备统计信息的核心数据结构式struct rtnl_link_stat64。
struct rtnl_link_stats64 {
    __u64    rx_packets;        /* total packets received    */
    __u64    tx_packets;        /* total packets transmitted    */
    __u64    rx_bytes;        /* total bytes received     */
    __u64    tx_bytes;        /* total bytes transmitted    */
    __u64    rx_errors;        /* bad packets received        */
    __u64    tx_errors;        /* packet transmit problems    */
    __u64    rx_dropped;        /* no space in linux buffers    */
    __u64    tx_dropped;        /* no space available in linux    */
    __u64    multicast;        /* multicast packets received    */
    __u64    collisions;

    /* detailed rx_errors: */
    __u64    rx_length_errors;
    __u64    rx_over_errors;        /* receiver ring buff overflow    */
    __u64    rx_crc_errors;        /* recved pkt with crc error    */
    __u64    rx_frame_errors;    /* recv'd frame alignment error */
    __u64    rx_fifo_errors;        /* recv'r fifo overrun        */
    __u64    rx_missed_errors;    /* receiver missed packet    */

    /* detailed tx_errors */
    __u64    tx_aborted_errors;
    __u64    tx_carrier_errors;
    __u64    tx_fifo_errors;
    __u64    tx_heartbeat_errors;
    __u64    tx_window_errors;

    /* for cslip etc */
    __u64    rx_compressed;
    __u64    tx_compressed;

    __u64    rx_nohandler;        /* dropped, no handler found    */
};
3.15 NFS客户端统计信息
net_nfs_act读取/proc/net/rpc/nfs来分析作为nfs客户端的统计信息。
void read_net_nfs(struct stats_net_nfs *st_net_nfs)
{
    FILE *fp;
    char line[256];
    unsigned int getattcnt = 0, accesscnt = 0, readcnt = 0, writecnt = 0;

    if ((fp = fopen(NET_RPC_NFS, "r")) == NULL)
        return;

    memset(st_net_nfs, 0, STATS_NET_NFS_SIZE);

    while (fgets(line, sizeof(line), fp) != NULL) {

        if (!strncmp(line, "rpc ", 4)) {
            sscanf(line + 4, "%u %u",
                   &st_net_nfs->nfs_rpccnt, &st_net_nfs->nfs_rpcretrans);
        }
        else if (!strncmp(line, "proc3 ", 6)) {
            sscanf(line + 6, "%*u %*u %u %*u %*u %u %*u %u %u",
                   &getattcnt, &accesscnt, &readcnt, &writecnt);

            st_net_nfs->nfs_getattcnt += getattcnt;
            st_net_nfs->nfs_accesscnt += accesscnt;
            st_net_nfs->nfs_readcnt   += readcnt;
            st_net_nfs->nfs_writecnt  += writecnt;
        }
        else if (!strncmp(line, "proc4 ", 6)) {
            sscanf(line + 6, "%*u %*u %u %u "
                   "%*u %*u %*u %*u %*u %*u %*u %*u %*u %*u %*u %*u %*u %*u %u %u",
                   &readcnt, &writecnt, &accesscnt, &getattcnt);

            st_net_nfs->nfs_getattcnt += getattcnt;
            st_net_nfs->nfs_accesscnt += accesscnt;
            st_net_nfs->nfs_readcnt   += readcnt;
            st_net_nfs->nfs_writecnt  += writecnt;
        }
    }

    fclose(fp);
}
3.16 NFS服务端统计信息
net_nfsd_act
#define NET_RPC_NFSD "/proc/net/rpc/nfsd"
void read_net_nfsd(struct stats_net_nfsd *st_net_nfsd)
{
    FILE *fp;
    char line[256];
    unsigned int getattcnt = 0, accesscnt = 0, readcnt = 0, writecnt = 0;

    if ((fp = fopen(NET_RPC_NFSD, "r")) == NULL)
        return;

    memset(st_net_nfsd, 0, STATS_NET_NFSD_SIZE);

    while (fgets(line, sizeof(line), fp) != NULL) {

        if (!strncmp(line, "rc ", 3)) {
            sscanf(line + 3, "%u %u",
                   &st_net_nfsd->nfsd_rchits, &st_net_nfsd->nfsd_rcmisses);
        }
        else if (!strncmp(line, "net ", 4)) {
            sscanf(line + 4, "%u %u %u",
                   &st_net_nfsd->nfsd_netcnt, &st_net_nfsd->nfsd_netudpcnt,
                   &st_net_nfsd->nfsd_nettcpcnt);
        }
        else if (!strncmp(line, "rpc ", 4)) {
            sscanf(line + 4, "%u %u",
                   &st_net_nfsd->nfsd_rpccnt, &st_net_nfsd->nfsd_rpcbad);
        }
        else if (!strncmp(line, "proc3 ", 6)) {
            sscanf(line + 6, "%*u %*u %u %*u %*u %u %*u %u %u",
                   &getattcnt, &accesscnt, &readcnt, &writecnt);

            st_net_nfsd->nfsd_getattcnt += getattcnt;
            st_net_nfsd->nfsd_accesscnt += accesscnt;
            st_net_nfsd->nfsd_readcnt   += readcnt;
            st_net_nfsd->nfsd_writecnt  += writecnt;

        }
        else if (!strncmp(line, "proc4ops ", 9)) {
            sscanf(line + 9, "%*u %*u %*u %*u %u "
                   "%*u %*u %*u %*u %*u %u "
                   "%*u %*u %*u %*u %*u %*u %*u %*u %*u %*u %*u %*u %*u %*u %*u %u "
                   "%*u %*u %*u %*u %*u %*u %*u %*u %*u %*u %*u %*u %u",
                   &accesscnt, &getattcnt, &readcnt, &writecnt);

            st_net_nfsd->nfsd_getattcnt += getattcnt;
            st_net_nfsd->nfsd_accesscnt += accesscnt;
            st_net_nfsd->nfsd_readcnt   += readcnt;
            st_net_nfsd->nfsd_writecnt  += writecnt;
        }
    }

    fclose(fp);
}
3.17 网络socket统计信息
net_sock_act读取/proc/net/sockstat统计TCP和UDP信息。

/proc/net/sockstat的数据来源于sockstat_seq_show(),这里面统计了当前系统socket的使用情况。
static int sockstat_seq_show(struct seq_file *seq, void *v)
{
    struct net *net = seq->private;
    unsigned int frag_mem;
    int orphans, sockets;

    local_bh_disable();
    orphans = percpu_counter_sum_positive(&tcp_orphan_count);
    sockets = proto_sockets_allocated_sum_positive(&tcp_prot);
    local_bh_enable();

    socket_seq_show(seq);---------------------------------------------------------从sockets_ in_use中获取每个CPU在使用中的socket数目。显示内容sockets: used xxx。tw表示TimeWait的socket数目。
    seq_printf(seq, "TCP: inuse %d orphan %d tw %d alloc %d mem %ld
",
           sock_prot_inuse_get(net, &tcp_prot), orphans,
           atomic_read(&tcp_death_row.tw_count), sockets,
           proto_memory_allocated(&tcp_prot));------------------------------------第一个参数表示TCP协议使用的socket数目。
    seq_printf(seq, "UDP: inuse %d mem %ld
",
           sock_prot_inuse_get(net, &udp_prot),
           proto_memory_allocated(&udp_prot));------------------------------------第一个参数表示UDP协议使用的socket数目。
    seq_printf(seq, "UDPLITE: inuse %d
",
           sock_prot_inuse_get(net, &udplite_prot));
    seq_printf(seq, "RAW: inuse %d
",
           sock_prot_inuse_get(net, &raw_prot));----------------------------------RAW类型socket使用数目。
    frag_mem = ip_frag_mem(net);
    seq_printf(seq,  "FRAG: inuse %u memory %u
", !!frag_mem, frag_mem);
    return 0;
}
Sockets图表中的数据totsck、tcpsck、udpsck、rawsck、tcp-tw、ip-frag分别来源于read_net_sock()函数解析。
可见totsck表示系统所有Socket数目,其他子类表示不同类型socket数目。
void read_net_sock(struct stats_net_sock *st_net_sock)
{
    FILE *fp;
    char line[96];
    char *p;

    if ((fp = fopen(NET_SOCKSTAT, "r")) == NULL)
        return;

    while (fgets(line, sizeof(line), fp) != NULL) {

        if (!strncmp(line, "sockets:", 8)) {
            /* Sockets */
            sscanf(line + 14, "%u", &st_net_sock->sock_inuse);
        }
        else if (!strncmp(line, "TCP:", 4)) {
            /* TCP sockets */
            sscanf(line + 11, "%u", &st_net_sock->tcp_inuse);
            if ((p = strstr(line, "tw")) != NULL) {
                sscanf(p + 2, "%u", &st_net_sock->tcp_tw);
            }
        }
        else if (!strncmp(line, "UDP:", 4)) {
            /* UDP sockets */
            sscanf(line + 11, "%u", &st_net_sock->udp_inuse);
        }
        else if (!strncmp(line, "RAW:", 4)) {
            /* RAW sockets */
            sscanf(line + 11, "%u", &st_net_sock->raw_inuse);
        }
        else if (!strncmp(line, "FRAG:", 5)) {
            /* FRAGments */
            sscanf(line + 12, "%u", &st_net_sock->frag_inuse);
        }
    }

    fclose(fp);
}
3.18 huge页面统计信息
huge_act通过读取/proc/meminfo获取huge页面统计信息。
void read_meminfo_huge(struct stats_huge *st_huge)
{
    FILE *fp;
    char line[128];
    unsigned long szhkb = 0;

    if ((fp = fopen(MEMINFO, "r")) == NULL)
        return;

    while (fgets(line, sizeof(line), fp) != NULL) {

        if (!strncmp(line, "HugePages_Total:", 16)) {
            /* Read the total number of huge pages */
            sscanf(line + 16, "%lu", &st_huge->tlhkb);
        }
        else if (!strncmp(line, "HugePages_Free:", 15)) {
            /* Read the number of free huge pages */
            sscanf(line + 15, "%lu", &st_huge->frhkb);
        }
        else if (!strncmp(line, "Hugepagesize:", 13)) {
            /* Read the default size of a huge page in kB */
            sscanf(line + 13, "%lu", &szhkb);
        }
    }

    fclose(fp);

    /* We want huge pages stats in kB and not expressed in a number of pages */
    st_huge->tlhkb *= szhkb;
    st_huge->frhkb *= szhkb;
}
3.19 softnet统计信息
softnet_act通过/proc/net/softnet_stat获取统计信息,
void read_softnet(struct stats_softnet *st_softnet, int nbr)
{
    FILE *fp;
    struct stats_softnet *st_softnet_i;
    char line[1024];
    unsigned int proc_nb = 1;

    /* Open /proc/net/softnet_stat file */
    if ((fp = fopen(NET_SOFTNET, "r")) == NULL)
        return;

    /*
     * Init a structure that will contain the values for CPU "all".
     * CPU "all" doesn't exist in /proc/net/softnet_stat file, so
     * we compute its values as the sum of the values of each CPU.
     */
    memset(st_softnet, 0, sizeof(struct stats_softnet));

    while ((fgets(line, sizeof(line), fp) != NULL) && (proc_nb < nbr)) {

        st_softnet_i = st_softnet + proc_nb++;
        sscanf(line, "%x %x %x %*x %*x %*x %*x %*x %*x %x %x",
               &st_softnet_i->processed,
               &st_softnet_i->dropped,
               &st_softnet_i->time_squeeze,
               &st_softnet_i->received_rps,
               &st_softnet_i->flow_limit);

        st_softnet->processed += st_softnet_i->processed;
        st_softnet->dropped += st_softnet_i->dropped;
        st_softnet->time_squeeze += st_softnet_i->time_squeeze;
        st_softnet->received_rps += st_softnet_i->received_rps;
        st_softnet->flow_limit += st_softnet_i->flow_limit;
    }

    fclose(fp);
}
/proc/net/softnet_stat数据来源于softnet_seq_show()。
static int softnet_seq_show(struct seq_file *seq, void *v)
{
    struct softnet_data *sd = v;
    unsigned int flow_limit_count = 0;

#ifdef CONFIG_NET_FLOW_LIMIT
    struct sd_flow_limit *fl;

    rcu_read_lock();
    fl = rcu_dereference(sd->flow_limit);
    if (fl)
        flow_limit_count = fl->count;
    rcu_read_unlock();
#endif

    seq_printf(seq,
           "%08x %08x %08x %08x %08x %08x %08x %08x %08x %08x %08x
",
           sd->processed, sd->dropped, sd->time_squeeze, 0,
           0, 0, 0, 0, /* was fastroute */
           0,    /* was cpu_collision */
           sd->received_rps, flow_limit_count);
    return 0;
}