需求
写一个GUI勾选不同的复选框展示不同的图形叠加效果
实现
调用matplotlib内置widgets实现对象visibility控制
import numpy as np
import matplotlib.pyplot as plt
from matplotlib.widgets import CheckButtons
t = np.arange(0.0, 2.0, 0.01)
s0 = np.sin(2*np.pi*t)
s1 = np.sin(4*np.pi*t)
s2 = np.sin(6*np.pi*t)
fig, ax = plt.subplots()
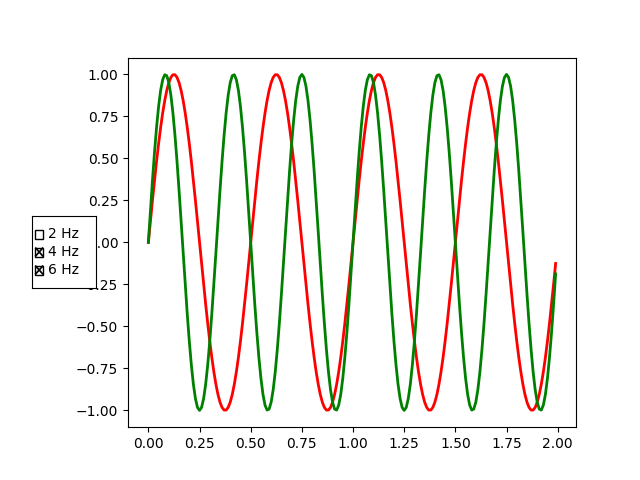
l0, = ax.plot(t, s0, visible=False, lw=2, color='k', label='2 Hz')
l1, = ax.plot(t, s1, lw=2, color='r', label='4 Hz')
l2, = ax.plot(t, s2, lw=2, color='g', label='6 Hz')
plt.subplots_adjust(left=0.2)
lines = [l0, l1, l2]
# Make checkbuttons with all plotted lines with correct visibility
rax = plt.axes([0.05, 0.4, 0.1, 0.15])
labels = [str(line.get_label()) for line in lines]
visibility = [line.get_visible() for line in lines]
check = CheckButtons(rax, labels, visibility)
def func(label):
index = labels.index(label)
lines[index].set_visible(not lines[index].get_visible())
plt.draw()
check.on_clicked(func)
plt.show()
效果图