场景
若依前后端分离版本地搭建开发环境并运行项目的教程:
https://blog.csdn.net/BADAO_LIUMANG_QIZHI/article/details/108465662
在上面搭建架构的基础上,实现使用Echarts获取后台数据并显示双柱体的柱状图。
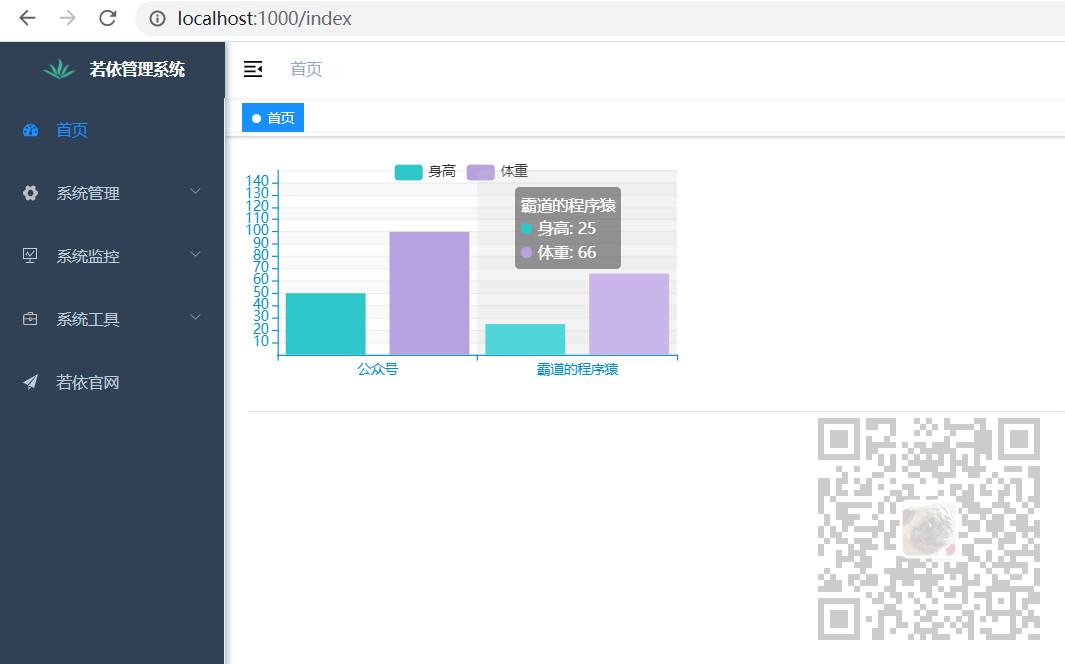
这里有两个对象,每个对象都有身高和体重两个属性。
注:
博客:
https://blog.csdn.net/badao_liumang_qizhi
关注公众号
霸道的程序猿
获取编程相关电子书、教程推送与免费下载。
实现
1、若依框架已经集成了Echarts不用再重复引进。
新建组件BarChart.vue
<template>
  <div :style="{ height: '200px',  '400px' }" />
</template>

<script>
import echarts from "echarts";
import request from '@/utils/request'
require("echarts/theme/macarons"); // echarts theme

export default {
  name: "twoZhuBarChart",
  data() {
    return {
      typeData: [
            { product: "公众号", 体重: 43, 身高: 85 },
            { product: "霸道的程序猿", 体重: 43, 身高: 85 },
          ],
    };
  },
  created() {
    this.getList().then((response) => {
      this.typeData[0].体重=response.data[0].weight;
      this.typeData[0].身高=response.data[0].height;
      this.typeData[1].体重=response.data[1].weight;
      this.typeData[1].身高=response.data[1].height;
      this.initChart(this.typeData);
    });
  },
  methods: {
    getList() {
      return request({
        url: "/echarts/getTwoZhuData",
        method: "get",
      });
    },
    initChart(typeData) {
      this.chart = echarts.init(this.$el, "macarons");
      this.chart.setOption({
        tooltip: {
          trigger: "axis",
          axisPointer: {
            // 坐标轴指示器,坐标轴触发有效
            type: "shadow", // 默认为直线,可选为:'line' | 'shadow'
          },
        },
        grid: {
          top: 10,
          left: "2%",
          right: "2%",
          bottom: "3%",
          containLabel: true,
        },
        legend: {
          //图例
          data: ["身高", "体重"],
        },
        xAxis: [
          {
            type: "category",
            data: ["公众号", "霸道的程序猿"],
            axisPointer: {
              type: "shadow",
            },
          },
        ],
        yAxis: [
          {
            type: "value",
            name: "单位:(kg/cm)",
            min: 0,
            max: 150,
            interval: 10,
            axisLabel: {
              formatter: "{value}",
            },
          },
        ],
        dataset: {
          source: typeData,
        },
        series: [
          {
            name: "身高",
            type: "bar",
            barWidth: "40%",
          },
          {
            name: "体重",
            type: "bar",
            barWidth: "40%",
          },
        ],
      });
    },
  },
};
</script>
要实现给柱状图赋值,需要设置数据源为类似
      typeData: [
            { product: "公众号", 体重: 43, 身高: 85 },
            { product: "霸道的程序猿", 体重: 43, 身高: 85 },
          ],
的对象数组格式。
2、上面页面加载完之后调用后台接口,后台接口实现
package com.ruoyi.web.controller.system;

import com.ruoyi.common.core.controller.BaseController;
import com.ruoyi.common.core.domain.AjaxResult;
import com.ruoyi.system.domain.TwoZhuModel;
import org.springframework.web.bind.annotation.GetMapping;
import org.springframework.web.bind.annotation.RequestMapping;
import org.springframework.web.bind.annotation.RestController;
import java.util.ArrayList;
import java.util.List;

@RestController
@RequestMapping("/echarts")
public class EchartsController extends BaseController
{


    @GetMapping("/getTwoZhuData")
    public AjaxResult getTwoZhuData()  {

        List<TwoZhuModel> resultMap = new ArrayList<TwoZhuModel>();
        TwoZhuModel zhangsan=new TwoZhuModel();
        zhangsan.setName("公众号");
        zhangsan.setHeight(100);
        zhangsan.setWeight(50);

        TwoZhuModel lisi = new TwoZhuModel();
        lisi.setName("霸道的程序猿");
        lisi.setHeight(66);
        lisi.setWeight(25);

        resultMap.add(zhangsan);
        resultMap.add(lisi);

        return AjaxResult.success(resultMap);

    }

}
后台构造两个对象,每个对象有两个属性,对象实体声明
package com.ruoyi.system.domain;

import com.ruoyi.common.annotation.Excel;
import com.ruoyi.common.core.domain.BaseEntity;
import org.apache.commons.lang3.builder.ToStringBuilder;
import org.apache.commons.lang3.builder.ToStringStyle;

public class TwoZhuModel extends BaseEntity
{
    private String name;
    private int weight;
    private int height;

    public String getName() {
        return name;
    }

    public void setName(String name) {
        this.name = name;
    }

    public int getWeight() {
        return weight;
    }

    public void setWeight(int weight) {
        this.weight = weight;
    }

    public int getHeight() {
        return height;
    }

    public void setHeight(int height) {
        this.height = height;
    }
}