注:以下是MATLAB帮助的翻译文件
1 Introduction
This section describes how to graphically design and implement digital filters using the Signal Processing Toolbox FDATool GUI. Filter design is the process of creating the filter coefficients to meet specific frequency specifications. Filter implementation involves choosing and applying a particular filter structure to those coefficients. Only after both design and implementation have been performed can your data be filtered.
本章描述了怎样利用信号处理工具箱(FDATool GUI)图解设计和执行数字滤波器。滤波器的设计是一个为满足频率要求创建滤波器系数的过程。滤波器的执行是利用这些滤波器系数选择和应用一个特殊的滤波器结构。只有在设计和执行完成之后才可以将你的数据进行滤波。
This section includes a brief discussion of applying the completed filter design and filter implementation using MATLAB command line functions, such as filter.
本章包括完全的利用MatlabCommandLine函数(例如filter)对滤波器进行设计和执行的简要论述。
For an interactive FDATool demo, type demos at the MATLAB command line, and select Toolboxes. Expand the tree, scroll down, and select Signal Processing Toolbox. Under Filter Design and Analysis, click Introduction to Filter Design and Analysis Tool.
针对一个交互式FDATool演示,在MatlabCMDLine中键入demos然后选择Toolboxes。展开树,向下滚屏选择信号处理工具箱。在滤波器设计和分析中单击Introduction to Filter Design and Analysis Tool。
2 Designing the Filter
This section is a step-by-step introduction to using the Filter Design and Analysis Tool (FDATool) to design an octave-band filter. An octave is the interval between two frequencies having a ratio of 2:1. An octave-band filter is a bandpass filter with high cutoff frequency approximately twice that of the low cutoff frequency. The class of an octave filter is determined by its allowable passband ripple and its stopband attenuation. Refer to the ANSI S1.11–2004 standard for more information. For more information on designing filters, see FDATool: A Filter Design and Analysis GUI in the Signal Processing Toolbox User's Guide. (Note that you can also access FDATool from SPTool).
这一部分按部就班的介绍应用FDATool设计一个倍频滤波器。倍频是指两个频率中间的比例为2:1。倍频滤波器是一个在通带的高频截止频率大约是低频截止频率两倍的滤波器。倍频滤波器的种类是由允许的通带波纹和阻带衰减决定的。 滤波器设计的更多信息,见FDATool:A Filter Design and Analysis GUI in the Signal Processing Toolbox User’s Guide.(注意:由SPTool也可以访问FDATool)。
2-1 Start FDATool from the MATLAB command line.
| Fdatool |
The FDATool dialog opens with a default filter. Its filter information is summarized in the upper left (Current Filter Information) and its filter specifications are depicted in the upper right. In addition to displaying filter specification, this upper right pane displays filter responses and filter coefficients.
FDATool对话框打开默认滤波器。这个滤波器的信息的概述位于左上角(Current Filter Information) ,设计规则显示在右上角。右上角除了能显示滤波器设计规则,还可以显示滤波器响应和滤波器系数。
The bottom half of FDATool shows the Filter Design panel, where you specify the filter parameters. Other panels, such as Import filter from workspace and Pole/Zero Editor, which you access with the buttons on the lower left, are also displayed in this area. If you have other products installed, you may see additional buttons.
在FDAToo的底部显示了滤波器设计面板,你可以在这里指定滤波器参数。其他的面板,例如可以在左下部访问的按钮:由workspace导入和零极点Pole/Zero编辑器也在这个区域显示。如果你安装其他的产品,你也许可以看到其他的按钮。
2-2 In the Response Type pane, select Bandpass.
在响应类型Response Type 面板中,选择带通Bandpass按钮。
2-3 In the Design Method pane, select IIR, and then select Butterworth from the selection list.
在设计方法Design Method 面板中,选择IIR,然后选择Butterworth形式。
2-4 For the Filter Order, select Specify order, and then enter 6.
在滤波器阶数面板中,选择指定阶数,输入6.
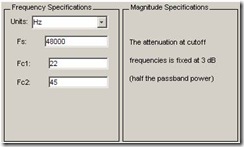
2-5 Set the Frequency Specifications as follows:
设置频率规则如下:
| Parameter | Setting | Description |
| Units | Hz | Units for the parameters 参数单位 |
| Fs | 48000 | Sampling frequency %采样频率 |
| Fc1 | 22 | First cutoff frequency (i.e., the frequency preceding the passband at which the magnitude response is 3 dB below the passband gain) 第一个截止频率(例如通带前面的相对通带衰减3dB时的频率) |
| Fc2 | 45 | Second cutoff frequency (i.e., the frequency following the passband at which the magnitude response is 3 dB below the passband gain) 第二个截止频率(例如通带之后的相对通带衰减3dB时的频率) |
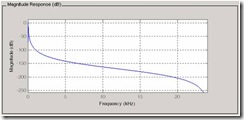
2-6 After specifying the filter design parameters, click the Design Filter button at the bottom of the design panel to compute the filter coefficients. The display updates to show the magnitude response of the designed filter.
指定滤波器参数之后,点击在设计面板下面的设计滤波器Design Filter 按钮计算滤波器系数。设计的滤波器的幅值响应将会显示出来。
Notice that the Design Filter button is disabled after you compute the coefficients for your filter design. This button is enabled again if you make any changes to the filter specifications.
注意设计滤波器Design Filter 按钮在计算滤波器系数之后是不可用的。当你改变任何滤波器规则时这个按钮将会再次开启。
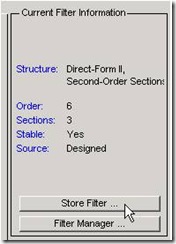
2-7 Click the Store Filter button.
点击保存滤波器按钮
2-8 In the Store Filter dialog, change the filter name to Bandpass Butterworth-1 and click OK to save the filter in the Filter Manager.
在保存滤波器对话框,将滤波器名称该为Butterworth-1然后点击OK保存滤波器在滤波器管理器中。
3 Analyzing the Filter
After designing the filter, you can view the following filter responses in the display region by clicking on the associated toolbar button or by selecting the desired response from the Analysis menu.
滤波器设计完成后,你可以通过点击联合工具条或在Analysis菜单下选择期望的响应观察如下滤波器的响应。
| Note Other analyses are available if you have the Filter Design Toolbox product installed. 注意 如果你已经安装了Filter Design Toolbox就会存在其他的分析。 |
1. Examine the displayed magnitude response of the filter.
检查显示的滤波器的幅频特性
2. Display other responses, as desired. Click the appropriate buttons, shown in the table above or select the desired response from the Analysis menu.
显示其他期望的响应。点击显示于上表中合适的按钮或在Analysis菜单中选择期望的响应。
3. Click the Filter coefficients button to display the filter coefficients.
4 Designing Additional Filters
You have designed one of the bands of an octave filter bank. This section shows you how to design and save the other nine bands. The following table defines the parameters for the remaining bands. Note that all of the bands use these parameters: Bandpass, IIR – Butterworth , order = 6, Fs = 48000 Hz .
你已经设计了一个倍频滤波器。这一部分向你展示如何设计和保存其他9个频段。下面的表格定义了剩下频段的参数。注意所有的频段都用这个参数:BandPass,IIR-Butterworth,order=6,Fs=48000Hz。
| Fc1 | Fc2 | Filter Name |
| 45 | 89 | Bandpass Butterworth-2 |
| 89 | 178 | Bandpass Butterworth-3 |
| 178 | 355 | Bandpass Butterworth-4 |
| 355 | 708 | Bandpass Butterworth-5 |
| 708 | 1413 | Bandpass Butterworth-6 |
| 1413 | 2818 | Bandpass Butterworth-7 |
| 2818 | 5623 | Bandpass Butterworth-8 |
| 5623 | 11220 | Bandpass Butterworth-9 |
| 11220 | 22387 | Bandpass Butterworth-10 |
1. Using the parameters listed in the table above, for each table row, set the appropriate the Fc1 and Fc2 values.
用在上表中的参数的每一行设置合适的Fc1和Fc2值。
2. Design the filter by clicking the Design Filter button.
点击Design Filter按钮设计滤波器。
3. Click Store Filter to save the filter.
点击Store Filter 保存滤波器
4. Change the name to the appropriate filter name shown in the table above.
给滤波器命名为上表中合适的名字
5. Repeat these steps until all 10 filters are designed and stored.
重复这些步骤直到10个滤波器全部设计完成和存储
5 Viewing and Annotating the Filter
5-1 Viewing the Filter in FVTool
This section teaches you how to use the Filter Visualization Tool (FVTool) to view the octave-band filter. It also describes how to annotate your filter.
这一部分教你如何利用滤波器可视化工具(FVTool)去观察倍频滤波器。其中也描述了怎样注释你的滤波器。
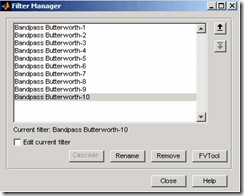
1. Click the Filter Manager button to display the Filter Manager, which lists your saved filters.
点击Filter Manager按钮去显示滤波器管理器,管理器中列出了你保存的滤波器。
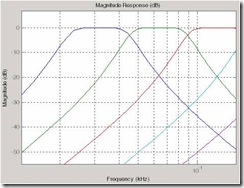
2. Press Ctrl+click on each filter name to select all the filters, and then click FVTool. FVTool opens with the filter responses overlaid for easy comparison. (If you want to view a single filter in FVTool, click the Full View Analysis button when that filter is shown in the FDATool display panel or select View > Filter Visualization Tool).
点击Ctrl+Click 每个滤波器的名字选择所有的滤波器,然后点击FVTool。FVTool为了方便比较以覆盖模式打开滤波器响应。(如果你想用FVTool查看一个滤波器,当滤波器已经显示在FDATool面板时点击Full View Analysis 按钮或选择View->Filter Visualization Tool).
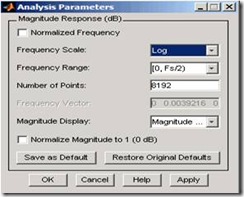
3. Change the x-axis scale to logarithmic by selecting Analysis > Analysis Parameters to display the Analysis Parameters dialog.
通过选择Analysis>Analysis Parameters来显示分析参数对话框去改变x轴刻度为对数坐标。
4. Change the Frequency Scale to Log.
改变频率刻度为log。
5. Click OK.
点击OK
6. Click the Legend button ![]() to turn on the legend, which you can drag to the desired location.
to turn on the legend, which you can drag to the desired location.
点击图例按钮开启图例功能,你可以拖放到想要的位置。
7. Click the Legend button again to turn off the legend.
Use the Zoom button ![]() and drag a rectangle around the first few passbands to zoom in.
and drag a rectangle around the first few passbands to zoom in.
再次点击Legend按钮可以关闭图例。
利用Zoom按钮拖放一个方框在前几个通带去放大图像。
8. Click the Restore Default View button ![]() to return to the full view.
to return to the full view.
点击恢复默认视图按钮返回全景视图。
9. Display other responses, as desired. (The FVTool Analysis toolbar buttons and Analysis menu are the same as in FDATool. See Analyzing the Filter for descriptions of the buttons.
按照需要显示其他响应。(FVTool分析工具按钮和Analysis菜单在FDATool中是一样的。按钮的描述见Analysis the Filter)
5-2 Using FVTool for Annotation
FVTool is also useful for doing further analysis, adding annotations, and printing. Available annotations include adding rectangles, text boxes, arrows and lines, and adding data tips.
FVTool对深入分析是有用的,添加注释然后打印。可用的注释包括添加矩形,文本框,箭头和直线,添加数据标签。
For a demo about FVTool, type demos at the MATLAB command line, and select Toolboxes. Expand the tree, scroll down, and select Signal Processing Toolbox. Under Filter Design and Analysis, click Filter Analysis using FVTool and its API.
在MATLAB的CMD中键入demos选择Tooboxes,展开树,滚动到Signal Processing Toolbox并选中来打开对FVTool的演示。在Filter Design and Analysis下点击Filter Analysis using FVTool and its API。
1. Use the toolbar buttons to annotate your response plot. Add a line by clicking one of the line buttons, and then use your mouse to draw the line on your plot.
利用工具栏按钮去注释你的响应图形。通过点击直线按钮中的一个去添加一条直线,然后利用你的鼠标在你的图像中画出直线。
2. Add a data tip by clicking on a plot at the desired point. The data tip shows the frequency and magnitude at that point.
通过在图像上点击预想的点来添加一个数据标签。数据标签显示了改点的频率和幅值。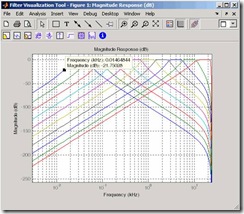
3. Close FVTool by selecting File > Close.
通过选择File>Close关闭FVTool。
6 Exporting Filters from FDATool
FDATool provides a simple way to create filter objects (dfilts) from your filter designs. This is particularly useful for saving your filter design to the MATLAB workspace for use with command line functions. You can also save your filters to M-files using File > Generate M-file to run in scripts or batch files.
FDATool提供了一种由你的滤波器设计创建滤波器对象(dfilts)的简单方法。这在你保存你的滤波器设计到MATLAB workspace并用于命令行函数时是非常有用的。你可以利用using>Generate M-file保存你的滤波器为M文件然后在脚本或批处理中运行。
1. In FDATool, click Filter Manager and highlight only the Bandpass Butterworth-1 filter.
在FDATool中,点击Filter Manager 然后高亮Bandpass Butterworth-1滤波器。
选择File>Export.
3. Set Export to to Workspace. Set Export as to Objects. In Discrete Filter type Hd1. Click Export to export the first filter in your filter bank to an Hd1 dfilt object in the workspace.
选择Export to 工作空间,设置Export as 为对象。在Discrete Filter 中键入Hdl,点击Export来将第一个滤波器导出做为一个Hdl dfilt 对象到工作空间。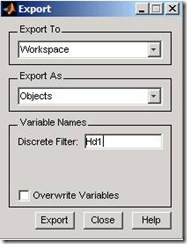
4.Repeat steps 1 through 3 for each of the remaining nine filters. Highlight each filter individually to make it the active filter and change the Discrete Filter name to match the filter number. When you finish you will have 10 dfilt objects in the workspace.
为剩余9个滤波器重复步骤1到3。高亮每个滤波器为当前滤波器并改变离散滤波器的名字匹配滤波器序号。完成后你将由10个dfilt对象在工作空间中。
5. Close FDATool by selecting File > Close.
通过选择File>Close关闭FDATool。
6. On the MATLAB command line, verify that your objects were exported by using the whos command.
在Matlab CMD Line中通过whos命令核实你所导出的对象。
whos Name Size Bytes Class Attributes Hd1 1x1 dfilt.df2sos Hd10 1x1 dfilt.df2sos Hd2 1x1 dfilt.df2sos Hd3 1x1 dfilt.df2sos Hd4 1x1 dfilt.df2sos Hd5 1x1 dfilt.df2sos Hd6 1x1 dfilt.df2sos Hd7 1x1 dfilt.df2sos Hd8 1x1 dfilt.df2sos Hd9 1x1 dfilt.df2sos |
7 Filtering with dfilt
1. Type the following on the MATLAB command line to concatenate your filter bank filter objects into a single dfilt object.
在CMD中键入如下命令使你的滤波器组对象成为单独的滤波器对象。
Hd = [Hd1 Hd2 Hd3 Hd4 Hd5 Hd6 Hd7 Hd8 Hd9 Hd10]; |
2. To view the first filter, type Hd(1).
查看第一个滤波器,键入Hd(1)
Hd(1) ans = FilterStructure: 'Direct-Form II, Second-Order Sections' sosMatrix: [3x6 double] ScaleValues: [3.40097054256801e-009;1;1;1] PersistentMemory: false |
3. A number of methods can be used to view and manipulate the Hd1 dfilt object. Try the info command:
由许多的方法能够用于查看和处理Hdl dfilt 对象。可以试着info命令。
info(Hd1) % Displays filter information Discrete-Time IIR Filter (real) ------------------------------- Filter Structure : Direct-Form II, Second-Order Sections Number of Sections : 3 Stable : Yes Linear Phase : No |
4. You can open FVTool from the MATLAB command line and specify display parameters as follows.
你可以由MATLAB CMD打开FVTool然后像如下指定显示的参数.
F = fvtool(Hd,'Analysis','magnitude') % Open FVTool with % magnitude display set(F,'FrequencyScale','Log') % Change to log scale |
This produces the same display as step 5 of Viewing the Filter in FVTool above.
5. Now using the MATLAB command line, create some discrete white Gaussian noise data, which you can then filter using the filter bank.
现在利用Matlab CMD line 创建一些离散的高斯白噪声数据,这样你可以用滤波器组进行滤波。
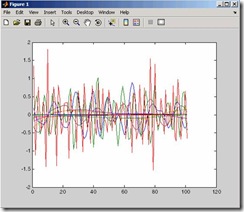
rand; % Initialize random number generator Nx = 100000; % Number of noise data points xw = randn(Nx,1); % Create white noise for i=1:10, yw(:,i)=filter(Hd(i),xw); % Filter the white noise through end % the entire filter bank. % (:,i) means all rows of column i |
6. Plot the filtered data.
plot(yw) |
The next section discusses spectral analysis, where you analyze this data.
下一节将讨论频谱分析来分析这些数据。
8 Designing Filters using Command Line Functions
Beginning with R2009a, users can specify and design filters at the command line using fdesign and design. The use of fdesign and design provides a powerful and efficient way to specify and implement digital filters. With fdesign and design, digital filter design is a two-step process. In the first step, the user specifies the desired characteristics of the filter and saves those specifications in a Filter Specification Object. In the second step, the user implements the filter as a dfilt object, which can then be used to filter data. As an example of this two-step process, we will design a lowpass filter for data sampled at 20 kHz. The desired passband frequency is 1 kHz with a stopband frequency of 1.2 kHz. We will limit the passband ripple to 1 dB and require 60 dB of attenuation between the passband and stopband frequencies.
由2009a开始,用户可以在CMD中利用fdesign和design函数指定和设计滤波器。fdesign 和design的利用提供了一种强大和高效的方法去指定和运行数字滤波器。利用fdesign和design设计数字滤波器是一个两步的过程。第一步,用户指定滤波器的期望特性,保存这些指标在一个滤波器指标对象中。第二步,用户将滤波器作为dfilt对象进行处理,这可以别用于滤波器数据。例如:我们将要设计一个低通滤波器,数据采样频率为20kHz。期望的通带频率为1kHz阻带频率为1.2kHz。我们将限制通带波纹为1dB,阻带衰减为60dB。
1. To specify the filter use fdesign.lowpasswith the parameters given above. You can copy and paste the following code at the MATLAB command prompt.
利用fdesign.lowpass指定以上参数,你可以拷贝然后粘贴如下代码在MATLAB CMD中。
d=fdesign.lowpass('Fp,Fst,Ap,Ast',1000,1200,1,60,20000);
|
2. To design the filter use design with the appropriate design methods. In this example, we create FIR equiripple and IIR Butterworth designs and compare the filters' magnitude responses.
利用design和合适的设计方法设计滤波器。在这个例子中,我们创建FIR线性相位滤波器和IIR巴特沃兹滤波器设计然后比较滤波器的幅值响应。
Hd1=design(d,'equiripple'); %FIR equiripple design Hd2=design(d,'butter'); %Butterworth design Hd=[Hd1 Hd2];%filter object with both designs %compare filters fvtool(Hd,'legend','on'); axis([0 2 -70 10]) |
To determine which filter design methods are available for a given Filter Specification Object, use designmethods. For the lowpass filter example above, you have a choice of two FIR and four IIR digital filter designs.:
利用designmethods去决定对于给定的滤波器设计对象存在什么滤波器设计方法。对于上面的例子提及的低通滤波器,你可以选择两种FIR和四种IIR数字滤波器进行设计。
designmethods(d) Design Methods for class fdesign.lowpass (Fp,Fst,Ap,Ast): butter cheby1 cheby2 ellip equiripple kaiserwin |


