安装jdk
选择oracle官网下载源码包
http://www.oracle.com/technetwork/java/javase/downloads/jdk8-downloads-2133151.html
# 上传解压jdk压缩包
mkdir /usr/local/java

rz 上传压缩包

tar zxf 压缩包

[root@linux-node1 elasticsearch]# ll /usr/local/java/

total 4

drwxr-xr-x. 8 10 143 4096 Dec 19 16:24 jdk1.8.0_161
#配置java的环境变量
[root@linux-node1 elasticsearch]# tail -4 /etc/profile

JAVA_HOME=/usr/local/java/jdk1.8.0_161

JRE_HOME=$JAVA_HOME/jre

PATH=$PATH:$JAVA_HOME/bin:$JRE_HOME/bin

CLASSPATH=:$JAVA_HOME/lib/dt.jar:$JAVA_HOME/lib/tools.jar:$JRE_HOME/lib/dt.jar

[root@linux-node1 elasticsearch]# . /etc/profile
#检查环境变量配置
[root@linux-node1 elasticsearch]# java -version

java version "1.8.0_161"

Java(TM) SE Runtime Environment (build 1.8.0_161-b12)

Java HotSpot(TM) 64-Bit Server VM (build 25.161-b12, mixed mode)


[root@linux-node1 elasticsearch]# javac

Usage: javac <options> <source files>

where possible options include:

  -g                         Generate all debugging info

  -g:none                    Generate no debugging info

  -g:{lines,vars,source}     Generate only some debugging info

  -nowarn                    Generate no warnings

  -verbose                   Output messages about what the compiler is doing

  -deprecation               Output source locations where deprecated APIs are used

  -classpath <path>          Specify where to find user class files and annotation processors

  -cp <path>                 Specify where to find user class files and annotation processors
如果出现一堆帮助表示环境变量配置成功。
安装elksticksearch
按照官网选择最新版本6.1
选择rpm包方式安装
参考网站 : https://www.elastic.co/guide/en/elasticsearch/reference/6.1/rpm.html
#下载公钥到本地主机
rpm --import https://artifacts.elastic.co/GPG-KEY-elasticsearch
#配置yum仓库
vim /etc/yum.repos.d/elasticsearch.repo

[elasticsearch-6.x]
name=Elasticsearch repository for 6.x packages
baseurl=https://artifacts.elastic.co/packages/6.x/yum
gpgcheck=1
gpgkey=https://artifacts.elastic.co/GPG-KEY-elasticsearch
enabled=1
autorefresh=1
type=rpm-md
# yum 安装
sudo yum install elasticsearch
# 启停程序命令
service elasticsearch start
service elasticsearch stop
# 设置开机自启动
systemctl enable elasticsearch.service
#配置文件修改项
[root@linux-node1 elasticsearch]# grep '^[a-z]' elasticsearch.yml
cluster.name: oldboy        #集群名称
node.name: linux-node1            #主机名
path.data: /data/es-data    #数据存储路径
path.logs: /var/log/elasticsearch/ #日志路径
network.host: 0.0.0.0         #任何主机都可以访问
http.port: 9200                      #默认http连接端口9200
#在结尾加上jdk环境路径
[root@linux-node1 elasticsearch]# tail -1 /etc/sysconfig/elasticsearch
JAVA_HOME=/usr/local/java/jdk1.8.0_161
#检查默认端口9200是否存在
[root@linux-node1 elasticsearch]# netstat -lntup|grep 9200
tcp6       0      0 :::9200                 :::*                    LISTEN      8300/java
# 测试连接
[root@linux-node1 elasticsearch]# curl 10.0.0.5:9200
{
  "name" : "0Rl_dTb",
  "cluster_name" : "elasticsearch",
  "cluster_uuid" : "9zK23FE9Thq-x7eZz0GQvg",
  "version" : {
    "number" : "6.1.3",
    "build_hash" : "af51318",
    "build_date" : "2018-01-26T18:22:55.523Z",
    "build_snapshot" : false,
    "lucene_version" : "7.1.0",
    "minimum_wire_compatibility_version" : "5.6.0",
    "minimum_index_compatibility_version" : "5.0.0"
  },
  "tagline" : "You Know, for Search"
}
安装header插件
cd  /opt

wget https://github.com/mobz/elasticsearch-head/archive/master.zip
wget https://npm.taobao.org/mirrors/node/latest-v4.x/node-v4.4.7-linux-x64.tar.gz tar -zxvf node-v4.4.7-linux-x64.tar.gz
分别解压
#配置nodejs环境变量
[root@linux-node1 elasticsearch-head-master]# tail -3 /etc/profile
NODE_HOME=/opt/node-v4.4.7-linux-x64
PATH=$PATH:$NODE_HOME/bin
NODE_PATH=$NODE_HOME/lib/node_modules
[root@linux-node1 elasticsearch]# . /etc/profile
#安装cnpm提升下载速度
[root@node1 ~]# npm install -g cnpm --registry=https://registry.npm.taobao.org
# 下载依赖
cnpm install --registry=https://registry.npm.taobao.org
#安装grunt
npm install -g grunt --registry=https://registry.npm.taobao.org
npm install -g grunt-cli --registry=https://registry.npm.taobao.org --no-proxy
#检查grunt安装
[root@linux-node1 ~]# grunt -version
grunt-cli v1.2.0
如果ElasticSearch已经启动,需要先停止
[es@node1 ~]$ jps
3261 Elasticsearch
3375 Jps
[es@node1 ~]$ kill 3261
配置 ElasticSearch,使得HTTP对外提供服务
[es@node1 elasticsearch-6.1.1]$ vi config/elasticsearch.yml
# 增加新的参数,这样head插件可以访问es。设置参数的时候:后面要有空格
http.cors.enabled: true
http.cors.allow-origin: "*"
修改Head插件配置文件
[es@node1 elasticsearch-head-master]$ vi Gruntfile.js
找到connect:server,添加hostname一项,如下
connect: {
                        server: {
                                options: {
                                        hostname: 'linux-node1',
                                        port: 9100,
                                        base: '.',
                                        keepalive: true
                                }
                        }
                }
# 重新开启elasticsearch
[root@linux-node1 elasticsearch-head-master]# service elasticsearch start
Starting elasticsearch (via systemctl):                    [  OK  ]
启动head
通过命令grunt server启动head
[es@node1 elasticsearch-head-master]$ grunt server
Running "connect:server" (connect) task
Waiting forever...
Started connect web server on http://linux-node1:9100
Linux-node2 同样的配置
[root@linux-node1 elasticsearch-head-master]# tail -4 /etc/elasticsearch/elasticsearch.yml
discovery.zen.ping.unicast.hosts: ["linux-node1", "linux-node2"]     # 集群节点发现列表,也可采用ip的形式
discovery.zen.minimum_master_nodes: 2   #集群可做master的最小节点数,生产环境建议节点数至少3个且为基数
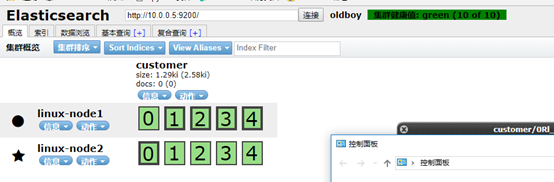
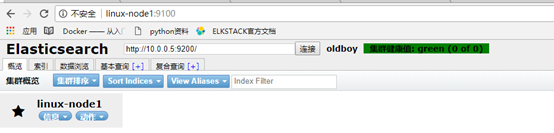
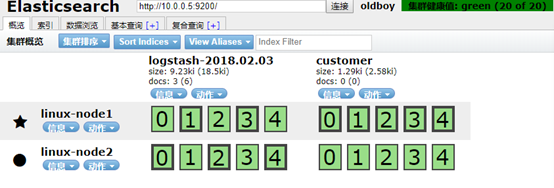
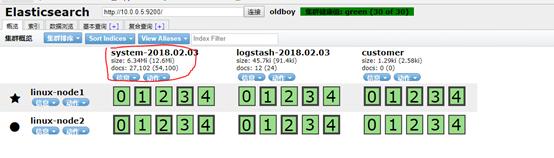
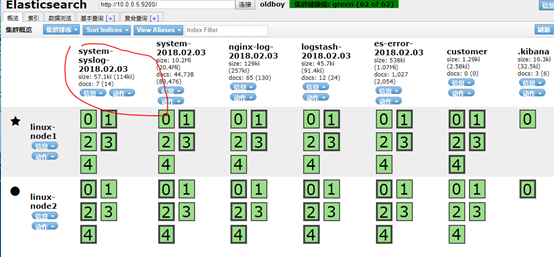
健康值绿色表示正常
Logstash 安装
#下载公钥到本地server

rpm --import https://artifacts.elastic.co/GPG-KEY-elasticsearch

#配置yum仓库

vi /etc/yum.repos.d/logstash.repo

[logstash-6.x]

name=Elastic repository for 6.x packages

baseurl=https://artifacts.elastic.co/packages/6.x/yum

gpgcheck=1

gpgkey=https://artifacts.elastic.co/GPG-KEY-elasticsearch

enabled=1

autorefresh=1

type=rpm-md

#安装

yum install logstash
# 解坑
[root@linux-node1 ~]# rpm --import https://artifacts.elastic.co/GPG-KEY-elasticsearch

curl: (6) Could not resolve host: artifacts.elastic.co; Unknown error

[root@linux-node1 ~]# curl https://artifacts.elastic.co/packages/6.x/yum/repodata/repomd.xml

curl: (6) Could not resolve host: artifacts.elastic.co; Unknown error

[root@linux-node1 ~]# yum makecache

Loaded plugins: fastestmirror, langpacks

Repository base is listed more than once in the configuration

Repository updates is listed more than once in the configuration

Repository extras is listed more than once in the configuration

Repository centosplus is listed more than once in the configuration

base                                                                           | 3.6 kB  00:00:00

https://artifacts.elastic.co/packages/6.x/yum/repodata/repomd.xml: [Errno 14] curl#6 - "Could not resolve host: artifacts.elastic.co; Temporary failure in name resolution"

Trying other mirror.


 One of the configured repositories failed (Elasticsearch repository for 6.x packages),

 and yum doesn't have enough cached data to continue. At this point the only

 safe thing yum can do is fail. There are a few ways to work "fix" this:


     1. Contact the upstream for the repository and get them to fix the problem.


     2. Reconfigure the baseurl/etc. for the repository, to point to a working

        upstream. This is most often useful if you are using a newer

        distribution release than is supported by the repository (and the

        packages for the previous distribution release still work).


     3. Run the command with the repository temporarily disabled

            yum --disablerepo=elasticsearch-6.x ...


     4. Disable the repository permanently, so yum won't use it by default. Yum

        will then just ignore the repository until you permanently enable it

        again or use --enablerepo for temporary usage:


            yum-config-manager --disable elasticsearch-6.x

        or

            subscription-manager repos --disable=elasticsearch-6.x


     5. Configure the failing repository to be skipped, if it is unavailable.

        Note that yum will try to contact the repo. when it runs most commands,

        so will have to try and fail each time (and thus. yum will be be much

        slower). If it is a very temporary problem though, this is often a nice

        compromise:


            yum-config-manager --save --setopt=elasticsearch-6.x.skip_if_unavailable=true


failure: repodata/repomd.xml from elasticsearch-6.x: [Errno 256] No more mirrors to try.

https://artifacts.elastic.co/packages/6.x/yum/repodata/repomd.xml: [Errno 14] curl#6 - "Could not resolve host: artifacts.elastic.co; Temporary failure in name resolution"

[root@linux-node1 ~]# yum update

Loaded plugins: fastestmirror, langpacks

Repository base is listed more than once in the configuration

Repository updates is listed more than once in the configuration

Repository extras is listed more than once in the configuration

Repository centosplus is listed more than once in the configuratio
# 出现这种报错原因是我用了国内阿里的免费DNS服务器,加一个世界有名历史悠久的dns服务器 114.114.114.114就可以解析这个域名了
[root@linux-node1 ~] echo  servername 114.114.114.114  >>vi /etc/resolve.conf


[root@linux-node1 ~] yum makecache

Loaded plugins: fastestmirror, langpacks

Repository base is listed more than once in the configuration

Repository updates is listed more than once in the configuration

Repository extras is listed more than once in the configuration

Repository centosplus is listed more than once in the configuration

base                                                                           | 3.6 kB  00:00:00

elasticsearch-6.x                                                              | 1.3 kB  00:00:00

extras                                                                         | 3.4 kB  00:00:00

logstash-6.x                                                                   | 1.3 kB  00:00:00

updates                                                                        | 3.4 kB  00:00:00

(1/18): base/7/x86_64/group_gz                                                 | 156 kB  00:00:05

(2/18): base/7/x86_64/other_db                                                 | 2.5 MB  00:00:06

(3/18): base/7/x86_64/filelists_db                                             | 6.7 MB  00:00:07

(4/18): base/7/x86_64/primary_db                                               | 5.7 MB  00:00:15

(5/18): elasticsearch-6.x/primary                                              |  31 kB  00:00:14

(6/18): elasticsearch-6.x/other                                                | 4.1 kB  00:00:00

(7/18): extras/7/x86_64/prestodelta                                            | 102 kB  00:00:00

(8/18): extras/7/x86_64/filelists_db
# 前台启动logstash
[root@linux-node1 logstash]# /usr/share/logstash/bin/logstash -e 'input{stdin{}}output{stdout{codec=>rubydebug}}'

WARNING: Could not find logstash.yml which is typically located in $LS_HOME/config or /etc/logstash. You can specify the path using --path.settings. Continuing using the defaults

Could not find log4j2 configuration at path /usr/share/logstash/config/log4j2.properties. Using default config which logs errors to the console

The stdin plugin is now waiting for input:

hehe

{

       "message" => "hehe",

    "@timestamp" => 2018-02-03T16:35:59.357Z,

      "@version" => "1",

          "host" => "linux-node1"

}


[root@linux-node1 logstash]# /usr/share/logstash/bin/logstash -e 'input { stdin{} } output { elasticsearch { hosts=> ["10.0.0.5:9200"] } }'

WARNING: Could not find logstash.yml which is typically located in $LS_HOME/config or /etc/logstash. You can specify the path using --path.settings. Continuing using the defaults

Could not find log4j2 configuration at path /usr/share/logstash/config/log4j2.properties. Using default config which logs errors to the console

The stdin plugin is now waiting for input:

123

hehe

hahahaha
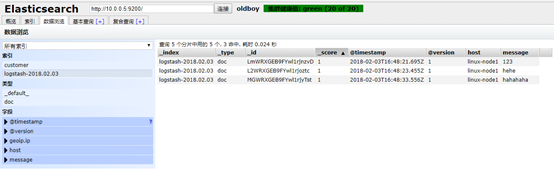
es查看索引
 [root@linux-node1 logstash]# /usr/share/logstash/bin/logstash -e 'input { stdin{} } output { elasticsearch { hosts=> ["10.0.0.5:9200"] } stdout{ codec => rubydebug } }'

WARNING: Could not find logstash.yml which is typically located in $LS_HOME/config or /etc/logstash. You can specify the path using --path.settings. Continuing using the defaults

Could not find log4j2 configuration at path /usr/share/logstash/config/log4j2.properties. Using default config which logs errors to the console

The stdin plugin is now waiting for input:

hahahaha

{

    "@timestamp" => 2018-02-03T16:56:30.522Z,

          "host" => "linux-node1",

      "@version" => "1",

       "message" => "hahahaha"

}

ok

{

    "@timestamp" => 2018-02-03T16:56:33.236Z,

          "host" => "linux-node1",

      "@version" => "1",

       "message" => "ok"

}

yes

{

    "@timestamp" => 2018-02-03T16:56:38.412Z,

          "host" => "linux-node1",

      "@version" => "1",

       "message" => "yes"

}


#编写配置文件方便启动优雅输出模式

[root@linux-node1 logstash]# cat /etc/logstash/conf.d/01-logstash.conf

input { stdin { } }

output {

  elasticsearch { hosts => ["localhost:9200"] }

  stdout { codec => rubydebug }

}
# 指定输入输出配置文件运行
[root@linux-node1 logstash]# /usr/share/logstash/bin/logstash -f /etc/logstash/conf.d/01-logstash.conf

WARNING: Could not find logstash.yml which is typically located in $LS_HOME/config or /etc/logstash. You can specify the path using --path.settings. Continuing using the defaults

Could not find log4j2 configuration at path /usr/share/logstash/config/log4j2.properties. Using default config which logs errors to the console

The stdin plugin is now waiting for input:

haha

{

      "@version" => "1",

    "@timestamp" => 2018-02-03T17:09:26.941Z,

       "message" => "haha",

          "host" => "linux-node1"

}

我是谁

{

      "@version" => "1",

    "@timestamp" => 2018-02-03T17:09:32.405Z,

       "message" => "我是谁",

          "host" => "linux-node1"

}


# 配置收集日志

[root@linux-node1 ~]# cat file.conf

input {

    file {

        path => "/var/log/messages"

        type => "system"

        start_position => "beginning"

    }

}


output {

    elasticsearch {

        hosts => ["10.0.0.5:9200"]

        index => "system-%{+YYYY.MM.dd}"

        }

}

[root@linux-node1 ~]# /usr/share/logstash/bin/logstash -f file.conf

WARNING: Could not find logstash.yml which is typically located in $LS_HOME/config or /etc/logstash. You can specify the path using --path.settings. Continuing using the defaults

Could not find log4j2 configuration at path /usr/share/logstash/config/log4j2.properties. Using default config which logs errors to the console
# 注意空格
# 配置收集java日志文件,并对收集的日志作判断
[root@linux-node1 ~]# cat file.conf
input {
file {
path => "/var/log/messages"
type => "system"
start_position => "beginning"
}
file {
path => "/var/log/elasticsearch/oldboy.log"
type => "es-error"
start_position => "beginning"
}
}
output {
if [type] =="system" {
elasticsearch {
hosts => ["10.0.0.5:9200"]
index => "system-%{+YYYY.MM.dd}"
}
}
if [type] == "es-error" {
elasticsearch {
hosts => ["10.0.0.5:9200"]
index => "es-error-%{+YYYY.MM.dd}"
}
}
}
但是这样配置报错日志不是连贯的因为是按行存储
我们应该将一个报错信息错误统一存到一个事件中。
[root@linux-node1 ~]# cat multiline.conf

input {

        stdin {

                codec => multiline {

                pattern => "^["

                negate => true

                what => "previous"

                }

        }

}


output {

        stdout {

                codec => "rubydebug"


}

}


#测试匹配【

[root@linux-node1 ~]# /usr/share/logstash/bin/logstash -f multi.conf

WARNING: Could not find logstash.yml which is typically located in $LS_HOME/config or /etc/logstash. You can specify the path using --path.settings. Continuing using the defaults

Could not find log4j2 configuration at path /usr/share/logstash/config/log4j2.properties. Using default config which logs errors to the console

The stdin plugin is now waiting for input:

[1]

[2]

{

       "message" => "[1]",

    "@timestamp" => 2018-02-03T18:11:40.168Z,

          "host" => "linux-node1",

      "@version" => "1"

}

[3dsdfdffdgdf

{

       "message" => "[2]",

    "@timestamp" => 2018-02-03T18:12:05.845Z,

          "host" => "linux-node1",

      "@version" => "1"

}

fdgdfgdfgdfgdfdfdf

sdfsdfsdfsd

sdfsdfsd

[4

{

       "message" => "[3dsdfdffdgdf
fdgdfgdfgdfgdfdfdf
sdfsdfsdfsd
sdfsdfsd",

    "@timestamp" => 2018-02-03T18:12:18.265Z,

          "host" => "linux-node1",

      "@version" => "1",

          "tags" => [

        [0] "multiline"

    ]

}
将这样的匹配规则放进总配置文件
[root@linux-node1 ~]# cat file.conf

input {

    file {

        path => "/var/log/messages"

        type => "system"

        start_position => "beginning"

    }


    file {

         path => "/var/log/elasticsearch/oldboy.log"

     type => "es-error"

         start_position => "beginning"

         codec => multiline {

                pattern => "^["

                negate => true

                what => "previous"

            }

     }

}
安装kibana
[root@linux-node1 ~]# rpm --import https://artifacts.elastic.co/GPG-KEY-elasticsearch

[root@linux-node1 ~]# cd /etc/yum.repos.d/

[root@linux-node1 yum.repos.d]# vi kibana.repo

[kibana-6.x]

name=Kibana repository for 6.x packages

baseurl=https://artifacts.elastic.co/packages/6.x/yum

gpgcheck=1

gpgkey=https://artifacts.elastic.co/GPG-KEY-elasticsearch

enabled=1

autorefresh=1

type=rpm-md


yum install kibana
#更改kibana配置文件
[root@linux-node1 yum.repos.d]# grep '^[a-z]' /etc/kibana/kibana.yml

server.port: 5601

server.host: "0.0.0.0"

elasticsearch.url: "http://10.0.0.5:9200"

kibana.index: ".kibana"
# 开个screen 执行启动脚本
[root@linux-node1 yum.repos.d]# /usr/share/kibana/bin/kibana

Ctrl+a+d 退出screen
#通过浏览器进入kibana界面
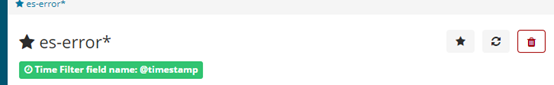
创建个index pattern
# discover 显示默认15分钟内的日志,改为today观察一天内的
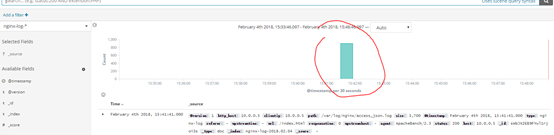
收集nginx的访问日志
yum install epel-release

yum install nginx –y
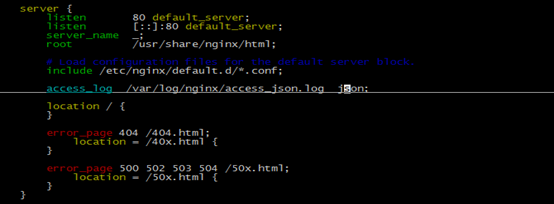
#定义nginx 日志数据格式为json
参考官方网站http://nginx.org/en/docs/http/ngx_http_log_module.html#log_format
vi /etc/nginx/nginx.conf

   log_format json '{"@timestamp":"$time_iso8601",'

                 '"host":"$server_addr",'

                 '"clientip":"$remote_addr",'

                 '"size":$body_bytes_sent,'

                 '"responsetime":$request_time,'

                 '"upstreamtime":"$upstream_response_time",'

                 '"upstreamhost":"$upstream_addr",'

                 '"http_host":"$host",'

                 '"url":"$uri",'

                 '"referer":"$http_referer",'

                 '"agent":"$http_user_agent",'

                 '"status":"$status"}';
# 指定使用json日志放在server
#启动nginx
[root@linux-node1 ~]# systemctl start nginx

[root@linux-node1 ~]# netstat -lntup|grep nginx

tcp        0      0 0.0.0.0:80              0.0.0.0:*               LISTEN      6333/nginx: master

tcp6       0      0 :::80                   :::*                    LISTEN      6333/nginx: master
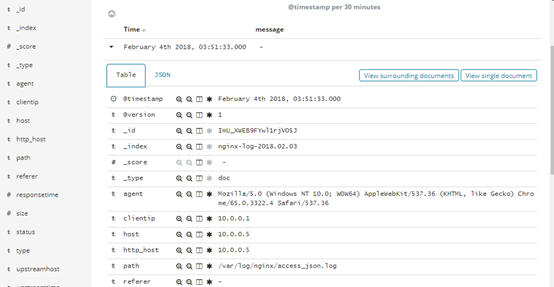
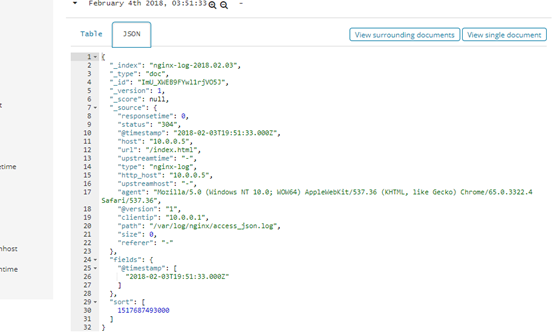
登陆浏览 输入 10.0.0.5 疯狂刷新生成json访问日志
tail –f /var/log/nginx/access_json.log

{"@timestamp":"2018-02-03T11:40:01-08:00","host":"10.0.0.5","clientip":"10.0.0.1","size":0,"responsetime":0.000,"upstreamtime":"-","upstreamhost":"-","http_host":"10.0.0.5","url":"/index.html","referer":"-","agent":"Mozilla/5.0 (Windows NT 10.0; WOW64) AppleWebKit/537.36 (KHTML, like Gecko) Chrome/65.0.3322.4 Safari/537.36","status":"304"}
#编写收集配置文件
[root@linux-node1 ~]# cat json.conf

input {


        file {

                path => "/var/log/nginx/access_json.log "

                codec => "json"

        }


}


output{


        stdout{

                codec => "rubydebug"

        }


}

指定配置启动

[root@linux-node1 ~]# /usr/share/logstash/bin/logstash -f json.conf
#更改总收集日志配置all.conf
#输入增加一个file

                  file {

                path => "/var/log/nginx/access_json.log"

                codec => json

                start_position => "beginning"

                type => "nginx-log"

}

        #输出增加一个type判断


    if [type] == "nginx-log" {

                elasticsearch {

        hosts => ["10.0.0.5:9200"]

        index => "nginx-log-%{+YYYY.MM.dd}"

        }

        }
查看head
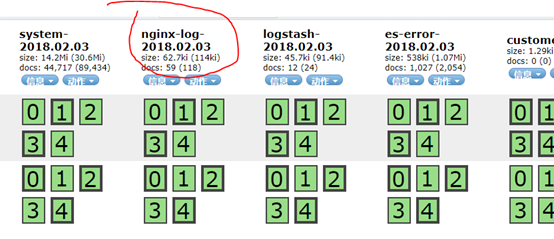
#kibana添加index pattern后查看
收集rsyslog日志
# 写syslog的收集日志配置
[
root@linux-node1 ~]# cat syslog.conf

Input {

        syslog {

                type => "system-syslog"

                host => "10.0.0.5"

                port => "514"


        }

}


output {

        stdout {

                codec => "rubydebug"

        }


}


#指定syslog配置文件运行logstash

[root@linux-node1 ~]# /usr/share/logstash/bin/logstash -f syslog.conf

[root@linux-node1 ~]# netstat -lntup |grep 514

tcp6       0      0 10.0.0.5:514            :::*                    LISTEN      7086/java

udp        0      0 10.0.0.5:514            0.0.0.0:*                           7086/java
# rsyslog配置文件
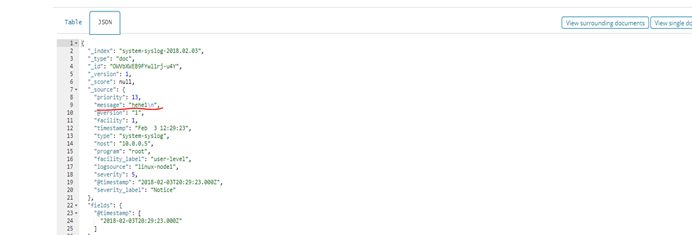
[root@linux-node1 ~]# tail -2 /etc/rsyslog.conf

*.* @@10.0.0.5:514

# ### end of the forwarding rule ###

#重启rsyslog

[root@linux-node1 ~]# systemctl restart rsyslog

#有输出表示收集成功

[root@linux-node1 ~]# /usr/share/logstash/bin/logstash -f syslog.conf

WARNING: Could not find logstash.yml which is typically located in $LS_HOME/config or /etc/logstash. You can specify the path using --path.settings. Continuing using the defaults

Could not find log4j2 configuration at path /usr/share/logstash/config/log4j2.properties. Using default config which logs errors to the console

{

          "facility" => 3,

           "message" => "Stopping System Logging Service...
",

         "timestamp" => "Feb  3 12:22:00",

    "facility_label" => "system",

              "type" => "system-syslog",

           "program" => "systemd",

          "priority" => 30,

    "severity_label" => "Informational",

              "host" => "10.0.0.5",

          "severity" => 6,

          "@version" => "1",

        "@timestamp" => 2018-02-03T20:22:00.000Z,

         "logsource" => "linux-node1"

}
#验证成功 将syslog收集模块写进all.conf
#写完运行
[root@linux-node1 ~]# /usr/share/logstash/bin/logstash -f all.conf
#查看head
#kibana 增加index pattern后查看
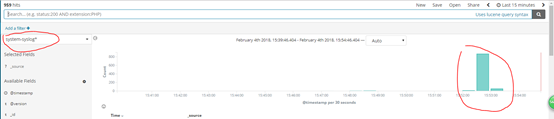
[root@linux-node1 ~]# logger "hehe1"

[root@linux-node1 ~]# logger "hehe2"

[root@linux-node1 ~]# logger "hehe3"

[root@linux-node1 ~]# logger "hehe4"

[root@linux-node1 ~]# logger "hehe5"

[root@linux-node1 ~]# logger "hehe5"
收集tcp日志
#tcp日志收集配置
[root@linux-node1 ~]# cat tcp.conf

input {

        tcp {

                host => "10.0.0.5"

                port => "6666"

        }

}


output {

        stdout {

                codec => "rubydebug"

        }

}
#启动logstash测试
[root@linux-node1 ~]# /usr/share/logstash/bin/logstash -f tcp.conf

[root@linux-node1 ~]# netstat -lntup|grep 6666

tcp6       0      0 10.0.0.5:6666           :::*                    LISTEN      7668/java
#使用nc命令测试
[root@linux-node1 ~]# nc 10.0.0.5 6666 < /etc/resolv.conf

[root@linux-node1 ~]# echo "hehe" | nc 10.0.0.5 6666

# 重定向一个伪设备(黑魔法)

[root@linux-node1 ~]# echo "oldboy" > /dev/tcp/10.0.0.5/6666

有输出就表示日志收集成功

{

       "message" => "hehe",

    "@timestamp" => 2018-02-03T20:49:06.743Z,

          "port" => 56202,

          "host" => "linux-node1",

      "@version" => "1"

}

{

       "message" => "oldboy",

    "@timestamp" => 2018-02-03T20:50:29.944Z,

          "port" => 56210,

          "host" => "linux-node1",

      "@version" => "1"

}
Filter插件
# 编写grok配置
参考网站
https://github.com/logstash-plugins/logstash-patterns-core/tree/master/patterns

[root@linux-node1 ~]# cat grok.conf

input {

        stdin {


        }


}


filter {

  grok {

      match => { "message" => "%{IP:client} %{WORD:method} %{URIPATHPARAM:request} %{NUMBER:bytes} %{NUMBER:duration}" }

            }

                }


output {

        stdout {

                codec => "rubydebug"

        }


}
#启动logstash
[root@linux-node1 ~]# /usr/share/logstash/bin/logstash -f grok.conf
输入 测试url
55.3.244.1 GET /index.html 15824 0.043

输出

{

       "message" => "55.3.244.1 GET /index.html 15824 0.043",

         "bytes" => "15824",

    "@timestamp" => 2018-02-03T21:10:31.416Z,

      "duration" => "0.043",

        "client" => "55.3.244.1",

      "@version" => "1",

          "host" => "linux-node1",

        "method" => "GET",

       "request" => "/index.html"

}
Logstash 解耦之消息队列
#安装redis

[root@linux-node1 ~]# yum install -y redis

#更改配置

[root@linux-node1 ~]# vi /etc/redis

daemonize yes   #设置在后台运行

bind 10.0.0.5     #绑定本机ip

[root@linux-node1 ~]# systemctl start redis

[root@linux-node1 ~]# netstat -lntup |grep 6379

tcp        0      0 10.0.0.5:6379           0.0.0.0:*               LISTEN      9199/redis-server 1


配置redis 收集日志

[root@linux-node1 ~]# cat redis-out.conf

input {

        stdin {}

}


output {

        redis {

                host => "10.0.0.5"

                port => "6379"

                db => "6"

                data_type => "list"

                key => "demo"

        }

}

#启动 logstash

[root@linux-node1 ~]# /usr/share/logstash/bin/logstash -f redis-out.conf
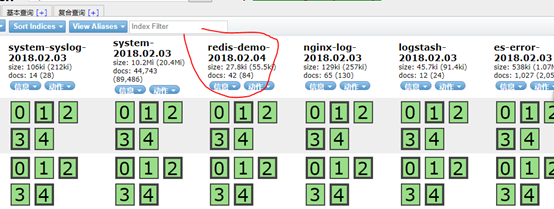
#启动redis-cli

[root@linux-node1 ~]# redis-cli -h 10.0.0.5

10.0.0.5:6379>

#输入info 生成一个db6的文件

# Keyspace

db6:keys=1,expires=0,avg_ttl=0

10.0.0.5:6379> select 6

OK

10.0.0.5:6379[6]> keys *

1) "demo"

#以列表形式查看

10.0.0.5:6379[6]> lindex demo -1

"{"host":"linux-node1","message":"hello redis","@timestamp":"2018-02-04T06:19:49.454Z","@version":"1"}"


#造42条数据

10.0.0.5:6379[6]> llen demo

(integer) 42


#配置redis-in.conf

[root@linux-node1 ~]# cat redis-in.conf

input {

         redis {

                host => "10.0.0.5"

                port => "6379"

                db => "6"

                data_type => "list"

                key => "demo"

        }


}

output {

         elasticsearch {

             hosts => ["10.0.0.5:9200"]

                 index => "redis-demo-%{+YYYY.MM.dd}"

         }

}


# 启动logstash 读取redis数据

[root@linux-node1 ~]# /usr/share/logstash/bin/logstash -f redis-in.conf

n":"1"}"

10.0.0.5:6379[6]> llen demo

(integer) 42

10.0.0.5:6379[6]> llen demo

(integer) 0
#查看 elasticsearch head
#配置运输者 文件
[root@linux-node1 ~]# cat shipper.conf

input {


        syslog {

                type => "system-syslog"

                host => "10.0.0.5"

                port => "514"

        }


    file {

        path => "/var/log/messages"

        type => "system"

        start_position => "beginning"

    }


    file {

         path => "/var/log/elasticsearch/oldboy.log"

     type => "es-error"

         start_position => "beginning"

         codec => multiline {

                pattern => "^["

                negate => true

                what => "previous"

            }

     }


        file {

                path => "/var/log/nginx/access_json.log"

                codec => json

                start_position => "beginning"

                type => "nginx-log"


        }


}


output {


    if [type] =="system" {


         redis {

                host => "10.0.0.5"

                port => "6379"

                db => "6"

                data_type => "list"

                key => "system"

        }


    }

    if [type] == "es-error" {


         redis {

                host => "10.0.0.5"

                port => "6379"

                db => "6"

                data_type => "list"

                key => "es-error"

        }

    }


    if [type] == "nginx-log" {

         redis {

                host => "10.0.0.5"

                port => "6379"

                db => "6"

                data_type => "list"

                key => "nginx-log"

        }


        }


    if [type] == "system-syslog" {

         redis {

                host => "10.0.0.5"

                port => "6379"

                db => "6"

                data_type => "list"

                key => "system-syslog"

        }


}

}

#开启redis查看

10.0.0.5:6379> select 6

OK

10.0.0.5:6379[6]> keys *

1) "system-syslog"

2) "system"

目前只显示system有日志

访问nginx 造访问日志

造点es-error日志cat oldboy.log |tee  -a oldboy.log

10.0.0.5:6379[6]> keys *

1) "es-error"

2) "system-syslog"

3) "nginx-log"

4) "system"
在node2 节点上配置 使得从redis读取数据 往es里面写
[root@linux-node2 ~]# cat indexer.conf

input {


         redis {

                type =>"system"

                host => "10.0.0.5"

                port => "6379"

                db => "6"

                data_type => "list"

                key => "system"

        }


         redis {

                type => "es-error"

                host => "10.0.0.5"

                port => "6379"

                db => "6"

                data_type => "list"

                key => "es-error"

        }


         redis {

                type => "nginx-log"

                host => "10.0.0.5"

                port => "6379"

                db => "6"

                data_type => "list"

                key => "nginx-log"

        }


         redis {

                type => "system-syslog"

                host => "10.0.0.5"

                port => "6379"

                db => "6"

                data_type => "list"

                key => "system-syslog"

        }


}


output {


    if [type] == "system" {


    elasticsearch {

        hosts => ["10.0.0.5:9200"]

        index => "system-%{+YYYY.MM.dd}"

        }

    }

    if [type] == "es-error" {

    elasticsearch {

        hosts => ["10.0.0.5:9200"]

        index => "es-error-%{+YYYY.MM.dd}"

        }


    }


    if [type] == "nginx-log" {

    elasticsearch {

        hosts => ["10.0.0.5:9200"]

        index => "nginx-log-%{+YYYY.MM.dd}"

        }

        }


    if [type] == "system-syslog" {

    elasticsearch {

        hosts => ["10.0.0.5:9200"]

        index => "system-syslog-%{+YYYY.MM.dd}"

        }

        }

}
#在node1上查看redis
[
root@linux-node1 ~]# redis-cli -h 10.0.0.5

10.0.0.5:6379> select 6

OK

10.0.0.5:6379[6]> keys *

1) "es-error"
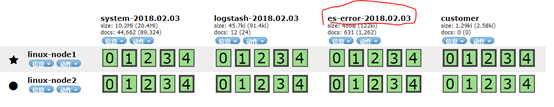
只剩一个es-error 由于es-error数据量过大需要一段时间读写
10.0.0.5:6379[6]> keys *

(empty list or set)

输出empty所有都读写完毕
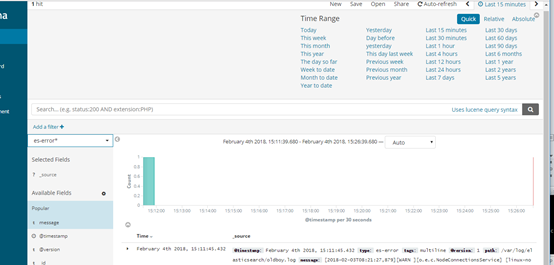
#在kibana上查看最近十五分钟的日志
造点数据使用压力测试命令ab -n代表请求次数 -c并发量
安装ab命令
查看apr-util, yum-utils是否安装:

$ rpm -qa|grep apr-util

apr-util-1.3.9-3.el6_0.1.x86_64

…

$ rpm -qa|grep yum-utils

yum-utils-1.1.30-30.el6.noarch

若在命令执行后有结果列出(如上),则说明已安装。


否则用yum安装:

$sudo yum -y install apr-util

$sudo yum -y install yum-utils

yumdownloader httpd-tools*

rpm2cpio httpd-*.rpm | cpio -idmv

[root@linux-node1 abtmp]# cp -pa usr/bin/ab /usr/bin/
[root@linux-node1 abtmp]# ab -n10000 -c1 http://10.0.0.5/
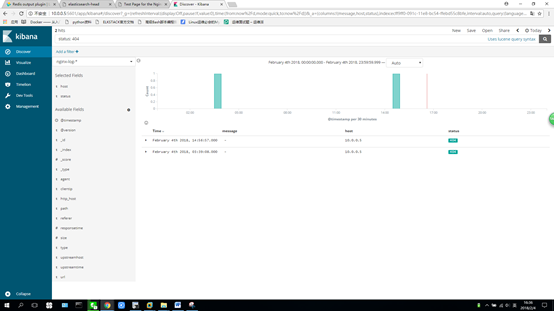
伪装生成一些系统日志输出1000个hehe
[root@linux-node1 abtmp]# for((i=1;i<=1000;i++));do logger "hehe$i";done
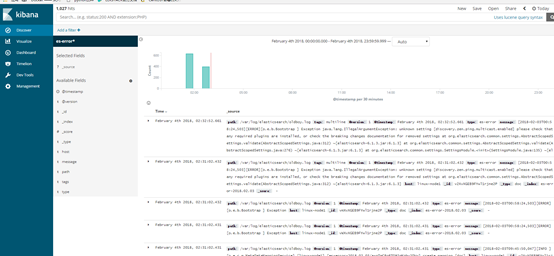
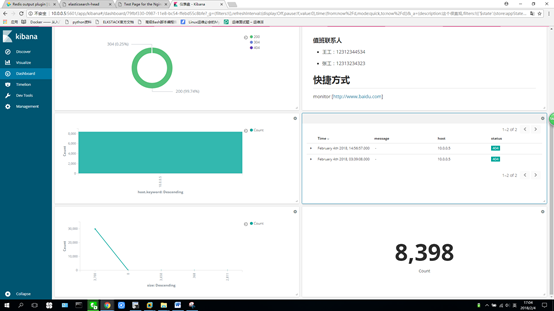
查看kibana
Kibana可视化 设置
搜索404 状态码请求
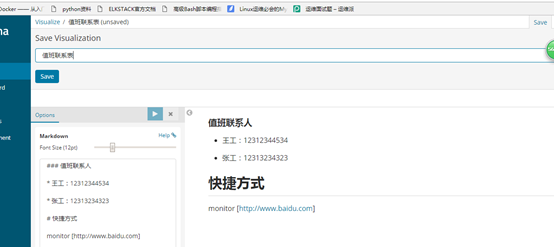
设置markdown
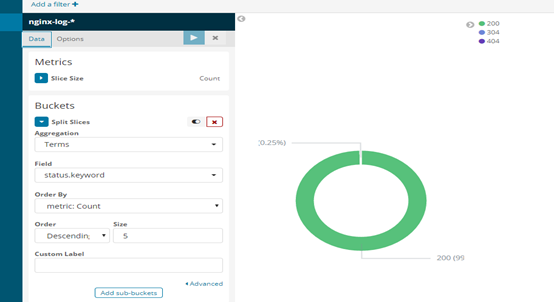
设置可视化饼图pie
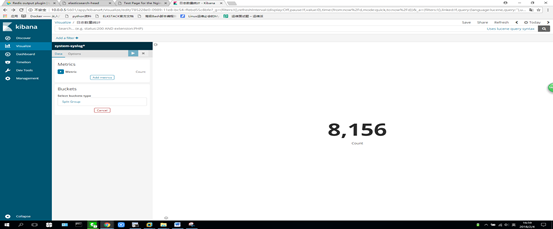
#增加一个统计 metric
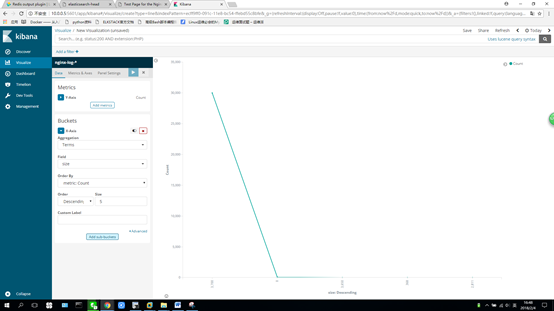
#创建折线图line
# 设置柱状图 vertic bar
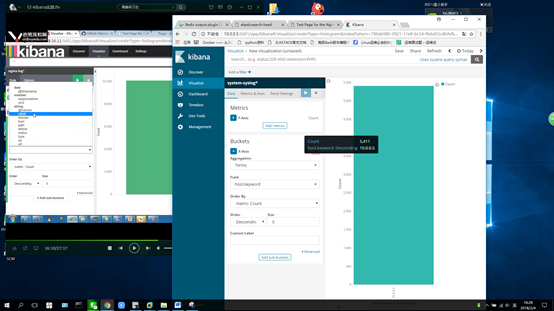
创建仪表盘dashboard
生产如何上线ELK。
- 日志分类
a) 系统日志 rsyslog logstash syslog 插件
b) 访问日志 nginx logstash codec json
c) 错误日志 file logstash file+ multiline
d) 运行日志 file logstash codec json
e) 设备日志 syslog logstash syslog插件
f) Debug日志 file logstash json or mulitline
- 日志标准化
- 路径 固定
- 格式 尽量json
3. 收集日志顺序
从系统日志开始->错误日志->运行日志->访问日志
4. 消息队列可以采用
Redis rabbitmq kafka