numpy模块
numpy模块可以用来做数据分析, 对numpy数组(既有行既有列) -- 矩阵 进行科学运算
import numpy as np

# 用array方法将列表转换为np数组
arr1 = np.array([1, 2, 3])
arr2 = np.array([4, 5, 6])

print(arr1)  # [1 2 3]
print(arr1 * arr2)  # [ 4 10 18]
创建numpy数组
# 一维数组
arr1 = np.array([1, 2, 3])
print(type(arr1), arr1)  # <class 'numpy.ndarray'> [1 2 3]

# 二维数组
arr2 = np.array([
    [1, 2, 3],
    [4, 5, 6]
])

print(arr2)
# [[1 2 3]
#  [4 5 6]]

# 三维数组
arr3 = np.array([
    [[1, 2, 3],
     [4, 5, 6]],
    [[7, 8, 9],
     [10, 11, 12]]
])

print(arr3)
'''
[[[ 1  2  3]
  [ 4  5  6]]

 [[ 7  8  9]
  [10 11 12]]]
'''

# 同过函数创建numpy数组
print(np.ones((2, 3)))  # 创建一个2行3列, 值都为1.的数组
print(np.zeros((2, 3)))
numpy数组的属性和用法
arr = np.array([
    [1, 2, 3],
    [4, 5, 6]
])

# T 数组的转置 (高维数组) ---> 行列互换
print(arr.T)
'''
[[1 4]
[2 5]
[3 6]]
'''

# dtype 数组元素的数据类型
print(arr.dtype)  # int32

# size 数组元素个数
print(arr.size)  # 6

# ndim 数组的维度
print(arr.ndim)  # 2

# shape 数组的维度长度(以元祖形式)
print(arr.shape[0])  # 2  0表示行
print(arr.shape[1])  # 3  1表示列

# astype 类型转换
arr = arr.astype(np.float64)
print(arr)
'''
[[1. 2. 3.]
 [4. 5. 6.]]
'''

# 索引取值,切片和修改值
print(arr[:, :])  # 打印所有行所有列
print(arr[0,0])  # 打印数组坐标为(1,1)的元素
print(arr[0, :]  # 打印打印第一行

# 逻辑取值
print(arr[arr > 4])  # [5. 6.]


# hstack & vstack 数组的合并
arr1 = np.array([
    [1, 2, 3],
    [4, 5, 6]
])
arr2 = np.array([
    ['a', 'b', 'c'],
    ['d', 'e', 'f']
])

print(np.hstack((arr1, arr2)))  # 拼接行 括号内只能放一个元祖(arr1, arr2)
print(np.vstack((arr1, arr2)))  # 拼接列
print(np.concatenate((arr1, arr2), axis=1))  # 默认以列合并 # 0表示列,1表示行


# arange 范围
print(np.arange(2, 10)  # [2 3 4 5 6 7 8 9]


# resharpe 重构形状
print(arr1.reshape((3, 2)))  # 3行2列
'''
[[1 2]
 [3 4]
 [5 6]]
'''

# numpy数组的运算
arr1 = np.ones((3,4)) * 4
print(arr1)

print(np.sin(arr1))


# 矩阵运算--点乘
arr1 = np.array([
    [1, 2, 3],
    [4, 5, 6]
])

arr2 = np.array([
    [1, 2],
    [3, 4],
    [5, 6]
])
#  2*3  3*2 --> 2*2
print(np.dot(arr1, arr2))
'''
[[22 28]
 [49 64]]

'''


# numpy.random生成随机数
print(np.random.rand(3, 4))
print(np.random.random((3, 4)))

# np.random.seed(1)
print(np.random.random((3, 4)))

s = np.random.RandomState(1)
print(s.random((3, 4)))

arr = np.array([[1, 2, 3], [4, 5, 6], [9, 8, 9]])
np.random.shuffle(arr)
print(arr)

# 针对一维
print(np.random.choice([1, 2, 3], 1))

# 针对某一个范围
print(np.random.randint(1, 100, (3, 4)))
matplotlib模块
matplotlib模块可以用来画图
条形图
from matplotlib import pyplot as plt  # 约定俗称
from matplotlib.font_manager import FontProperties  # 修改字体

font = FontProperties(fname='C:WindowsFontssimsun.ttc')

plt.style.use('ggplot')  # 设置背景

class_ = ['三班', '四班', '五班', '六班']
students = [30, 40, 50, 60]
class_index = range(len(class_))

plt.bar(class_index, students, color='y')

plt.xlabel('班级', fontproperties=font)
plt.ylabel('学生人数', fontproperties=font)
plt.title('班级-学生人数', fontproperties=font, fontsize=28, fontweight=30)
plt.xticks(class_index, class_, fontproperties=font)

plt.show()

直方图
import numpy as np
from matplotlib import pyplot as plt
from matplotlib.font_manager import FontProperties

font = FontProperties(fname='C:WindowsFontssimsun.ttc')

plt.style.use('ggplot')

x1 = np.random.randn(10000)
x2 = np.random.randn(10000)

fig = plt.figure()  # 生成一张画布
ax1 = fig.add_subplot(1, 2, 1)  # 1行2列第一个
ax2 = fig.add_subplot(1, 2, 2)

ax1.hist(x1, bins=50, color='b')
ax2.hist(x2, bins=50, color='y')

fig.suptitle('两个正太分布', fontproperties=font, fontsize=20)
ax1.set_title('x1的正太分布', fontproperties=font)
ax2.set_title('x2的正太分布', fontproperties=font)
plt.show()

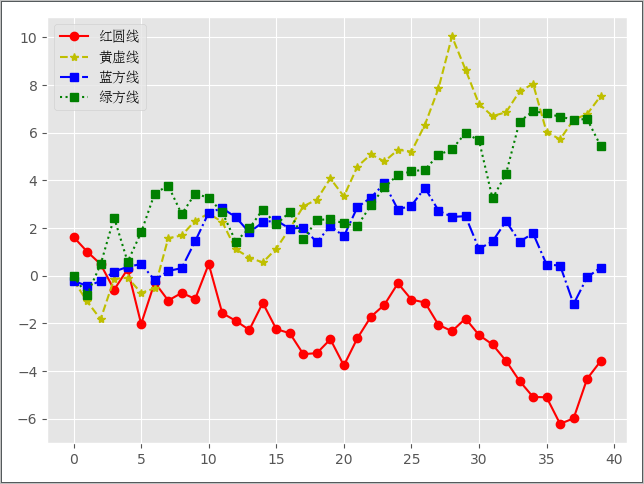
折线图
import numpy as np
from matplotlib import pyplot as plt
from matplotlib.font_manager import FontProperties

font = FontProperties(fname='C:WindowsFontssimsun.ttc')

plt.style.use('ggplot')

np.random.seed(1)
x1 = np.random.randn(40).cumsum()
x2 = np.random.randn(40).cumsum()
x3 = np.random.randn(40).cumsum()
x4 = np.random.randn(40).cumsum()

plt.plot(x1, c='r', linestyle='-', marker='o', label='红圆线')
plt.plot(x2, c='y', linestyle='--', marker='*', label='黄虚线')
plt.plot(x3, c='b', linestyle='-.', marker='s', label='蓝方线')
plt.plot(x4, c='g', linestyle=':', marker='s', label='绿方线')
plt.legend(loc='best', prop=font)  # 显示label

plt.show()
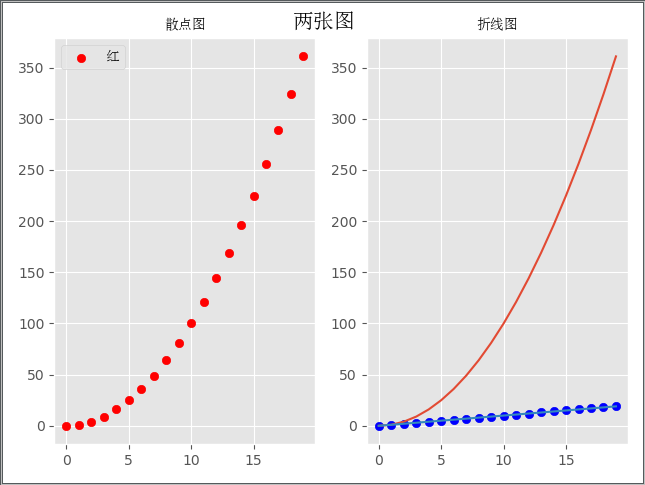
散点图 + 直线图
import numpy as np
from matplotlib import pyplot as plt  # 约定俗成
from matplotlib.font_manager import FontProperties  # 修改字体

font = FontProperties(fname='C:WindowsFontssimsun.ttc')

plt.style.use('ggplot')

fig = plt.figure()
ax1 = fig.add_subplot(1, 2, 1)
ax2 = fig.add_subplot(1, 2, 2)

x = np.arange(20)
y = x ** 2

x2 = np.arange(20)
y2 = x2

ax1.scatter(x, y, c='r', label='红')
ax2.scatter(x2, y2, c='b', label='蓝')

ax2.plot(x, y)
ax2.plot(x2, y2)

fig.suptitle('两张图', fontproperties=font, fontsize=15)
ax1.set_title('散点图', fontproperties=font)
ax2.set_title('折线图', fontproperties=font)
ax1.legend(prop=font)

plt.show()
pandas模块
pandas模块可以用来操作excel/json/sql/ini/csv(配置文件)/等
import pandas as pd
import numpy as np

np.random.seed(1)

index = pd.date_range('2019-01-01', periods=6, freq='M')
columns = ['c1', 'c2', 'c3', 'c4']
val = np.random.randn(6, 4)

df = pd.DataFrame(index=index, columns=columns, data=val)
print(df)

'''
                  c1        c2        c3        c4
2019-01-31  1.624345 -0.611756 -0.528172 -1.072969
2019-02-28  0.865408 -2.301539  1.744812 -0.761207
2019-03-31  0.319039 -0.249370  1.462108 -2.060141
2019-04-30 -0.322417 -0.384054  1.133769 -1.099891
2019-05-31 -0.172428 -0.877858  0.042214  0.582815
2019-06-30 -1.100619  1.144724  0.901591  0.502494
'''

# 保存文件
df.to_excel('date_c.xlsx')

# 读出文件
df = pd.read_excel('date_c.xlsx', index_col=[0])
print(df)

print(df.index)
'''
DatetimeIndex(['2019-01-31', '2019-02-28', '2019-03-31', '2019-04-30',
               '2019-05-31', '2019-06-30'],
              dtype='datetime64[ns]', freq=None)
'''


print(df.columns)  # Index(['c1', 'c2', 'c3', 'c4'], dtype='object')

print(df.values)
'''
[[ 1.62434536 -0.61175641 -0.52817175 -1.07296862]
 [ 0.86540763 -2.3015387   1.74481176 -0.7612069 ]
 [ 0.3190391  -0.24937038  1.46210794 -2.06014071]
 [-0.3224172  -0.38405435  1.13376944 -1.09989127]
 [-0.17242821 -0.87785842  0.04221375  0.58281521]
 [-1.10061918  1.14472371  0.90159072  0.50249434]]
'''

print(df[['c1', 'c2']])  # 按列
'''
                  c1        c2
2019-01-31  1.624345 -0.611756
2019-02-28  0.865408 -2.301539
2019-03-31  0.319039 -0.249370
2019-04-30 -0.322417 -0.384054
2019-05-31 -0.172428 -0.877858
2019-06-30 -1.100619  1.144724
'''


# 按index取值
print(df.loc['2019-01-31'])
print(df.loc['2019-01-31':'2019-05-31'])  # 按行

# 按照values取值
print(df)
print(df.iloc[0, 0])  # 第一个值

df.iloc[0, :] = 0  # 让第一行都为0
print(df)