刚入手data science, 想着自己玩一玩kaggle,玩了新手Titanic和House Price的 项目, 觉得基本的baseline还是可以写出来,但是具体到一些细节,以至于到能拿到的出手的成绩还是需要理论分析的。
本文旨在介绍kaggle比赛到各种原理与技巧,当然一切源自于coursera,由于课程都是英文的,且都比较好理解,这里直接使用英文
Features: numeric, categorical, ordinal, datetime, coordinate, text
Numeric features
All models are divided into tree-based model and non-tree-based model. 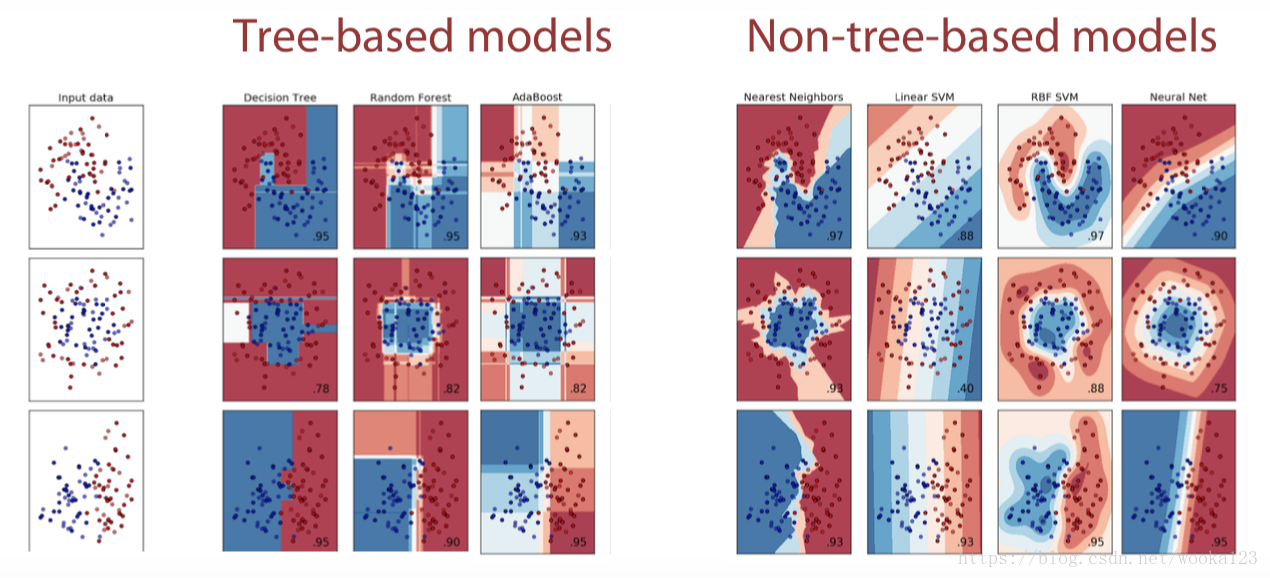
Scaling
For example: if we apply KNN algorithm to the instances below, as we see in the second row, we caculate the distance between the instance and the object. It is obvious that dimension of large scale dominates the distance.

Tree-based models doesn’t depend on scaling
Non-tree-based models hugely depend on scaling
How to do
sklearn:
- To [0,1]
sklearn.preprocessing.MinMaxScaler
X = ( X-X.min( ) )/( X.max()-X.min() ) -
To mean=0, std=1
sklearn.preprocessing.StandardScaler
X = ( X-X.mean( ) )/X.std()- if you want to use KNN, we can go one step ahead and recall that the bigger feature is, the more important it will be for KNN. So, we can optimize scaling parameter to boost features which seems to be more important for us and see if this helps
Outliers
The outliers make the model diviate like the red line.
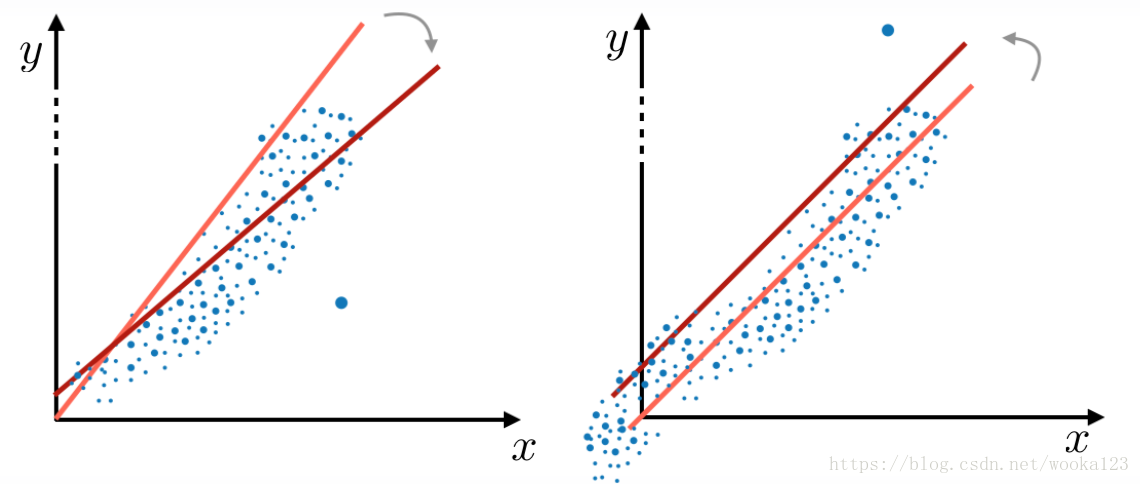
We can clip features values between teo chosen values of lower bound and upper bound
- Rank Transformation
If we have outliers, it behaves better than scaling. It will move the outliers closer to other objects
Linear model, KNN, Neural Network will benefit from this mothod.
rank([-100, 0, 1e5]) == [0,1,2]
rank([1000,1,10]) = [2,0,1]
scipy:
scipy.stats.rankdata
-
Other method
- Log transform: np.log(1 + x)
- Raising to the power < 1: np.sqrt(x + 2/3)
Feature Generation
Depends on
a. Prior knowledge
b. Exploratory data analysis
Ordinal features
Examples:
- Ticket class: 1,2,3
- Driver’s license: A, B, C, D
- Education: kindergarden, school, undergraduate, bachelor, master, doctoral
Processing
1.Label Encoding
* Alphabetical (sorted)
[S,C,Q] -> [2, 1, 3]
sklearn.preprocessing.LabelEncoder
- Order of appearance
[S,C,Q] -> [1, 2, 3]
Pandas.factorize
This method works fine with two ways because tree-methods can split feature, and extract most of the useful values in categories on its own. Non-tree-based-models, on the other side,usually can’t use this feature effectively.
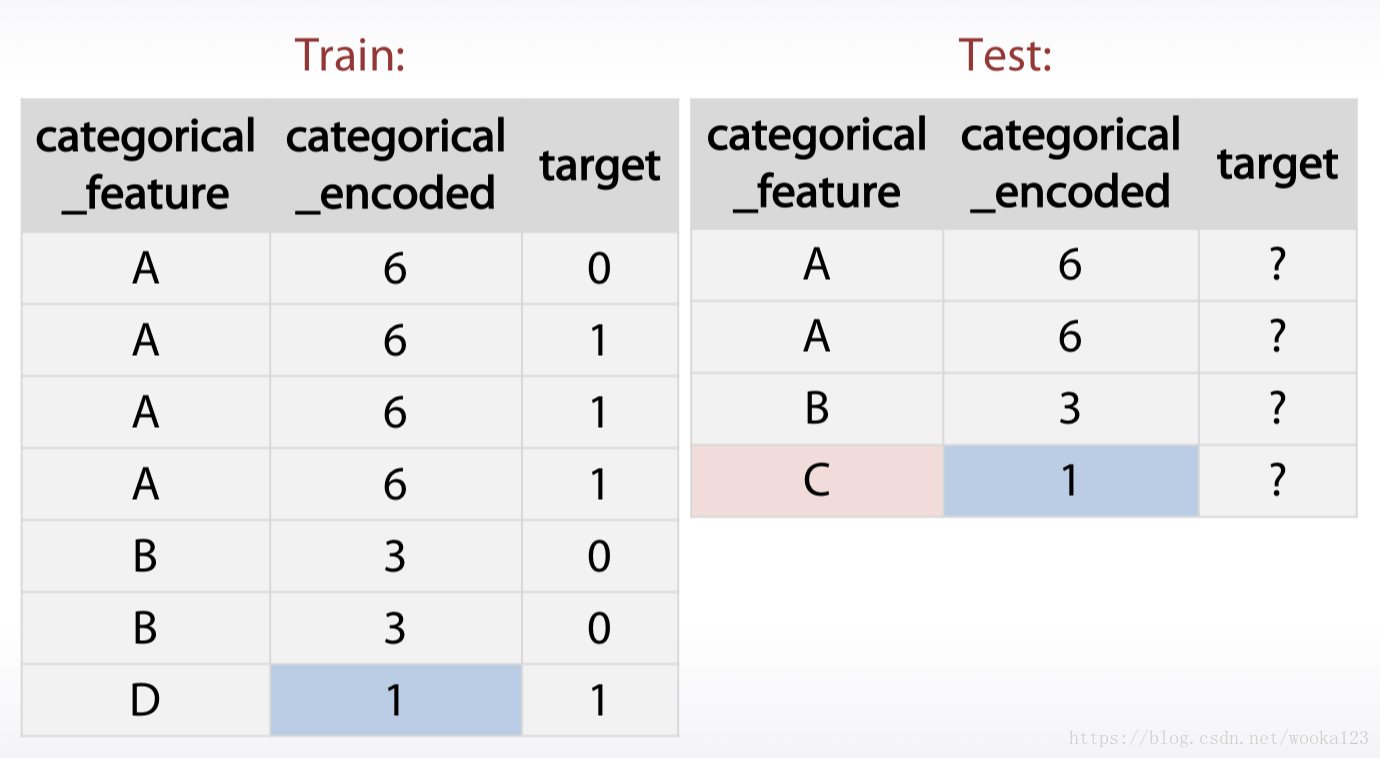
2.Frequency Encoding
[S,C,Q] -> [0.5, 0.3, 0.2]
encoding = titanic.groupby(‘Embarked’).size()
encoding = encoding/len(titanic)
titanic[‘enc’] = titanic.Embarked.map(encoding)
from scipy.stats import rankdata
For linear model, it is also helpful.
if frequency of category is correlated with target value, linear model will utilize this dependency.
3.One-hot Encoding
pandas.get_dummies
It give all the categories of one feature a new columns and often used for non-tree-based model.
It will slow down tree-based model, so we introduce sparse matric. Most of libaraies can work with these sparse matrices directly. Namely, xgboost, lightGBM
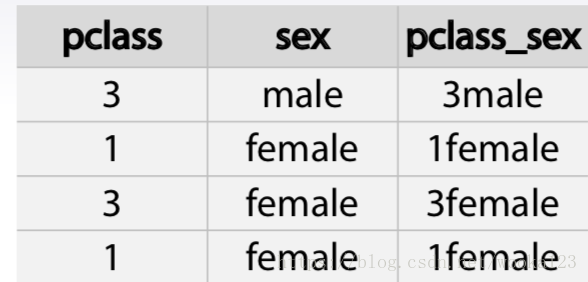
Feature generation
Interactions of categorical features can help linear models and KNN
By concatenating string
Datetime and Coordinates
Date and time
1.Periodicity
2.Time since
a. Row-independent moment
For example: since 00:00:00 UTC, 1 January 1970;

b. Row-dependent important moment
Number of days left until next holidays/ time passed after last holiday.
3.Difference betwenn dates
We can add date_diff feature which indicates number of days between these events
Coordicates
1.Interesting places from train/test data or additional data
Generate distance between the instance to a flat or an old building(Everything that is meanful)
2.Aggergates statistics
The price of surrounding building
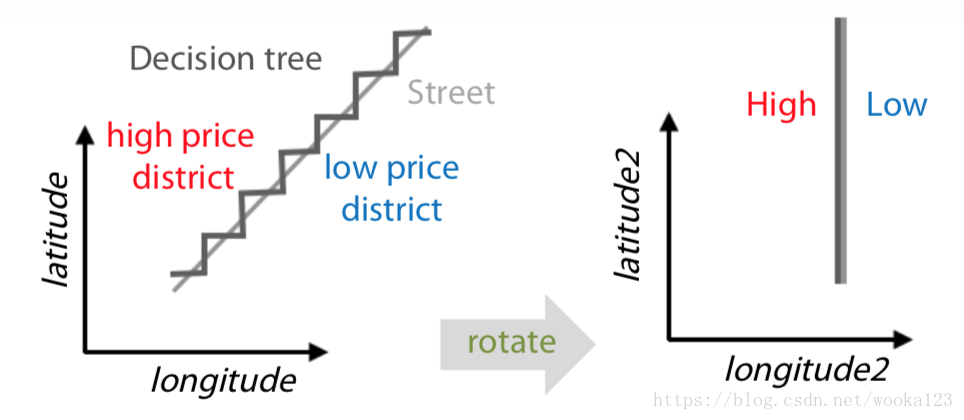
3.Rotation
Sometime it makes the model more precisely to classify the instances.
Missing data
Hidden Nan, numeric
When drawing a histgram, we see the following picture:
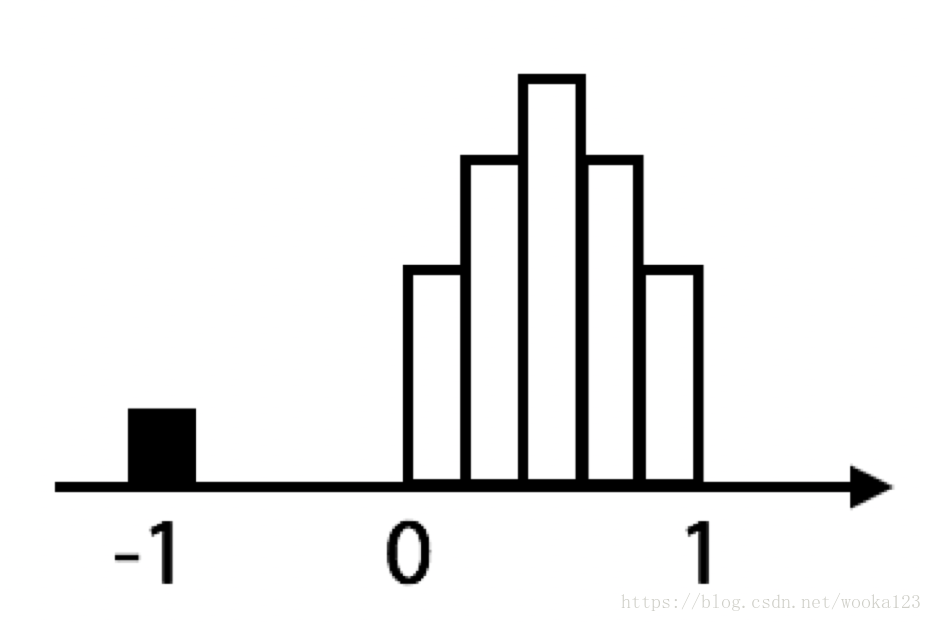
It is obivous that -1 is a hidden Nan which is no meaning for this feature.
Fillna approaches
1.-999,-1,etc(outside the feature range)
It is useful in a way that it gives three possibility to take missing value into separate category. The downside of this is that performance of linear networks can suffer.
2.mean,median
Second method usually beneficial for simple linear models and neural networks. But again for trees it can be harder to select object which had missing values in the first place.
3.Reconstruct:
-
Isnull
-
Prediction
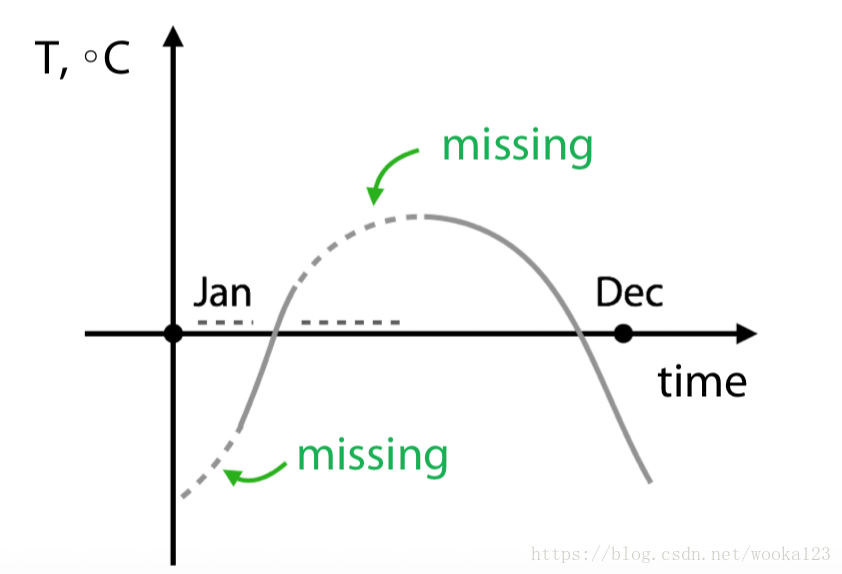
* Replace the missing data with the mean of medain grouped by another feature.
But sometimes it can be screwed up, like:
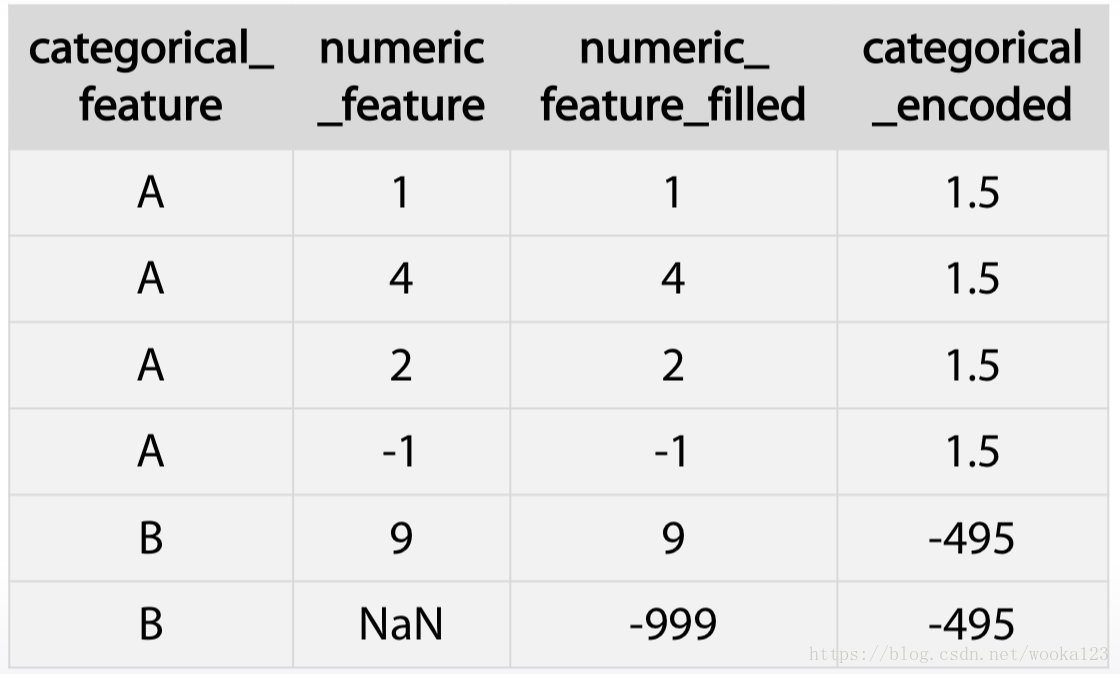
The way to handle this is to ignore missing values while calculating means for each category.
- Treating values which do not present in trian data
Just generate new feature indicating number of occurrence in the data(freqency)
- Xgboost can handle Nan
4.Remove rows with missing values
This one is possible, but it can lead to loss of important samples and a quality decrease.
Text
Bag of words
Text preprocessing
1.Lowercase
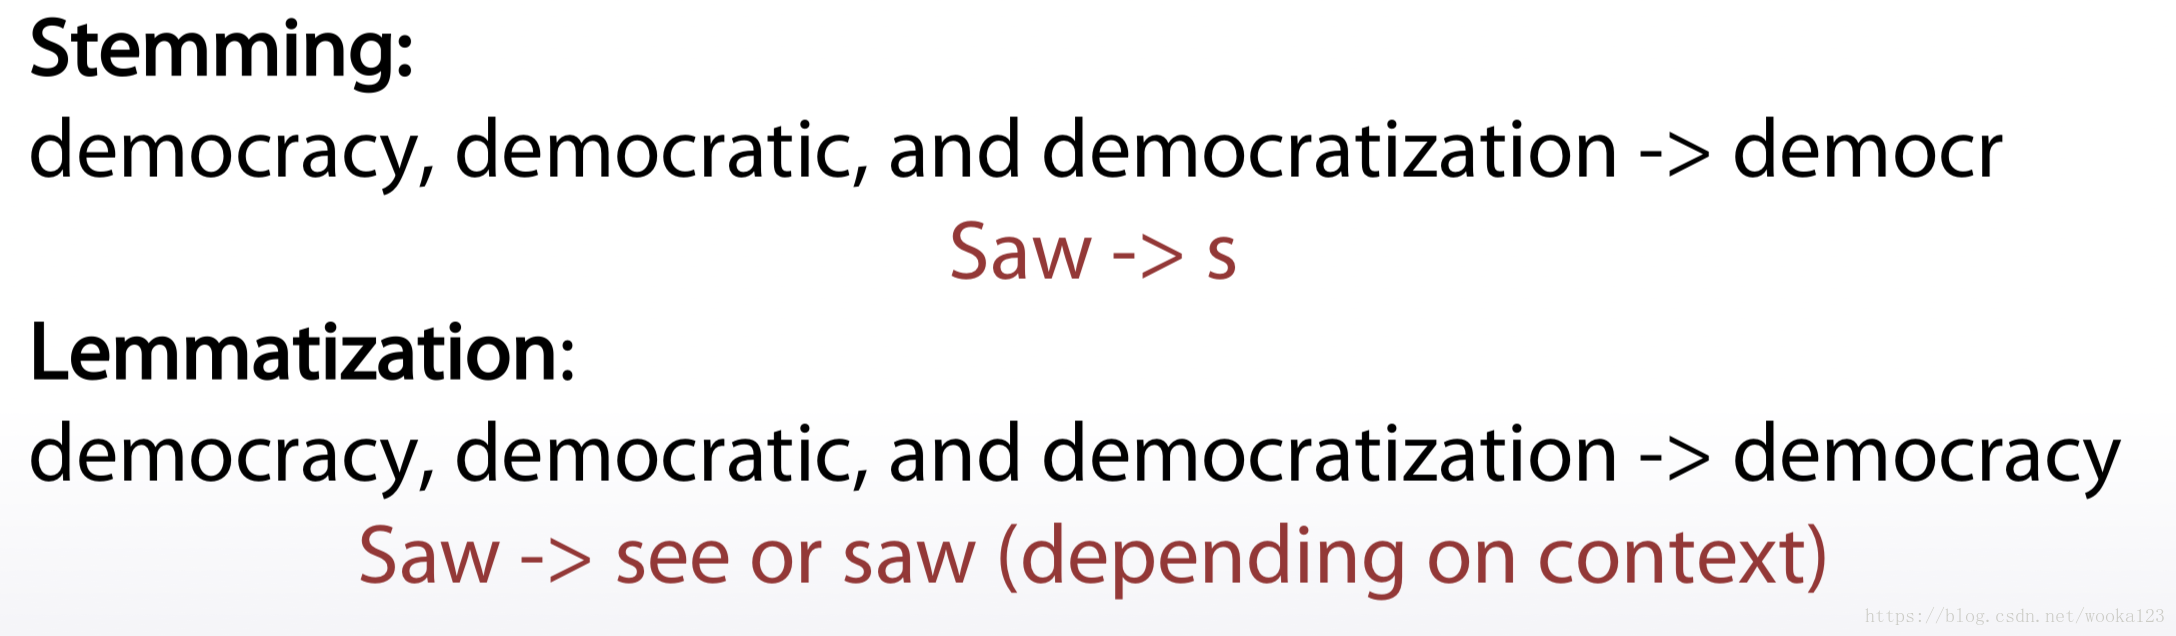
2.Lemmatization and Stemming
3.Stopwords
Examples:
1.Articles(冠词) or prepositions
2.Very common words
sklearn.feature_extraction.text.CountVectorizer:

max_df
- max_df : float in range [0.0, 1.0] or int, default=1.0
When building the vocabulary ignore terms that have a document frequency strictly higher than the given threshold (corpus-specific stop words). If float, the parameter represents a proportion of documents, integer absolute counts. This parameter is ignored if vocabulary is not None.
CountVectorizer
The number of times a term occurs in a given document
sklearn.feature_extraction.text.CountVectorizer
TFiDF
In order to re-weight the count features into floating point values suitable for usage by a classifier
-
Term frequency
tf = 1 / x.sum(axis=1) [:,None]
x = x * tf -
Inverse Document Frequency
idf = np.log(x.shape[0] / (x > 0).sum(0))
x = x * idf
N-gram
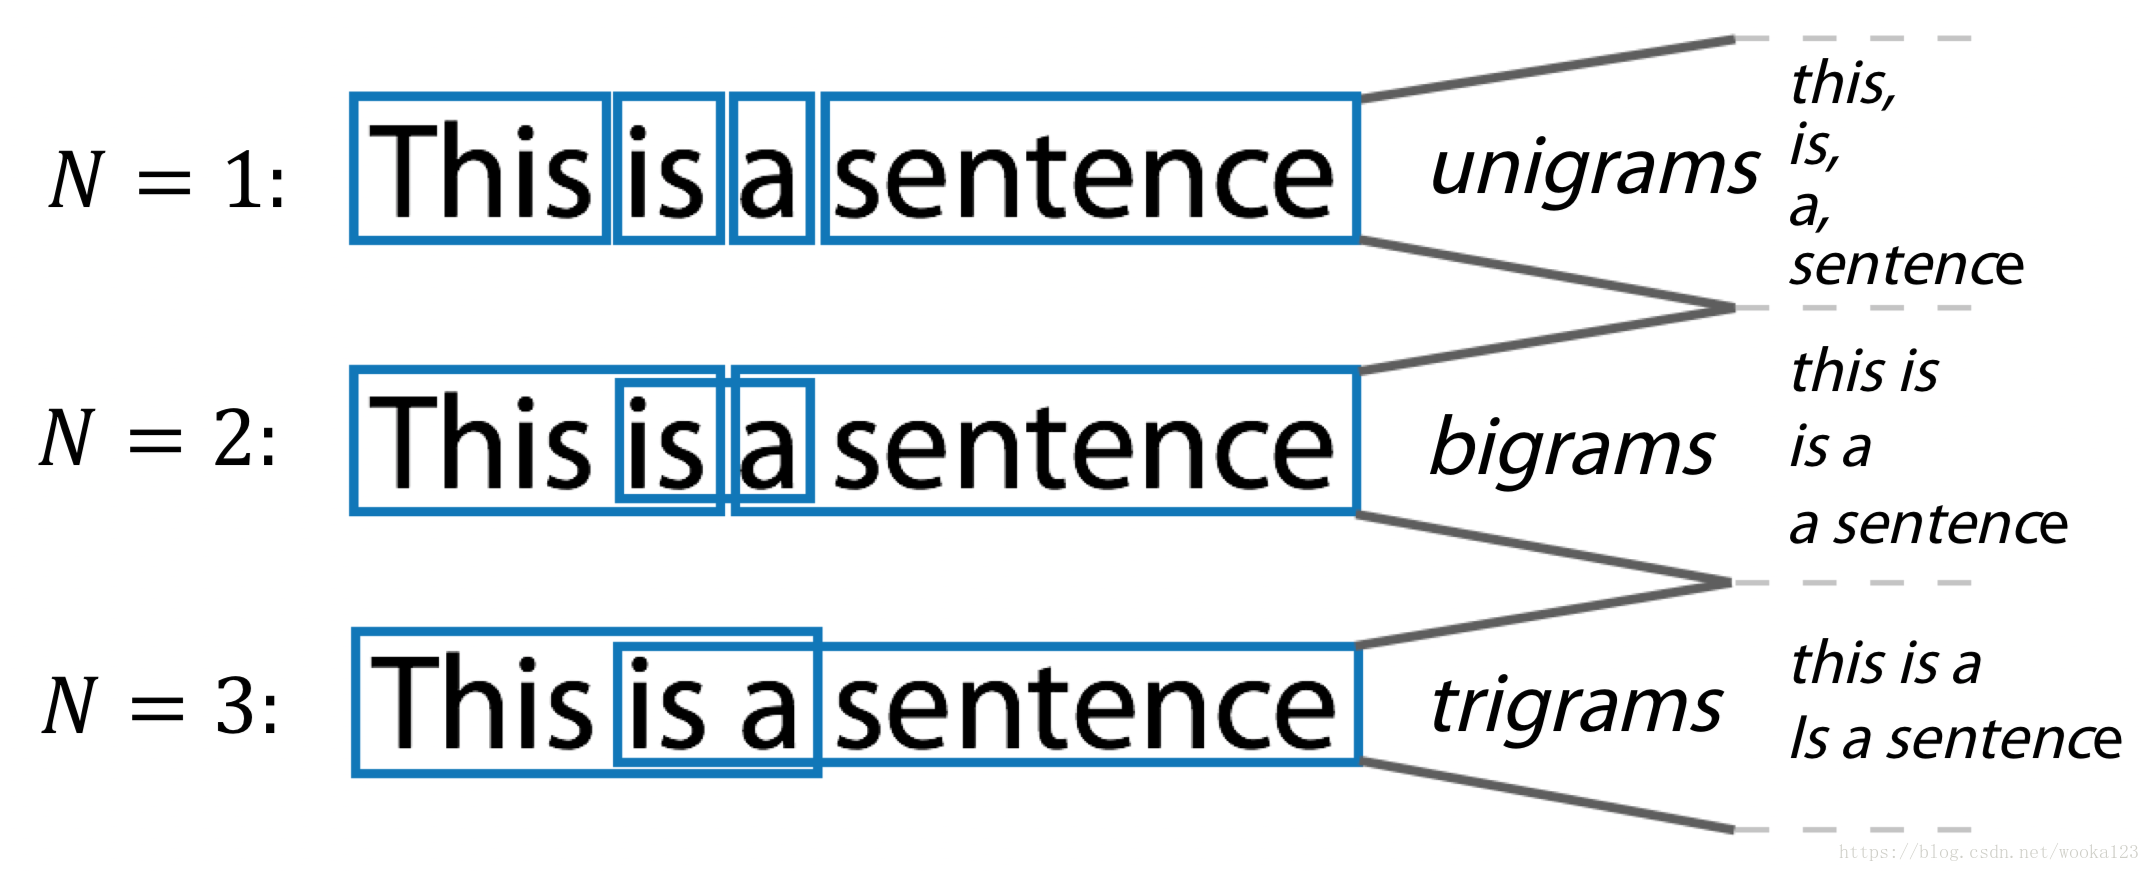
sklearn.feature_extraction.text.CountVectorizer:

Ngram_range, analyzer
- ngram_range : tuple (min_n, max_n)
The lower and upper boundary of the range of n-values for different n-grams to be extracted. All values of n such that min_n <= n <= max_n will be used.
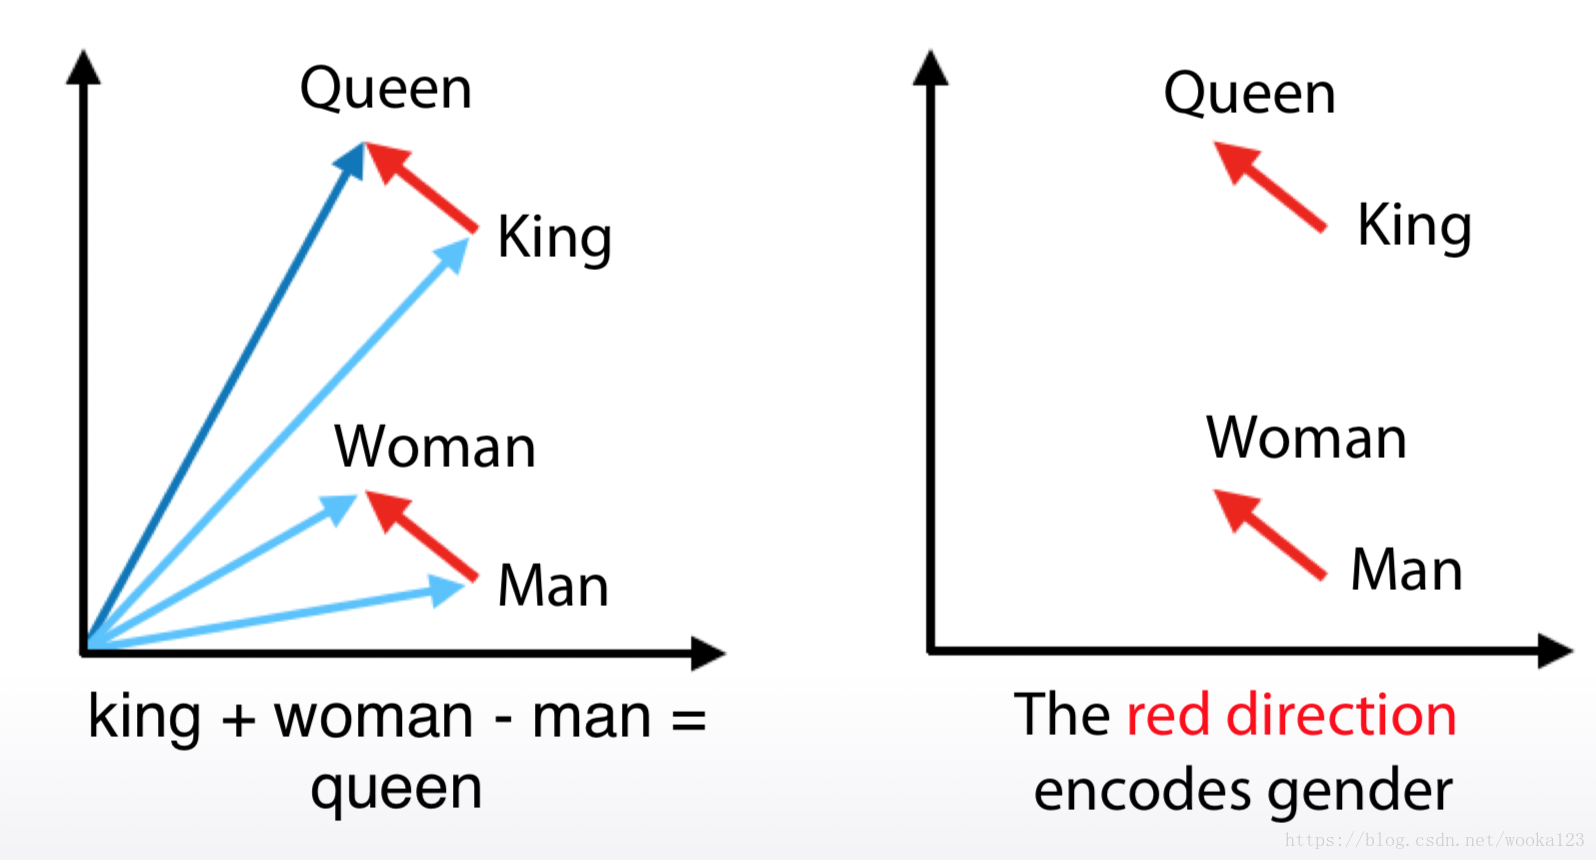
Embeddings(~word2vec)
It converts each word to some vector in some sophisticated space, which usually have several hundred dimensions
a. Relatively small vectors
b. Values in vector can be interpreted only in some cases
c. The words with similar meaning often have similar
embeddings
Example: