由于项目中需要用到Echarts,最近研究了一个星期。网上的教程也挺多的。磕磕碰碰的,难找到合适的例子。都说的马马虎虎。不废话了。开始吧。
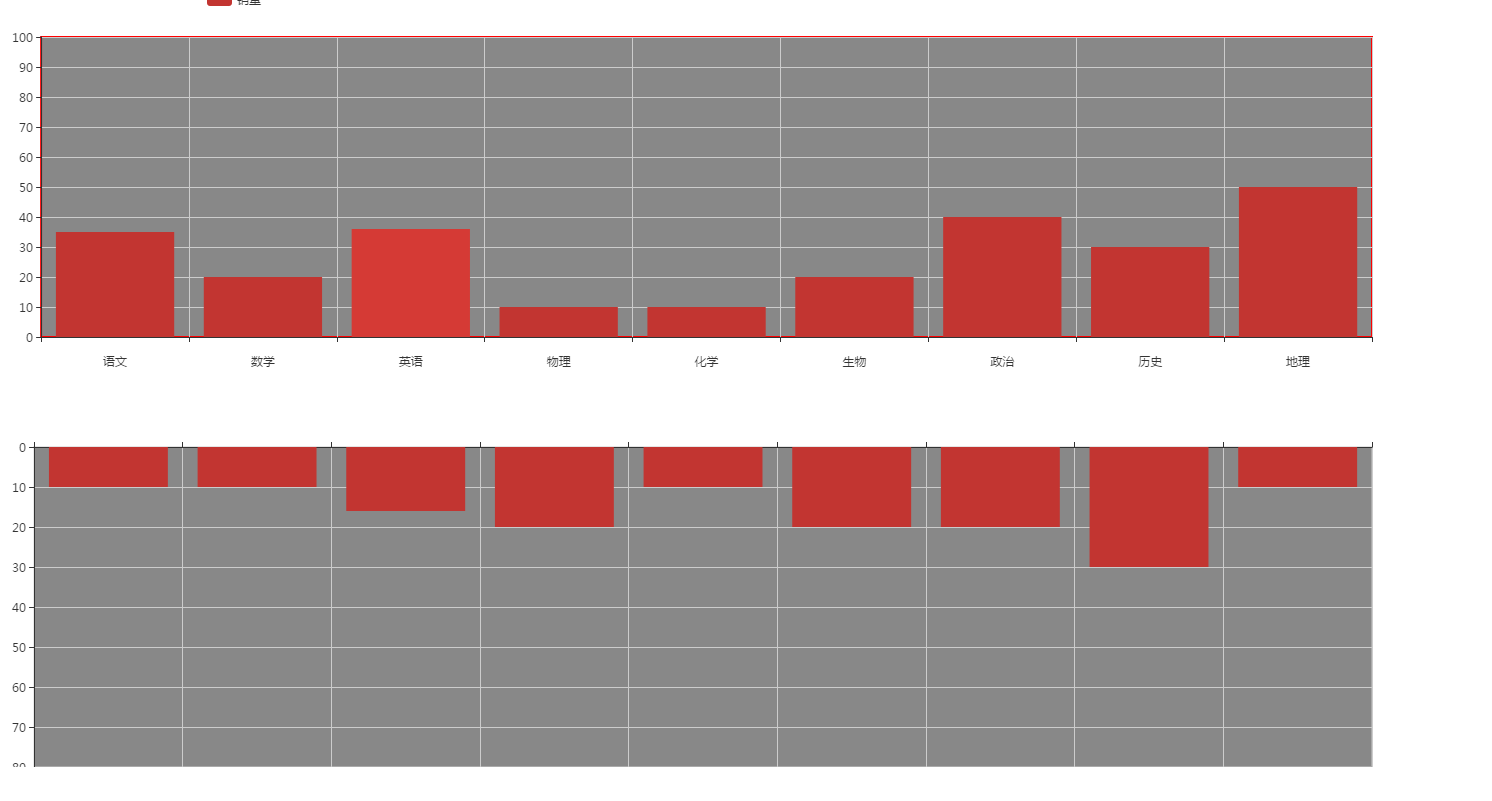
这种上下排列的。。。
还有这种地图的。(如下)

还有就是配置的问题。(从echarts官网看例子。但是不能直接打开。如何在本地打开。)
我研究了一套非常好的配置方案。如下。
1.准备一个盒子,<div id="main1" style=" 1600px;height:400px;"></div>
2.引入js 。 <script src="http://echarts.baidu.com/build/dist/echarts.js"></script>
3 .
// 路径配置开始
require.config({
paths: {
echarts: 'http://echarts.baidu.com/build/dist'
}
});
// 路径配置结束
// 使用柱状图就加载bar模块,按需加载
require(
[
'echarts',
'echarts/chart/bar',
'echarts/chart/line'
],
drawEcharts
);
4
// 函数调用
function drawEcharts(ec){
drawBar(ec);
drawBar2(ec);
drawBar3(ec);
drawBar4(ec);
你在一个页面中,弄了几个echarts图表。 你就弄几个函数。
}
5. 具体的函数。
函数一: function drawBar(ec){
var myBarChart = ec.init(document.getElementById('main1'));
var option = {}
myBarChart.setOption(option,true);
}
函数二:。。。。。。。。。。。。可以写n个。记得调用。然后html里弄n个盒子。一个盒子对应一个函数。这就是整体怎么使用的。
难点二。怎么给柱子添加点击跳转。下面是公司给的设计稿。

点击柱子。跳转到指定页面。
在你做的drawBar函数内部。加上如下代码
var ecConfig = require('echarts/config');
function eConsole(param) {
switch (param.dataIndex) {
case 0: //柱子1
window.location.href = "stSubject.html";
break;
case 1: //柱子2
window.location.href = "stSubject.html";
break;
case 2: //柱子3
window.location.href = "stSubject.html";
break;
case 3: //柱子3
window.location.href = "stSubject.html";
break;
case 4: //柱子3
window.location.href = "stSubject.html";
break;
case 5: //柱子3
window.location.href = "stSubject.html";
break;
default:
break;
}
}
myBarChart.on(ecConfig.EVENT.CLICK, eConsole);
就实现了跳转。
完整代码如下。复制到本地,既可看到效果。(b不需要你下载任何js库)
<!DOCTYPE html>
<html>
<head>
<meta charset="utf-8">
<meta http-equiv="X-UA-Compatible" content="IE=edge,chrome=1">
<title>Examples</title>
<meta name="description" content="">
<meta name="keywords" content="">
<link href="css/bootstrap.css" rel="stylesheet">
<link href="css/reset.css" rel="stylesheet">
<link  href="css/tongji.css" rel="stylesheet" >
</head>
<body>
<div class="statistcs">

<div class="content clearfix">
    <div class="right-box fl right-box1">
        <div class="item item1" id="item1"><div id="main1" style=" 1600px;height:400px;"></div></div>

    </div>
</div>
</div>
<!-- <script src="js/bootstrap.js"></script> -->
<!-- <script src="js/jquery.js"></script> -->
<!-- <script src="js/echarts.js"></script> -->
<!-- <script src="js/common.js"></script> -->
<script src="http://echarts.baidu.com/build/dist/echarts.js"></script>
<script>
// 路径配置
require.config({
  paths: {
    echarts: 'http://echarts.baidu.com/build/dist'
  }
});
  // 使用柱状图就加载bar模块,按需加载
  require(
      [
        'echarts',
        'echarts/chart/bar',
        'echarts/chart/line'
      ],
      drawEcharts
);
  // 函数调用
  function drawEcharts(ec){
  drawBar(ec);
}
function drawBar(ec){
  var myBarChart = ec.init(document.getElementById('main1'));
      var option = {
            color:['#1f67df'],
            // default:[ false ],
            title: {
               show:true,
               left:'50%',
               backgroundColor:'transparent',//标题的背景颜色
               text: '作业量',
            },
            grid:{
                show:true,
                left:'10%',
                containLabel:true,
                backgroundColor:"#fff",
            },
            tooltip: {},
            // legend: {},
                 xAxis : [
                {
                    splitLine:{show: true},//去除网格线
                    type : 'category',
                    data: ["五班","八班","十六班","","","","","","","","","",""],
                    // splitArea : {show : true}//保留网格区域
                }
            ],
             yAxis : [
                {
                    splitLine:{show: true},//去除网格线
                    type : 'value',
                    // splitArea : {show : true}//保留网格区域
                }
            ],
            series: [{
                name: '作业量',
                type: 'bar',
                // barWidth:"30%",
                data: [5, 20, 36, 0, 0, 0, 0, 0, 0, 0, 0, 0, 0]
            }]
        };
myBarChart.setOption(option,true);


  /* 给柱状图绑定click事件 */
    var ecConfig = require('echarts/config');
    function eConsole(param) {
        switch (param.dataIndex) {
            case 0:    //柱子1
                window.location.href = "https://www.baidu.com/";
                break;
            case 1:  //柱子2
                window.location.href = "https://www.baidu.com/";
                break;
            case 2:  //柱子3
                window.location.href = "https://www.baidu.com/";
                break;
            case 3:  //柱子3
                window.location.href = "https://www.baidu.com/";
                break;
            case 4:  //柱子3
                window.location.href = "https://www.baidu.com/";
                break;
            case 5:  //柱子3
                window.location.href = "https://www.baidu.com/";
                break;

            default:
                break;
        }
    }
    myBarChart.on(ecConfig.EVENT.CLICK, eConsole);
      /* 给柱状图绑定click事件 */
}
</script>
这样。就能实现跳转啦。
难点二。如何把官网的例子在本地运行。
1 准备盒子。<div id="main" style=" 1200px;height:800px;"></div>
2 引入这两个js 。。china.js是地图。务必引入。
<script src="js/echarts.js"></script>
<script src="js/china.js"></script>
2.5 或者可以引入china.json
这个需要配置如下代码:
//引入json地图
// $.get('json/china.json', function (chinaJson) {
// echarts.registerMap('china', chinaJson);
// });
3步:var myChart = echarts.init(document.getElementById('main'));
4部。就是把下载过来的代码粘贴到js中
官网的数据一般是这样的:
 var data = []
var geoCoordMap =[]
var convertData = function(data) {
var res = [];
for (var i = 0; i < data.length; i++) {
var geoCoord = geoCoordMap[data[i].name];
if (geoCoord) {
res.push({
name: data[i].name,
value: geoCoord.concat(data[i].value)
});
}
}
return res;
};
var convertedData = [
convertData(data),
convertData(data.sort(function(a, b) {
return b.value - a.value;
}).slice(0, 6))
];
data.sort(function(a, b) {
return a.value - b.value;
})
var selectedItems = [];
var categoryData = [];
var barData = [];
// var maxBar = 30;
var sum = 0;
var count = data.length;
for (var i = 0; i < data.length; i++) {
categoryData.push(data[i].name);
barData.push(data[i].value);
sum += data[i].value;
}
console.log(categoryData);
console.log(sum + " " + count)
option = {
backgroundColor: '#404a59',
animation: true,
animationDuration: 1000,
animationEasing: 'cubicInOut',
animationDurationUpdate: 1000,
animationEasingUpdate: 'cubicInOut',
title: [{
text: '全国用电量对比',
link: 'http://pages.anjuke.com/expert/newexpert.html',
subtext: 'data from Anjuke',
sublink: 'http://pages.anjuke.com/expert/newexpert.html',
left: 'center',
textStyle: {
color: '#fff'
}
}, {
id: 'statistic',
text: count ? '平均: ' + parseInt((sum / count).toFixed(4)) : '',
right: 120,
top: 40,
100,
textStyle: {
color: '#fff',
fontSize: 16
}
}],
toolbox: {
iconStyle: {
normal: {
borderColor: '#fff'
},
emphasis: {
borderColor: '#b1e4ff'
}
},
feature: {
dataZoom: {},
{
type: ['rect', 'polygon', 'clear']
},
saveAsImage: {
show: true
}
}
},
{
outOfBrush: {
color: '#abc'
},
brushStyle: {
borderWidth: 2,
color: 'rgba(0,0,0,0.2)',
borderColor: 'rgba(0,0,0,0.5)',
},
seriesIndex: [0, 1],
throttleType: 'debounce',
throttleDelay: 300,
geoIndex: 0
},
geo: {
map: 'china',
left: '10',
right: '35%',
center: [117.98561551896913, 31.205000490896193],
zoom: 1.5,
label: {
emphasis: {
show: false
}
},
roam: true,
itemStyle: {
normal: {
areaColor: '#323c48',
borderColor: '#111'
},
emphasis: {
areaColor: '#2a333d'
}
}
},
tooltip: {
trigger: 'item'
},
grid: {
right: 40,
top: 100,
bottom: 40,
'30%'
},
xAxis: {
type: 'value',
scale: true,
position: 'top',
boundaryGap: false,
splitLine: {
show: false
},
axisLine: {
show: false
},
axisTick: {
show: false
},
axisLabel: {
margin: 2,
textStyle: {
color: '#aaa'
}
},
},
yAxis: {
type: 'category',
// name: 'TOP 20',
nameGap: 16,
axisLine: {
show: true,
lineStyle: {
color: '#ddd'
}
},
axisTick: {
show: false,
lineStyle: {
color: '#ddd'
}
},
axisLabel: {
interval: 0,
textStyle: {
color: '#ddd'
}
},
data: categoryData
},
series: [{
// name: 'pm2.5',
type: 'scatter',
coordinateSystem: 'geo',
data: convertedData[0],
symbolSize: function(val) {
return Math.max(val[2] / 300, 8);
},
label: {
normal: {
formatter: '{b}',
position: 'right',
show: false
},
emphasis: {
show: true
}
},
itemStyle: {
normal: {
color: '#FF8C00',
position: 'right',
show: true
}
}
}, {
// name: 'Top 5',
type: 'effectScatter',
coordinateSystem: 'geo',
data: convertedData[0],
symbolSize: function(val) {
return Math.max(val[2] / 500, 8);
},
showEffectOn: 'render',
rippleEffect: {
brushType: 'stroke'
},
hoverAnimation: true,
label: {
normal: {
formatter: '{b}',
position: 'right',
show: true
}
},
itemStyle: {
normal: {
color: '#f4e925',
shadowBlur: 50,
shadowColor: '#EE0000'
}
},
zlevel: 1
}, {
id: 'bar',
zlevel: 2,
type: 'bar',
symbol: 'none',
itemStyle: {
normal: {
color: '#ddb926'
}
},
data: data
}]
};
function renderBrushed(params) {
var mainSeries = params.batch[0].selected[0];
var selectedItems = [];
var categoryData = [];
var barData = [];
var maxBar = 30;
var sum = 0;
var count = 0;
for (var i = 0; i < mainSeries.dataIndex.length; i++) {
var rawIndex = mainSeries.dataIndex[i];
var dataItem = convertedData[0][rawIndex];
var pmValue = dataItem.value[2];
sum += pmValue;
count++;
selectedItems.push(dataItem);
}
selectedItems.sort(function(a, b) {
// return b.value[2] - a.value[2];
return a.value - b.value;
});
for (var i = 0; i < Math.min(selectedItems.length, maxBar); i++) {
categoryData.push(selectedItems[i].name);
barData.push(selectedItems[i].value[2]);
}
this.setOption({
yAxis: {
data: categoryData
},
xAxis: {
axisLabel: {
show: !!count
}
},
title: {
id: 'statistic',
text: count ? '平均: ' + (sum / count).toFixed(4) : ''
},
series: {
id: 'bar',
// sort:'descending',
data: barData
}
});
}
最后。
myChart.setOption(option)
下面是整个代码。(复制到本地就能运行)
<!DOCTYPE html>
<html lang="en">
<head>
    <meta charset="UTF-8">
    <title>Title</title>
    <!-- 引入 ECharts 文件 -->
    <script src="js/echarts.js"></script>
    <script src="js/china.js"></script>
    <script src="js/jquery-1.9.1.js"></script>

</head>
<body>
<!-- 为 ECharts 准备一个具备大小(宽高)的 DOM -->
<div id="main" style=" 1200px;height:800px;"></div>
<script type="text/javascript">
//引入json地图
    // $.get('json/china.json', function (chinaJson) {
    //     echarts.registerMap('china', chinaJson);
    // });
    // 基于准备好的dom,初始化echarts实例
    var myChart = echarts.init(document.getElementById('main'));
   var data = [
    { name: "上海", value: 29780},
    { name: "珠海", value: 2186},
    { name: "三亚", value: 1135},
    { name: "惠州", value: 1973},
    { name: "海口", value: 2568},
    { name: "合肥", value: 4039},
    { name: "南京", value: 6959},
    { name: "杭州", value: 5632},
    { name: "苏州", value: 6707},
    { name: "无锡", value: 3393},
    { name: "昆山", value: 1894},
    { name: "广州", value: 15769},
    { name: "深圳", value: 8259},
    { name: "佛山", value: 5741},
    { name: "东莞", value: 3030},
    { name: "福州", value: 4542},
    { name: "厦门", value: 3329},
    { name: "南宁", value: 3157},
    { name: "郑州", value: 6690},
    { name: "武汉", value: 8678},
    { name: "长沙", value: 5303},
    { name: "南昌", value: 3025},
    { name: "北京", value: 20259},
    { name: "长春", value: 3016},
    { name: "大连", value: 3202},
    { name: "沈阳", value: 4540},
    { name: "哈尔滨", value: 3141},
    { name: "天津", value: 8626},
    { name: "济南", value: 4361},
    { name: "青岛", value: 6667},
    { name: "太原", value: 4080},
    { name: "石家庄", value: 6137},
    { name: "西安", value: 6991},
    { name: "成都", value: 13873},
    { name: "重庆", value: 13283},
    { name: "昆明", value: 4633},


];

var geoCoordMap = {
    "上海": [121.48, 31.22],
    "珠海": [113.52, 22.3],
    "三亚": [109.31, 18.14],
    "惠州": [114.4, 23.09],
    "海口": [110.35, 20.02],
    "合肥": [117.27, 31.86],
    "南京": [118.78, 32.04],
    "杭州": [120.19, 30.26],
    "苏州": [120.62, 31.32],
    "无锡": [120.29, 31.59],
    "昆山": [120.95, 31.39],
    "广州": [113.23, 23.16],
    "深圳": [114.07, 22.62],
    "佛山": [113.11, 23.05],
    "东莞": [113.75, 23.04],
    "福州": [119.3, 26.08],
    "厦门": [118.1, 24.46],
    "南宁": [108.33, 22.84],
    "郑州": [113.65, 34.76],
    "武汉": [114.31, 30.52],
    "长沙": [113, 28.21],
    "南昌": [115.89, 28.68],
    "北京": [116.46, 39.92],
    "长春": [125.35, 43.88],
    "大连": [121.62, 38.92],
    "沈阳": [123.38, 41.8],
    "哈尔滨": [126.63, 45.75],
    "天津": [117.2, 39.13],
    "济南": [117, 36.65],
    "青岛": [120.33, 36.07],
    "太原": [112.53, 37.87],
    "石家庄": [114.48, 38.03],
    "西安": [108.95, 34.27],
    "成都": [104.06, 30.67],
    "重庆": [106.54, 29.59],
    "昆明": [102.73, 25.04],
};

var convertData = function(data) {
    var res = [];
    for (var i = 0; i < data.length; i++) {
        var geoCoord = geoCoordMap[data[i].name];
        if (geoCoord) {
            res.push({
                name: data[i].name,
                value: geoCoord.concat(data[i].value)
            });
        }
    }
    return res;
};

var convertedData = [
    convertData(data),
    convertData(data.sort(function(a, b) {
        return b.value - a.value;
    }).slice(0, 6))
];
data.sort(function(a, b) {
    return a.value - b.value;
})

var selectedItems = [];
var categoryData = [];
var barData = [];
//   var maxBar = 30;
var sum = 0;
var count = data.length;
for (var i = 0; i < data.length; i++) {
    categoryData.push(data[i].name);
    barData.push(data[i].value);
    sum += data[i].value;
}
console.log(categoryData);
console.log(sum + "   " + count)
option = {
    backgroundColor: '#404a59',
    animation: true,
    animationDuration: 1000,
    animationEasing: 'cubicInOut',
    animationDurationUpdate: 1000,
    animationEasingUpdate: 'cubicInOut',
    title: [{
        text: '全国用电量对比',
        link: 'http://pages.anjuke.com/expert/newexpert.html',
        subtext: 'data from Anjuke',
        sublink: 'http://pages.anjuke.com/expert/newexpert.html',
        left: 'center',
        textStyle: {
            color: '#fff'
        }
    }, {
        id: 'statistic',
        text: count ? '平均: ' + parseInt((sum / count).toFixed(4)) : '',
        right: 120,
        top: 40,
         100,
        textStyle: {
            color: '#fff',
            fontSize: 16
        }
    }],
    toolbox: {
        iconStyle: {
            normal: {
                borderColor: '#fff'
            },
            emphasis: {
                borderColor: '#b1e4ff'
            }
        },
        feature: {
            dataZoom: {},
             {
                type: ['rect', 'polygon', 'clear']
            },
            saveAsImage: {
                show: true
            }
        }
    },
     {
        outOfBrush: {
            color: '#abc'
        },
        brushStyle: {
            borderWidth: 2,
            color: 'rgba(0,0,0,0.2)',
            borderColor: 'rgba(0,0,0,0.5)',
        },
        seriesIndex: [0, 1],
        throttleType: 'debounce',
        throttleDelay: 300,
        geoIndex: 0
    },
    geo: {
        map: 'china',
        left: '10',
        right: '35%',
        center: [117.98561551896913, 31.205000490896193],
        zoom: 1.5,
        label: {
            emphasis: {
                show: false
            }
        },
        roam: true,
        itemStyle: {
            normal: {
                areaColor: '#323c48',
                borderColor: '#111'
            },
            emphasis: {
                areaColor: '#2a333d'
            }
        }
    },
    tooltip: {
        trigger: 'item'
    },
    grid: {
        right: 40,
        top: 100,
        bottom: 40,
         '30%'
    },
    xAxis: {
        type: 'value',
        scale: true,
        position: 'top',
        boundaryGap: false,
        splitLine: {
            show: false
        },
        axisLine: {
            show: false
        },
        axisTick: {
            show: false
        },
        axisLabel: {
            margin: 2,
            textStyle: {
                color: '#aaa'
            }
        },
    },
    yAxis: {
        type: 'category',
        //  name: 'TOP 20',
        nameGap: 16,
        axisLine: {
            show: true,
            lineStyle: {
                color: '#ddd'
            }
        },
        axisTick: {
            show: false,
            lineStyle: {
                color: '#ddd'
            }
        },
        axisLabel: {
            interval: 0,
            textStyle: {
                color: '#ddd'
            }
        },
        data: categoryData
    },
    series: [{
        // name: 'pm2.5',
        type: 'scatter',
        coordinateSystem: 'geo',
        data: convertedData[0],
        symbolSize: function(val) {
            return Math.max(val[2] / 300, 8);
        },
        label: {
            normal: {
                formatter: '{b}',
                position: 'right',
                show: false
            },
            emphasis: {
                show: true
            }
        },
        itemStyle: {
            normal: {
                color: '#FF8C00',
                position: 'right',
                show: true
            }
        }
    }, {
        //  name: 'Top 5',
        type: 'effectScatter',
        coordinateSystem: 'geo',
        data: convertedData[0],
        symbolSize: function(val) {
            return Math.max(val[2] / 500, 8);
        },
        showEffectOn: 'render',
        rippleEffect: {
            brushType: 'stroke'
        },
        hoverAnimation: true,
        label: {
            normal: {
                formatter: '{b}',
                position: 'right',
                show: true
            }
        },
        itemStyle: {
            normal: {
                color: '#f4e925',
                shadowBlur: 50,
                shadowColor: '#EE0000'
            }
        },
        zlevel: 1
    }, {
        id: 'bar',
        zlevel: 2,
        type: 'bar',
        symbol: 'none',
        itemStyle: {
            normal: {
                color: '#ddb926'
            }
        },

        data: data
    }]
};


function renderBrushed(params) {
    var mainSeries = params.batch[0].selected[0];

    var selectedItems = [];
    var categoryData = [];
    var barData = [];
    var maxBar = 30;
    var sum = 0;
    var count = 0;

    for (var i = 0; i < mainSeries.dataIndex.length; i++) {
        var rawIndex = mainSeries.dataIndex[i];
        var dataItem = convertedData[0][rawIndex];
        var pmValue = dataItem.value[2];

        sum += pmValue;
        count++;

        selectedItems.push(dataItem);
    }

    selectedItems.sort(function(a, b) {
        //   return b.value[2] - a.value[2];
        return a.value - b.value;
    });

    for (var i = 0; i < Math.min(selectedItems.length, maxBar); i++) {
        categoryData.push(selectedItems[i].name);
        barData.push(selectedItems[i].value[2]);
    }

    this.setOption({
        yAxis: {
            data: categoryData
        },
        xAxis: {
            axisLabel: {
                show: !!count
            }
        },
        title: {
            id: 'statistic',
            text: count ? '平均: ' + (sum / count).toFixed(4) : ''
        },
        series: {
            id: 'bar',
            //        sort:'descending',
            data: barData
        }
    });
}
    myChart.setOption(option)
</script>
</body>
</html>