摘自:http://pythonhosted.org/scikit-fuzzy/auto_examples/plot_cmeans.html#example-plot-cmeans-py,加入了自己的理解!
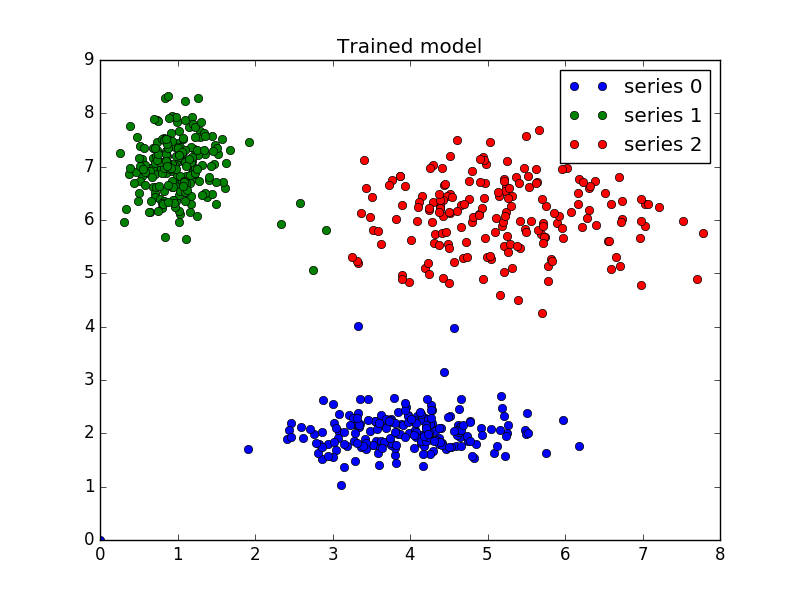
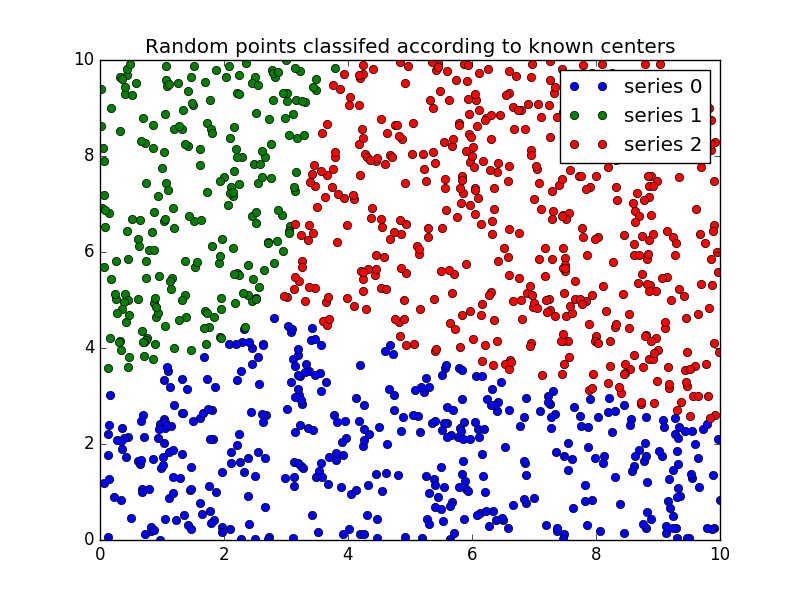
# coding: utf-8

from __future__ import division, print_function
import numpy as np
import matplotlib.pyplot as plt
import skfuzzy as fuzz

colors = ['b', 'orange', 'g', 'r', 'c', 'm', 'y', 'k', 'Brown', 'ForestGreen']
#plt.figure(1)

# Define three cluster centers
centers = [[4, 2],
           [1, 7],
           [5, 6]]

# Define three cluster sigmas in x and y, respectively
sigmas = [[0.8, 0.3],
          [0.3, 0.5],
          [1.1, 0.7]]

# Generate test data
np.random.seed(42)  # Set seed for reproducibility
xpts = np.zeros(1)
ypts = np.zeros(1)
labels = np.zeros(1)

# 伪造3个高斯分布,以u和sigma作为特征分布
for i, ((xmu, ymu), (xsigma, ysigma)) in enumerate(zip(centers, sigmas)):
    xpts = np.hstack((xpts, np.random.standard_normal(200) * xsigma + xmu))
    ypts = np.hstack((ypts, np.random.standard_normal(200) * ysigma + ymu))
    labels = np.hstack((labels, np.ones(200) * i))

# Visualize the test data
fig0, ax0 = plt.subplots()
for label in range(3):
    ax0.plot(xpts[labels == label], ypts[labels == label], '.',
             color=colors[label])
ax0.set_title('Test data: 200 points x3 clusters.')
#plt.show()

# Set up the loop and plot
alldata = np.vstack((xpts, ypts))

#print alldata

# Regenerate fuzzy model with 3 cluster centers - note that center ordering
# is random in this clustering algorithm, so the centers may change places
# 使用FCM的模型训练,注意,聚集的结果在cntr里,我的机器上运行结果为:
'''
[ 5.26724628  6.14961671]
[ 1.01594428  6.98518109]
[ 3.95895105  2.05785626]
'''
cntr, u_orig, _, _, _, _, _ = fuzz.cluster.cmeans(
    alldata, 3, 2, error=0.005, maxiter=1000)

# Show 3-cluster model
fig2, ax2 = plt.subplots()
ax2.set_title('Trained model')
for j in range(3):
    ax2.plot(alldata[0, u_orig.argmax(axis=0) == j],
             alldata[1, u_orig.argmax(axis=0) == j], 'o',
             label='series ' + str(j))

# 将聚类的中心点标记在图上
for pt in cntr:
    print (pt)
    ax2.plot(pt[0], pt[1], 's')

ax2.legend()


# Generate uniformly sampled data spread across the range [0, 10] in x and y
newdata = np.random.uniform(0, 1, (1100, 2)) * 10

# Predict new cluster membership with `cmeans_predict` as well as
# `cntr` from the 3-cluster model
u, u0, d, jm, p, fpc = fuzz.cluster.cmeans_predict(newdata.T, cntr, 2, error=0.005, maxiter=1000)

# Plot the classified uniform data. Note for visualization the maximum
# membership value has been taken at each point (i.e. these are hardened,
# not fuzzy results visualized) but the full fuzzy result is the output
# from cmeans_predict.

'''
按照行求max的index,index范围为0~2
u长成这样子:
[[ 0.54256489  0.0631068   0.00291562 ...,  0.15580619  0.17543005
   0.15652909]
 [ 0.35176643  0.02712891  0.99530463 ...,  0.2065651   0.31637093
   0.22570475]
 [ 0.10566868  0.90976429  0.00177975 ...,  0.63762871  0.50819901
   0.61776617]]
最后返回像:
[0 2 1 ..., 2 2 2]
其实,u就是聚类的概率啊,特定列的行数值求和就是1哇!
下面返回的cluster_membership 其实就是聚类的结果,0表示聚在类别0,2表示聚集在类别2,...!
补充:(np.argmax([[1,2,3],[4,1,4],[2,8,9]], axis=0)) == [1,2,2]
'''
cluster_membership = np.argmax(u, axis=0)  # Hardening for visualization


fig3, ax3 = plt.subplots()
ax3.set_title('Random points classifed according to known centers')

# 将聚类预测的三类结果绘图
for j in range(3):
    ax3.plot(newdata[cluster_membership == j, 0],
             newdata[cluster_membership == j, 1], 'o',
             label='series ' + str(j))
ax3.legend()
plt.show()
预测:
经过测试,是可以处理三维数据聚类的:
    centers = [[4, 2, 100],
           [1, 7, 200],
           [5, 6, 300]]
    sigmas = [[0.8, 0.3, 0.1],
              [0.3, 0.5, 0.2],
              [1.1, 0.7, 0.9]]
    # Generate test data
    np.random.seed(42)  # Set seed for reproducibility
    xpts = np.zeros(1)
    ypts = np.zeros(1)
    zpts = np.zeros(1)
    labels = np.zeros(1)

    print "*********************"
    for i, ((xmu, ymu, zmu), (xsigma, ysigma, zsigma)) in enumerate(zip(centers, sigmas)):
        xpts = np.hstack((xpts, np.random.standard_normal(200) * xsigma + xmu))
        ypts = np.hstack((ypts, np.random.standard_normal(200) * ysigma + ymu))
        zpts = np.hstack((zpts, np.random.standard_normal(200) * zsigma + zmu))
        labels = np.hstack((labels, np.ones(200) * i))
    alldata = np.vstack((xpts, ypts, zpts))
    cntr, u_orig, _, _, _, _, _ = fuzz.cluster.cmeans(alldata, 3, 2, error=0.005, maxiter=1000)

    print "*********************"
    for pt in cntr:
        print (pt)
    print "*********************"
结果为:
*********************
*********************
[  3.95666441   2.02029976  99.72164117]
[   5.00568412    6.05765152  300.09246382]
[   1.00252037    7.06293498  199.99320473]
*********************