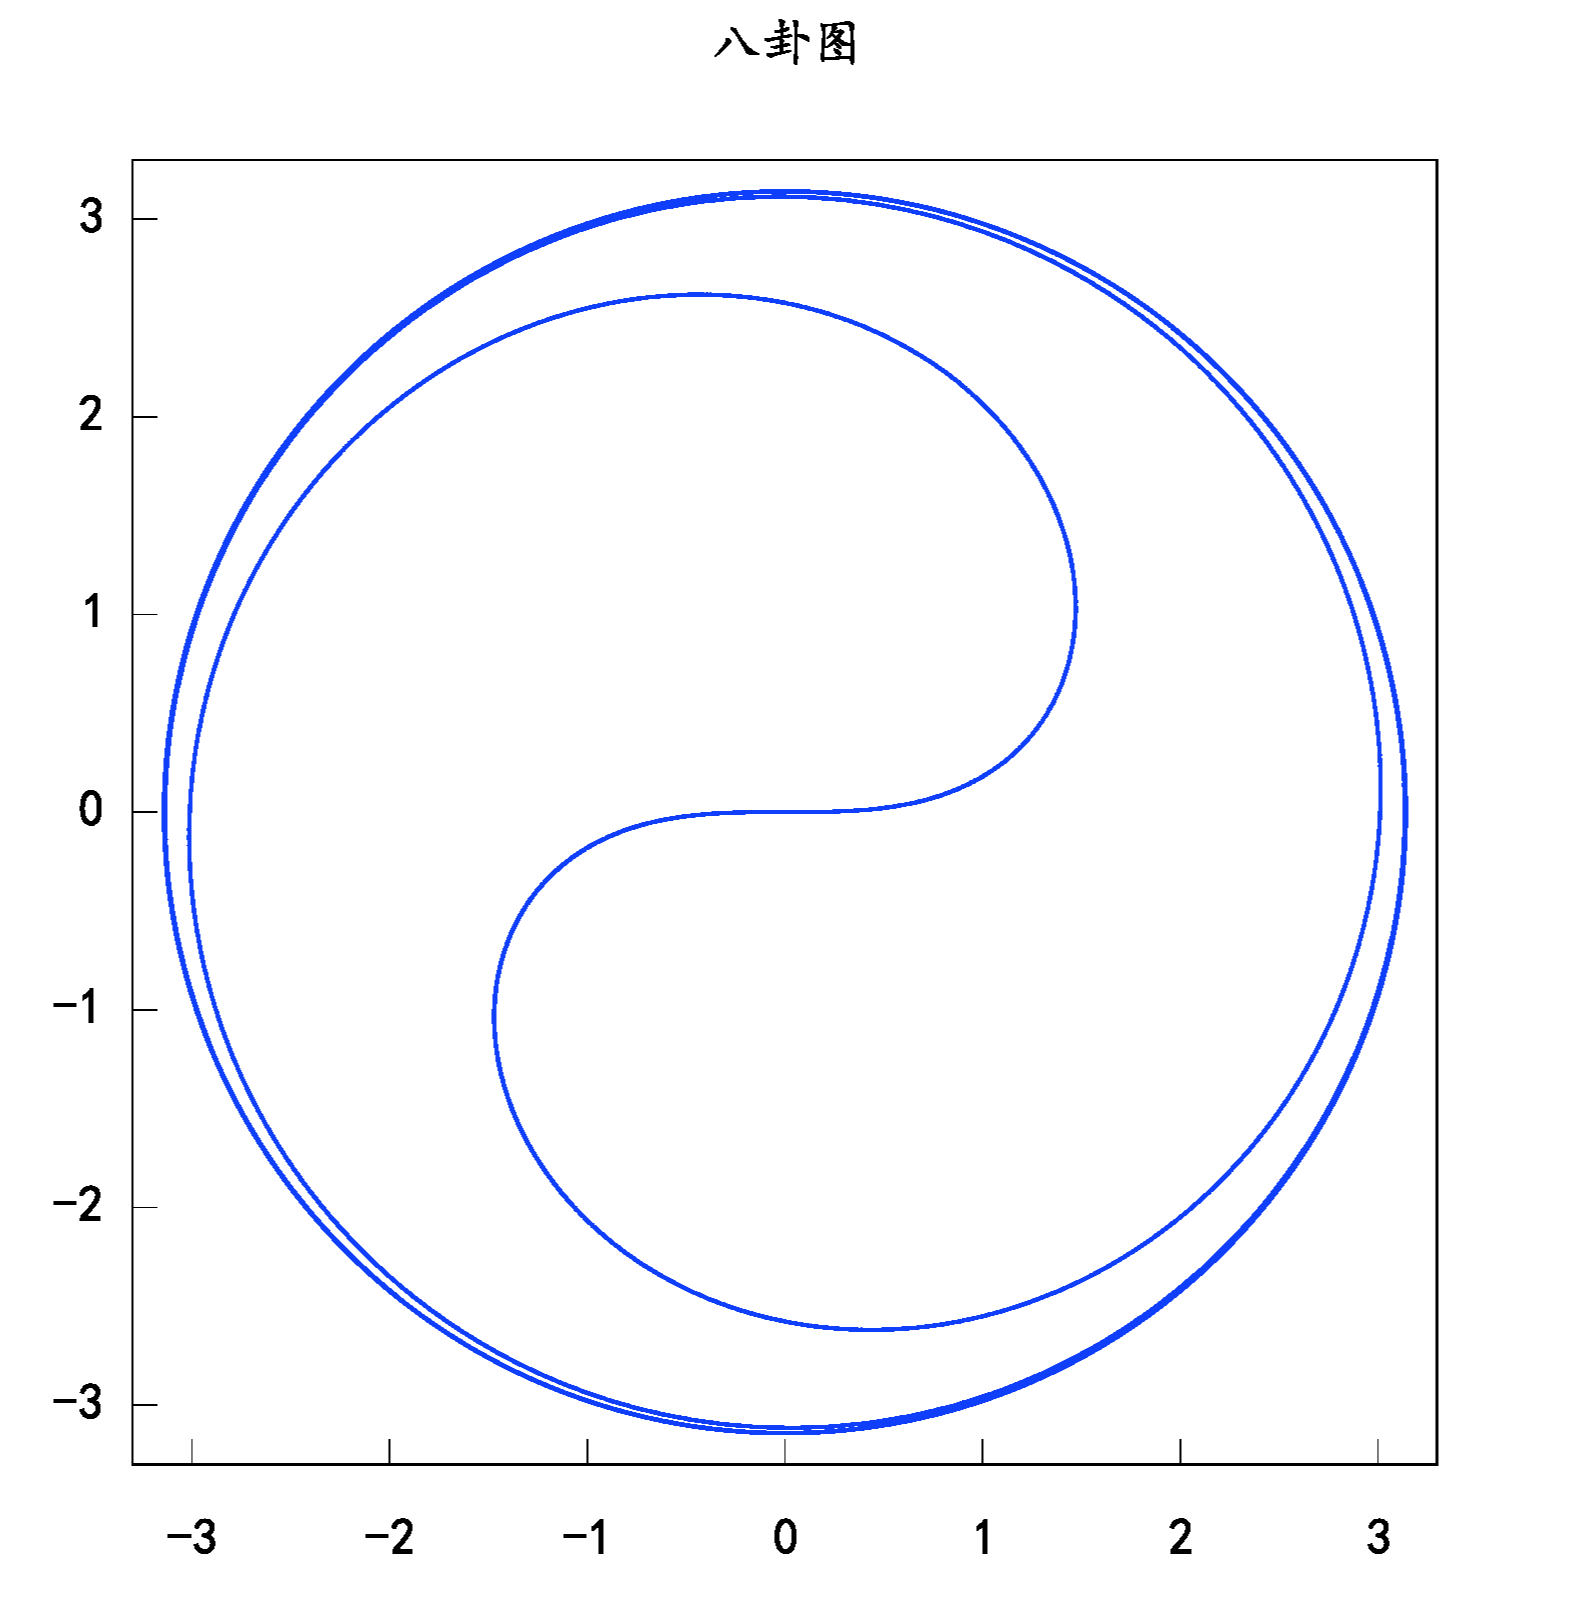
load(draw)$
draw2d(
    dimensions=[800,800], /*大小*/
    ip_grid   = [1000,1000], /*光滑一点*/
    line_width= 1.,
    terminal  = 'aquaterm,
    font      = "Kaiti", /*不同系统设置不同字体*/
    font_size = 20,
    title     = "八卦图",
    color     = blue,
    xrange = [-3.3,3.3], yrange=[-3.3,3.3],
    proportional_axes=xy,
    transform = [ρ.cos(θ), ρ.sin(θ), θ, ρ],
    implicit(sin(ρ) / ρ = %e ^ (-θ), θ,0,4*%pi, ρ,-4,4)
)$
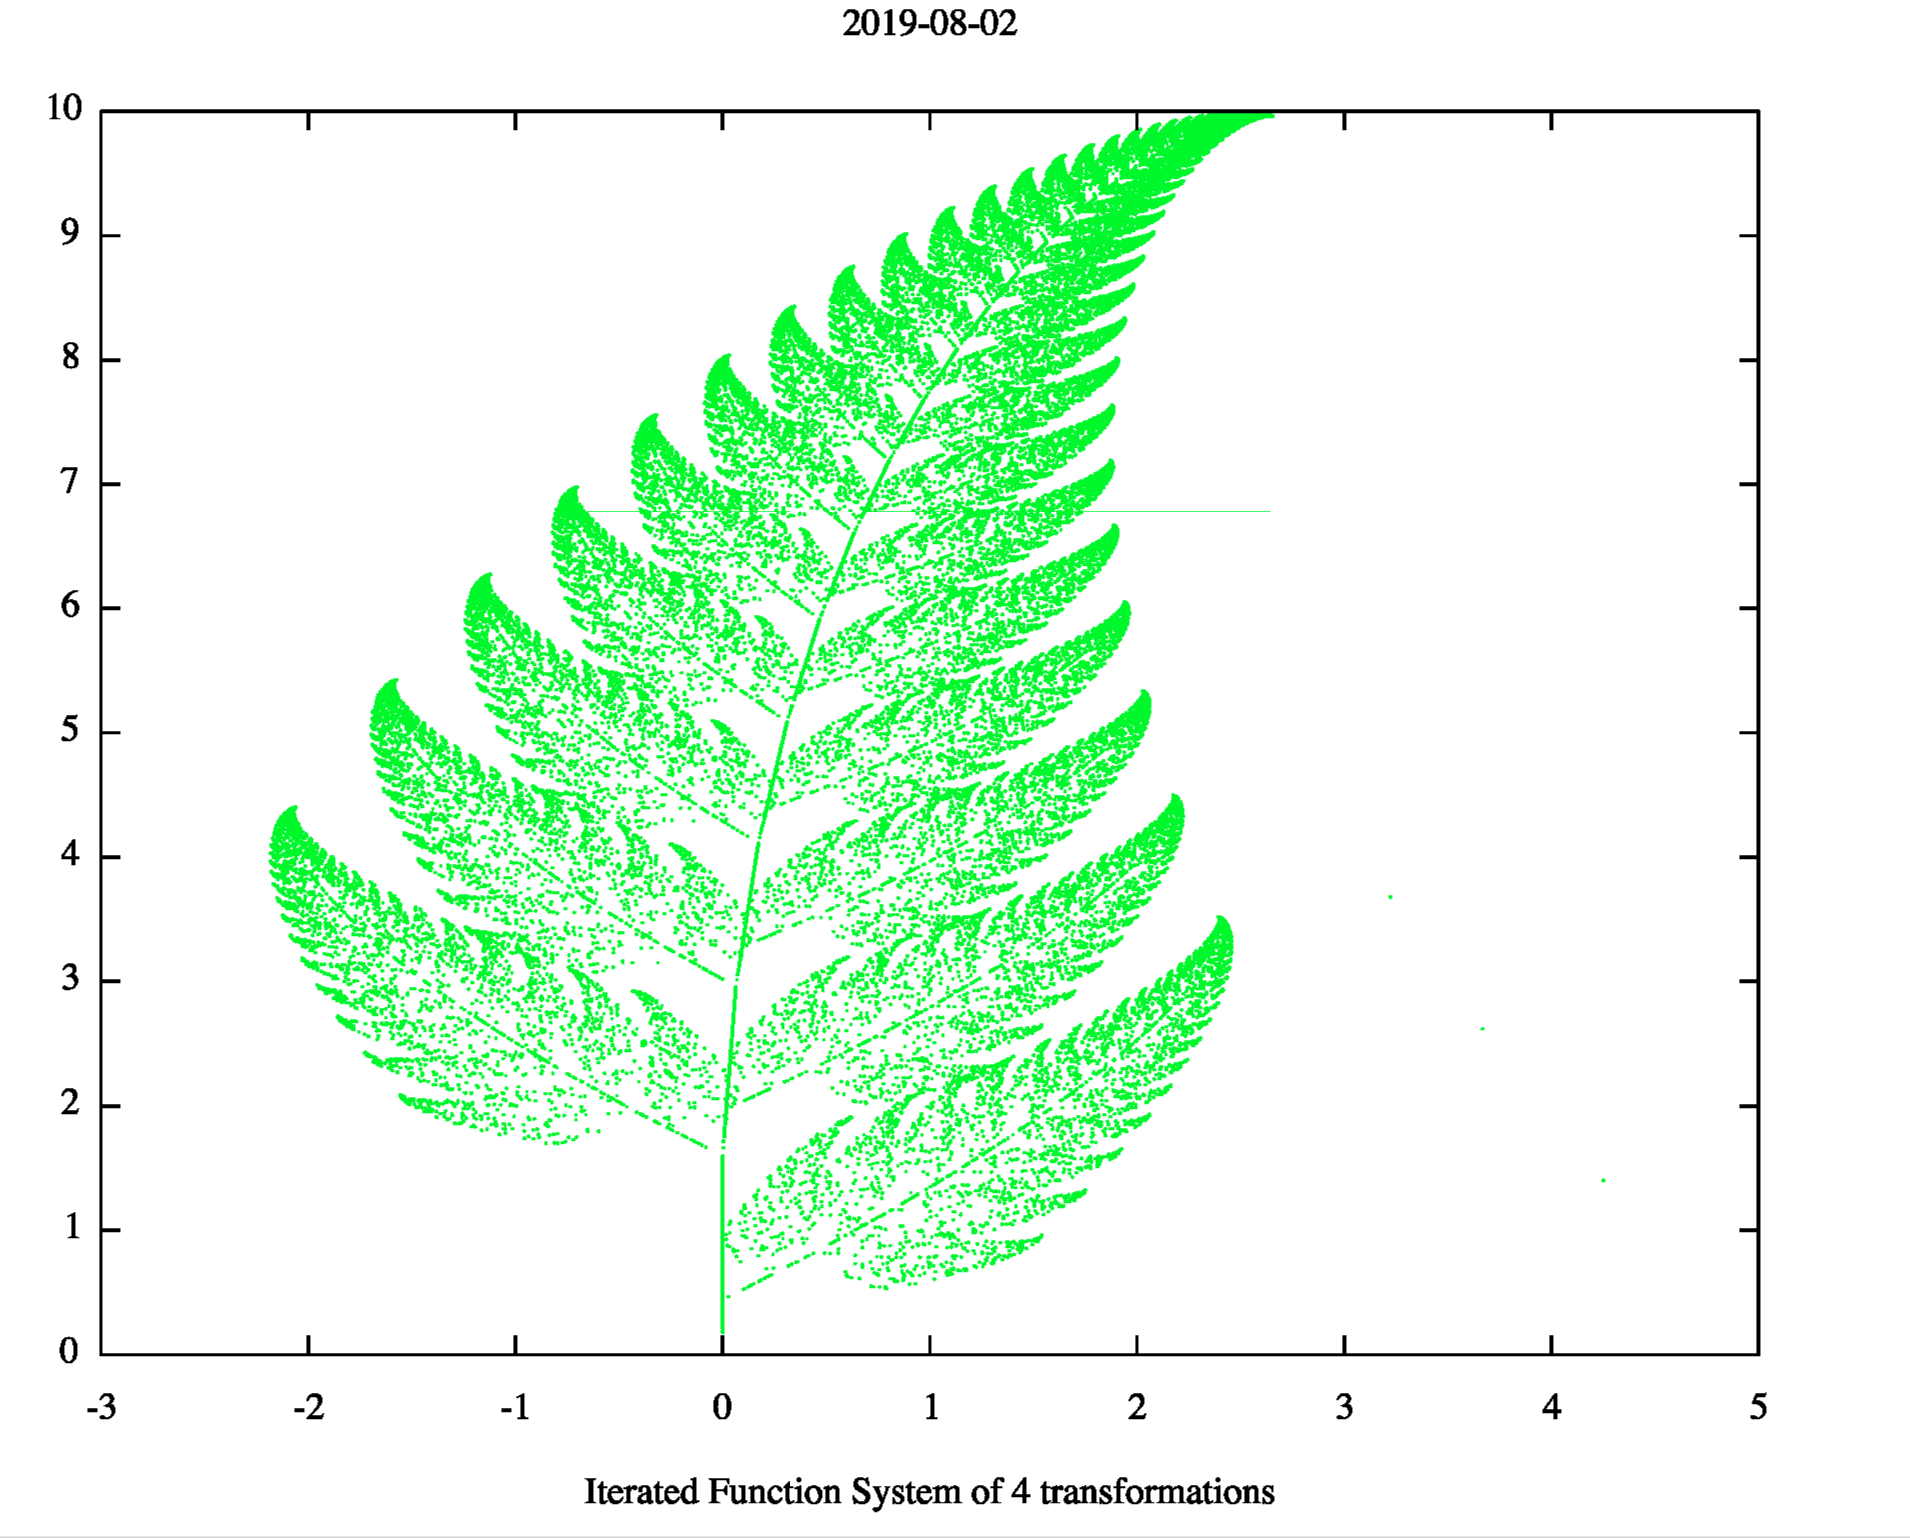
a1: matrix([0.85,0.04],[-0.04,0.85])$
a2: matrix([0.2,-0.26],[0.23,0.22])$
a3: matrix([-0.15,0.28],[0.26,0.24])$
a4: matrix([0,0],[0,0.16])$
p1: [0,1.6]$
p2: [0,1.6]$
p3: [0,0.44]$
p4: [0,0]$
w: [85,92,99,100]$
ifs(w, [a1,a2,a3,a4], [p1,p2,p3,p4], [5,0], 50000, [style,dots],
    [box, true], [axes, false], [color, green],
    [title, "2019-08-02"])$
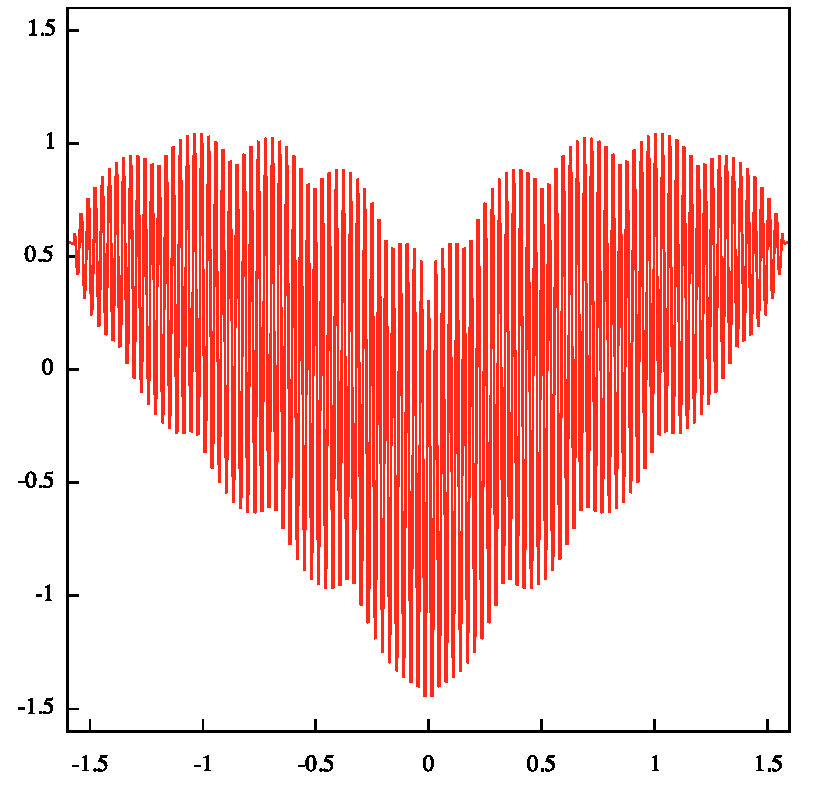
load(draw)$

f: sqrt(cos(x)) * cos(200*x) + sqrt(abs(x))$
draw2d(
    terminal = 'aquaterm,
    color = red,
    proportional_axes=xy,
    ip_grid = [500,500],
    implicit(
        (f-7/10)*(4-x*x)**(1/100)=y,
        x,-1.6,1.6,
        y,-1.6,1.6
    )
)$