CPU与GPU的关系
简单理解,CPU主要负责计算相关的,GPU主要负责页面渲染的,图形API不允许CPU与GPU直接进行通信,而是通过中间层进行连接。

一、GPU渲染分析工具
1、进入手机设置-开发者选项页面,开启
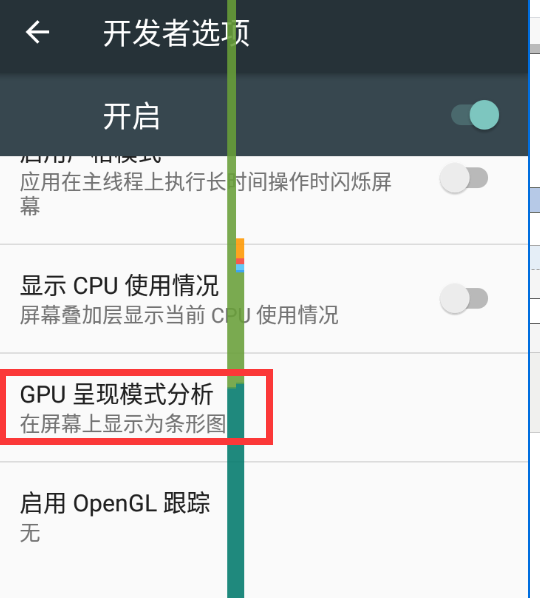
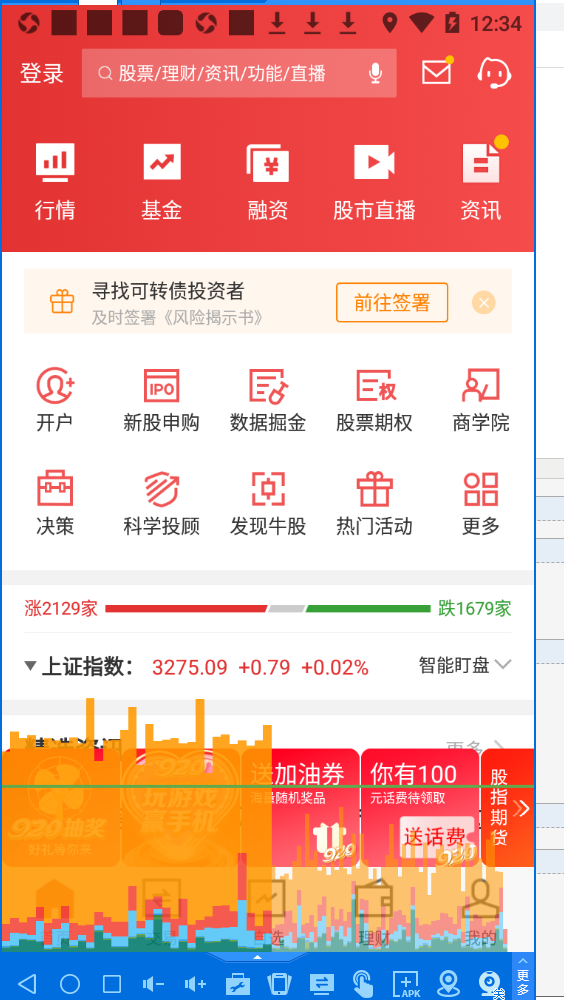
2、开启后,手机屏幕上就会显示GPU渲染情况
对于图形的解读参考:https://blog.csdn.net/Fly_li_sir/article/details/87550138
每一数条表示一帧,数条的长度表示每一帧绘制所需的时间,不同的颜色表示不同的活动内容,统计最近活动的128帧
绿色横线表示16ms的时间线,在绿线下方的标识渲染性能很好‘’
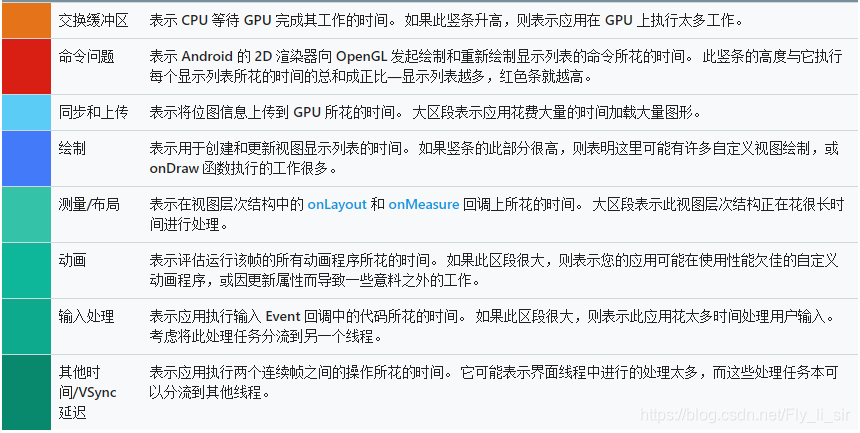
每种颜色表示的含义如下,Android6.0以后:
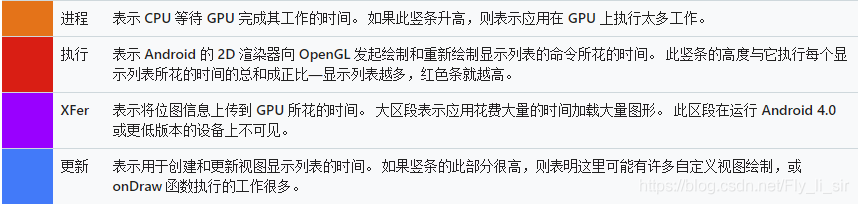
Android4.0—Android5.0:
二、内存统计
内存耗用概念解析
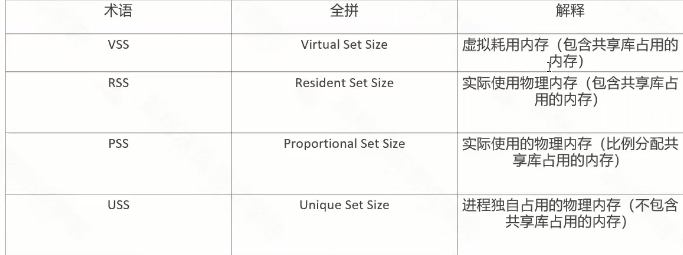
- VSS:衡量虚拟内存大小无太大用处,无法知道分配的物理内存大小
- RSS:各进程的RSS相加,会超过系统内存使用量
- PSS:各进程的PSS之和,就是系统的内存使用量
- USS:是PSS中自己的部分,不包含任何共享的部分
内存占用大小一般规律:vSS >=RSS >=PSS >=USS
1、查看3小时内的内存使用情况:adb shell dumpsys procstats --hours 3 >内存.txt
输入内容如下:
AGGREGATED OVER LAST 3 HOURS:
  #进程名称/用户/版本号
  * com.tencent.android.qqdownloader / u0a31 / v7602130:

        #状态:(minPSS-avgPSS-maxPSS/minUSS-avgUSS-maxUSS over samples)
           TOTAL: 100% (60MB-64MB-73MB/52MB-55MB-62MB over 7)

          Imp Fg: 100% (60MB-64MB-73MB/52MB-55MB-62MB over 7)

  * com.hundsun.winner.pazq:push / u0a33 / v70610:

           TOTAL: 100% (52MB-53MB-54MB/50MB-50MB-51MB over 5)

         Service: 100% (52MB-53MB-54MB/50MB-50MB-51MB over 5)

  * com.kop.zkop / 1000 / v51:

           TOTAL: 100% (4.3MB-4.9MB-5.5MB/3.4MB-4.0MB-4.6MB over 7)

      Persistent: 100% (4.3MB-4.9MB-5.5MB/3.4MB-4.0MB-4.6MB over 7)

  * com.dituhuimapmanager:live_service / u0a38 / v41:

           TOTAL: 100% (8.8MB-9.1MB-9.4MB/6.6MB-6.8MB-7.0MB over 8)

          Imp Fg: 100% (8.8MB-9.1MB-9.4MB/6.6MB-6.8MB-7.0MB over 8)

  * com.tencent.android.qqdownloader:tools / u0a31 / v7602130:

           TOTAL: 100% (22MB-24MB-25MB/18MB-20MB-21MB over 7)

          Imp Fg: 100% (22MB-24MB-25MB/18MB-20MB-21MB over 7)

  * com.tencent.android.qqdownloader:cloud / u0a31 / v7602130:

           TOTAL: 100% (18MB-18MB-19MB/15MB-15MB-16MB over 7)

          Imp Fg: 100% (18MB-18MB-19MB/15MB-15MB-16MB over 7)

  * com.dituhuimapmanager:music_service / u0a38 / v41:

           TOTAL: 100% (8.7MB-9.0MB-9.2MB/6.4MB-6.7MB-6.9MB over 5)

         Service: 100% (8.7MB-9.0MB-9.2MB/6.4MB-6.7MB-6.9MB over 5)

  * system / 1000 / v23:

           TOTAL: 100% (65MB-72MB-81MB/59MB-67MB-76MB over 8)

      Persistent: 100% (65MB-72MB-81MB/59MB-67MB-76MB over 8)

  * com.tencent.android.qqdownloader:daemon / u0a31 / v7602130:

           TOTAL: 100% (58MB-63MB-67MB/50MB-54MB-58MB over 7)

          Imp Fg: 100% (58MB-63MB-67MB/50MB-54MB-58MB over 7)

  * com.android.phone / 1001 / v23:

           TOTAL: 100% (12MB-12MB-12MB/9.8MB-10MB-10MB over 7)

      Persistent: 100% (12MB-12MB-12MB/9.8MB-10MB-10MB over 7)

  * com.dituhuimapmanager / u0a38 / v41:

           TOTAL: 100% (154MB-176MB-182MB/145MB-168MB-174MB over 32)

             Top: 49% (177MB-179MB-182MB/168MB-171MB-174MB over 28)

          Imp Fg: 51% (154MB-155MB-156MB/145MB-146MB-147MB over 4)

  * com.android.smspush / u0a29 / v23:

           TOTAL: 100% (3.0MB-3.1MB-3.1MB/2.3MB-2.3MB-2.4MB over 7)

          Imp Fg: 100% (3.0MB-3.1MB-3.1MB/2.3MB-2.3MB-2.4MB over 7)

  * com.dituhuimapmanager:monitor / u0a38 / v41:

           TOTAL: 100% (15MB-15MB-15MB/10MB-11MB-11MB over 8)

          Imp Fg: 100% (15MB-15MB-15MB/10MB-11MB-11MB over 8)

  * com.cn.setip / 1000 / v1:

           TOTAL: 100% (3.6MB-3.7MB-3.8MB/2.6MB-2.8MB-2.9MB over 5)

         Service: 100% (3.6MB-3.7MB-3.8MB/2.6MB-2.8MB-2.9MB over 5)

  * com.tencent.android.qqdownloader:connect / u0a31 / v7602130:

           TOTAL: 100% (21MB-22MB-23MB/17MB-18MB-19MB over 7)

          Imp Fg: 100% (21MB-22MB-23MB/17MB-18MB-19MB over 7)

  * com.dituhuimapmanager:pushcore / u0a38 / v41:

           TOTAL: 100% (17MB-17MB-19MB/13MB-14MB-16MB over 32)

             Top: 49% (17MB-17MB-18MB/14MB-14MB-14MB over 28)

          Imp Fg: 51% (17MB-18MB-19MB/13MB-15MB-16MB over 4)

  * com.tiantian.ime / u0a13 / v3:

           TOTAL: 100% (7.2MB-9.0MB-10MB/6.0MB-7.7MB-9.1MB over 7)

          Imp Bg: 100% (7.2MB-9.0MB-10MB/6.0MB-7.7MB-9.1MB over 7)

  * com.android.systemui / u0a11 / v23:

           TOTAL: 100% (43MB-53MB-61MB/38MB-48MB-55MB over 7)

      Persistent: 100% (43MB-53MB-61MB/38MB-48MB-55MB over 7)

  * com.tencent.android.qqdownloader:live / u0a31 / v7602130:

           TOTAL: 100% (11MB-11MB-11MB/8.6MB-8.6MB-8.6MB over 1)

         Service: 95% (11MB-11MB-11MB/8.6MB-8.6MB-8.6MB over 1)

      Service Rs: 4.7%

  * com.android.launcher / u0a12 / v11:

           TOTAL: 86% (21MB-21MB-21MB/17MB-18MB-18MB over 49)

             Top: 86% (21MB-21MB-21MB/17MB-18MB-18MB over 49)

          (Home): 14% (20MB-20MB-20MB/17MB-17MB-17MB over 1)

  * com.hundsun.winner.pazq / u0a33 / v70610:

           TOTAL: 63% (162MB-219MB-231MB/154MB-211MB-223MB over 13)

             Top: 14% (162MB-212MB-226MB/154MB-204MB-217MB over 8)

          Imp Fg: 49% (228MB-229MB-231MB/220MB-221MB-223MB over 5)

        Receiver: 0.16%

        (Cached): 37% (73MB-74MB-74MB/69MB-70MB-70MB over 5)

  * com.hundsun.winner.pazq:pgmini1 / u0a33 / v70610:

           TOTAL: 0.01%

        Receiver: 0.01%

        (Cached): 62% (49MB-50MB-50MB/48MB-48MB-48MB over 2)

  * android.process.media / u0a3 / v23:

        (Cached): 100% (7.8MB-7.8MB-7.9MB/6.3MB-6.3MB-6.4MB over 3)

  * com.thirdparty.superuser / u0a28 / v1026:

        (Cached): 100% (3.5MB-3.5MB-3.6MB/2.6MB-2.6MB-2.7MB over 3)

  * android.process.acore / u0a1 / v23:

        (Cached): 100% (7.4MB-7.5MB-7.5MB/6.1MB-6.1MB-6.2MB over 3)

  * com.android.gallery3d / u0a22 / v40030:

        (Cached): 49% (5.0MB-5.0MB-5.0MB/4.2MB-4.2MB-4.2MB over 1)

  * io.appium.settings / u0a42 / v26:

        (Cached): 51% (7.0MB-7.0MB-7.1MB/5.1MB-5.1MB-5.1MB over 2)

  * com.android.externalstorage / u0a4 / v23:

        (Cached): 100% (3.0MB-3.1MB-3.1MB/2.2MB-2.3MB-2.3MB over 3)

  * com.android.keychain / 1000 / v23:

        (Cached): 100% (2.9MB-3.0MB-3.1MB/2.1MB-2.2MB-2.3MB over 3)

  * com.android.settings / 1000 / v23:

      (Last Act): 49% (23MB-23MB-23MB/18MB-18MB-18MB over 2)

        (Cached): 51% (4.1MB-4.4MB-4.8MB/2.7MB-3.3MB-4.0MB over 2)


Run time Stats:

  SOn /Mod : +1h57m40s905ms

      TOTAL: +1h57m40s905ms


Memory usage:

  Persist: 143MB (29 samples)

  Top    : 143MB (113 samples)

  ImpFg  : 419MB (72 samples)

  ImpBg  : 9.0MB (11 samples)

  Service: 76MB (24 samples)

  Receivr: 124KB (59 samples)

  Home   : 2.8MB (1 samples)

  LastAct: 11MB (2 samples)

  CchEmty: 92MB (27 samples)

  TOTAL  : 895MB

  ServRst: 516KB (1 samples)


          Start time: 2020-09-23 09:28:00

  Total elapsed time: +1h57m40s905ms (partial) libart.so
结果中的字段解释:
- 百分比:表示在总的时间内,进程在各种状态下的消耗:例如,100%,就指在这段时间内,这个进程是一直处于运行当中的
- TOTAL:表示了进程的综合占用情况
- Imp Fg:加载到前台
- Service:标识了是否是服务
- Persistent:标识了是否一直驻留在内存当中,与Service一样,表示内存进驻的级别。
- Top:标识了是否是顶层进程
- Receiver:标识了是否是广播进程。
2、查看指定应用的内存信息
adb shell dumpsys meminfo 包名(也可以不加包名)
3、网络分析
显示网络流量:adb shell dumpsys netstats,模拟器会报错,要用真机
查找应用的userID:adb shell dumpsys package com.hundsun.winner.pazq | findstr userId
通过userId过滤app流量使用情况:adb shell dumpsys netstats | findstr userId