一、Highcharts series属性
1、下面是一个基本曲线图的例子:
<html>
<head>
<meta charset="UTF-8" />
<title>Highcharts 曲线图</title>
<script src="http://apps.bdimg.com/libs/jquery/2.1.4/jquery.min.js"></script>
<script src="http://code.highcharts.com/highcharts.js"></script>
</head>
<body>
<div id="container" style=" 550px; height: 400px; margin: 0 auto"></div>
<script language="JavaScript">
$(document).ready(function() {
   var title = {
      text: '城市平均气温'
   };
   var subtitle = {
      text: ''
   };
   var xAxis = {
      categories: ['Jan', 'Feb', 'Mar', 'Apr', 'May', 'Jun',
         'Jul', 'Aug', 'Sep', 'Oct', 'Nov', 'Dec']
   };
   var yAxis = {
      title: {
         text: 'Temperature (xB0C)'
      },
      plotLines: [{
         value: 0,
          1,
         color: '#808080'
      }]
   };

   var tooltip = {
      valueSuffix: 'xB0C'
   }

   var legend = {
      layout: 'vertical',
      align: 'right',
      verticalAlign: 'middle',
      borderWidth: 0
   };

   var series =  [
      {
         name: 'Tokyo',
         data: [7.0, 6.9, 9.5, 14.5, 18.2, 21.5, 25.2,
            26.5, 23.3, 18.3, 13.9, 9.6]
      },
      {
         name: 'New York',
         data: [-0.2, 0.8, 5.7, 11.3, 17.0, 22.0, 24.8,
            24.1, 20.1, 14.1, 8.6, 2.5]
      },
      {
         name: 'London',
         data: [3.9, 4.2, 5.7, 8.5, 11.9, 15.2, 17.0,
            16.6, 14.2, 10.3, 6.6, 4.8]
      }
   ];

   var json = {};

   json.title = title;
   json.subtitle = subtitle;
   json.xAxis = xAxis;
   json.yAxis = yAxis;
   json.tooltip = tooltip;
   json.legend = legend;
   json.series = series;

   $('#container').highcharts(json);
});
</script>
</body>
</html>
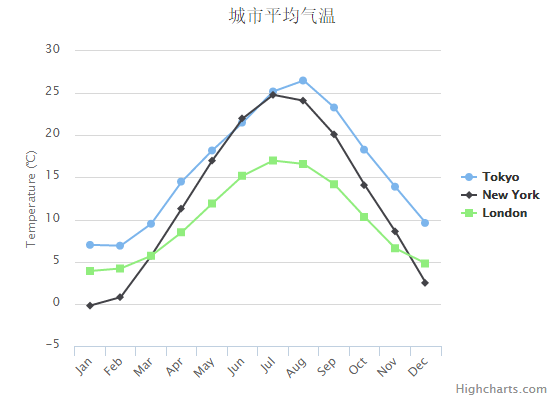
例中有highcharts的常用属性,主要是series数据列。series用于设置图表中要展示的数据相关的属性,参数如下:
| 参数 | 描述 | 默认值 |
| data |
显示在图表中的数据列,可以为数组或者JSON格式的数据。 如:data:[0, 5, 3, 5],或 data: [{name: 'Point 1',y: 0}, {name: 'Point 2',y: 5}] |
'' |
| name | 显示数据列的名称 | '' |
| type | 数据列类型,支持 area, areaspline, bar, column, line, pie, scatter or spline | line |
二、Highcharts基本设置
2.1 在一个图像中有多条曲线,但是默认想只显示第一条曲线,则需要做如下设置:
chart: {
            renderTo: 'container1',
            type: 'line',
            events: {
                load: function (event) {
                    for (var i = this.series.length - 1; i > 0; i--) {
                        this.series[i].hide();        //设置只显示第一条线,其他都不显示
                    }
                }
            }
        }
2.2 去掉highcharts网站url
右下角默认会有一个其网站url存在,这会影响美观,做如下设置即可去掉:
credits: {
            enabled: false     //不显示LOGO
        }
或者 在 highcharts.js 中 Ctrl+F 搜索 credits属性,设置 enabled: false
2.3 动态增加曲线数量
在显示曲线后动态增加显示曲线条数:
var chart = new Highcharts.Chart(options);
chart.addSeries({
            name: '合计',
            data: [61, 63, 65, 67, 69, 71, 73, 70, 67, 64, 61, 57]
        });
或

chart.addSeries({ name: 'DataURL serie', dataURL: 'serie3.txt' });
2.4 动态删除曲线
chart.series[0].remove();
三、Highcharts 点击
$(function () {
    // create the chart
    $('#container').highcharts({
        chart: {
            events: {
                addSeries: function() {
                    var label = this.renderer.label('A series was added, about to redraw chart', 100, 120)
                        .attr({
                            fill: Highcharts.getOptions().colors[0],
                            padding: 10,
                            r: 5,
                            zIndex: 8
                        })
                        .css({
                            color: '#FFFFFF'
                        })
                        .add();

                    setTimeout(function () {
                        label.fadeOut();
                    }, 1000);
                }
            }
        },

        xAxis: {
            categories: ['Jan', 'Feb', 'Mar', 'Apr', 'May', 'Jun', 'Jul', 'Aug', 'Sep', 'Oct', 'Nov', 'Dec']
        },

        series: [{
            data: [29.9, 71.5, 106.4, 129.2, 144.0, 176.0, 135.6, 148.5, 216.4, 194.1, 95.6, 54.4]
        }]
    });


    // activate the button
    $('#button').click(function() {
        var chart = $('#container').highcharts();

        chart.addSeries({
            data: [216.4, 194.1, 95.6, 54.4, 29.9, 71.5, 106.4, 129.2, 144.0, 176.0, 135.6, 148.5]
        });

        $(this).attr('disabled', true);
    });
});
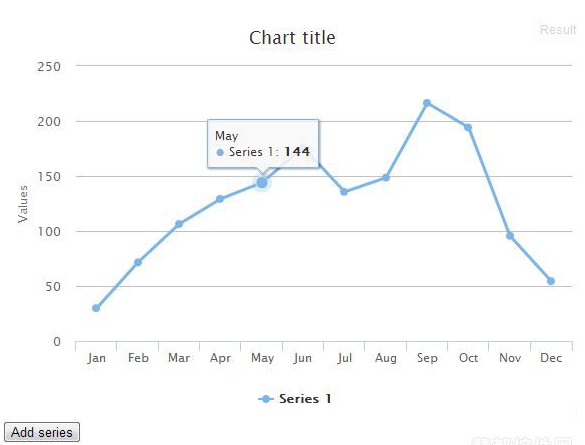
效果图:

四、图表数据动态更新
在实际使用highcharts时,数据不是手写的,经常是动态赋值data。
4.1 随机数据点
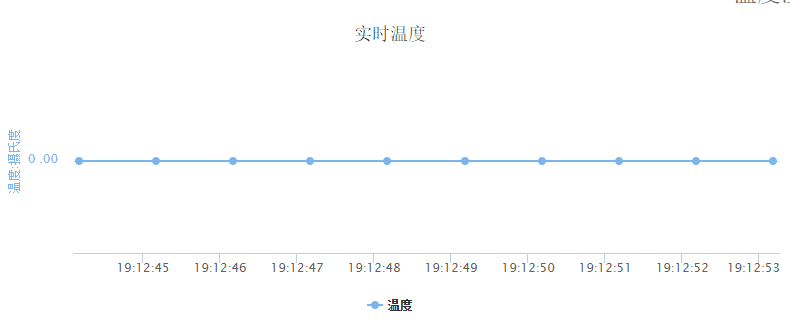
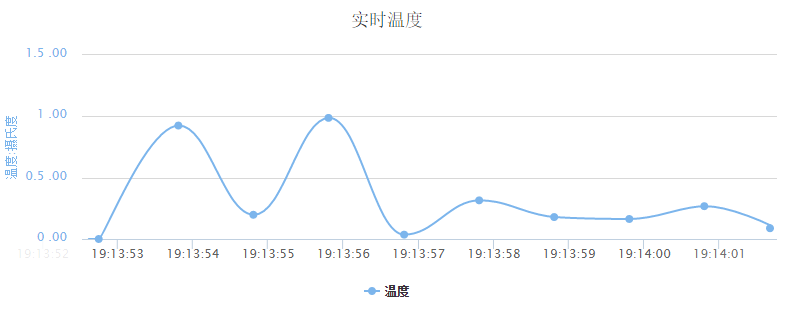
chart.events属性中添加 load 方法(图表加载事件),每秒(1000ms)随机产生数据点并生成图表。
<script>
   Highcharts.setOptions({ global: { useUTC: false } });
   var chart11 = new Highcharts.Chart({
       chart: {
           renderTo: 'container11',
           type: 'spline',
           events: {
               load: function () {
                    var series = this.series[0];
                    setInterval(function () {
                      var x = (new Date()).getTime(), // current time
                          y = Math.random();
                     series.addPoint([x, y], true, true);
                     }, 1000);
                }
             }
      },
     title: {
         text: '实时温度'
     },
     subtitle: {
         text: " "
     },
     xAxis: {
        type: 'datetime',
        dateTimeLabelFormats: {
                   day: '%H : %M'
             }
     },
     yAxis: {
        labels: {
           ormat: '{value} .00',
           style: {
           color: Highcharts.getOptions().colors[0]
           }
         },
     title: {
        text: '温度:摄氏度',
        style: {
            color: Highcharts.getOptions().colors[0]
           }
         },
     startOnTick: true, //为true时,设置min才有效
     min: 0,
     plotLines: [{
            value: 0,
             1,
            color: 'black'
          }]
     },
     tooltip: {
          formatter: function () {
                return '<b>' + this.series.name + '</b><br/>' + Highcharts.dateFormat('%Y-%m-%d %H:%M:%S', this.x) + '<br/>' + '<span style="color:#08c">' + Highcharts.numberFormat(this.y, 2) + ' 摄氏度' + '</span>';
              }
     },
     legend: {
          enabled: true
     },
     exporting: {
          enabled: false
     },
     series: [{
          type: 'spline',
          name: '温度',
          data: (function () {
                    var data = [],  time = (new Date()).getTime(),  i;
         //  图表初始的时候显示10个数据点(都是0)
                    for (i = -9; i <= 0; i++) {      // time是当前时间,故显示的10个数据点的x轴时间是当前时间之前的,故 i 为负
                        data.push({
                            x: time + i * 1000,
                            y: 0
                          });
                        }
                   return data;
          })()
     }]

  });

</script>
4.2 在原有数据的基础上改变数据
向HighChart中添加data series,方法:chart.addseries({},trur/false); true:重绘 false:不重绘
eg: 添加name为gloomyfish的数据列。
chart.addSeries({
id:1,
name:"gloomyfish",
data:[1,2,3]
},true);
下面是使用时的例子:
<script>
    Highcharts.setOptions({ global: { useUTC: false } });
    var chart21 = new Highcharts.Chart({
        chart: {
            renderTo: 'container21',
            type: 'spline',
            marginRight: 10
        },
        title: {
            text: '历史温度'
        },
        subtitle: {
            text: " "
        },
        credits: {
            enabled: false
        },
        xAxis: {
            type: 'linear'
        },
        yAxis: {
            title: {
                text: '摄氏度'
            },
            startOnTick: true,   //为true时,设置min才有效
            min: 0,
            plotLines: [{
                value: 0,
                 1,
                color: '#808080'
            }]
        },
        legend: {
            enabled: true
        },
        exporting: {
            enabled: false
        },
        series: [{
            name:"11",
            data:[1,2,3,4,5,6,7]
        }]

    });

    var yVal=[1,2,3,4,5,6,7];
    setInterval(function(){

        chart21.addSeries({        //添加数据列
            name:"历史温度",
            data:yVal
        },true);

    },1000);


</script>
效果:
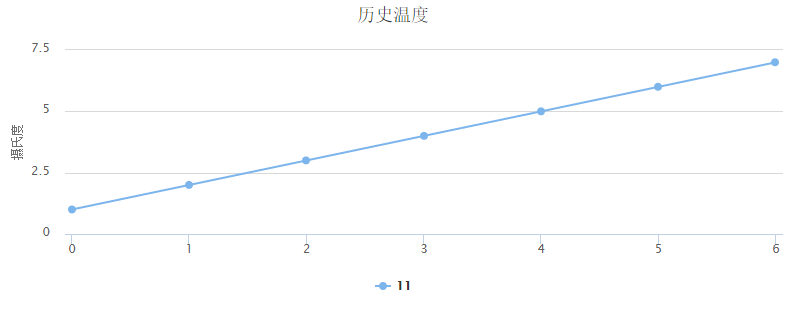

可以发现,上一秒添加的数据还是存在,在查阅资料后发现,要使用 remove() 方法来移除上一秒添加的数据:
var yVal=[1,2,3,4,5,6,7];
    setInterval(function(){

        chart21.addSeries({        //添加数据列
            name:"历史温度",
            data:yVal
        },true);

        chart21.series[0].remove();   //移除
},1000);
这样修改后的效果:
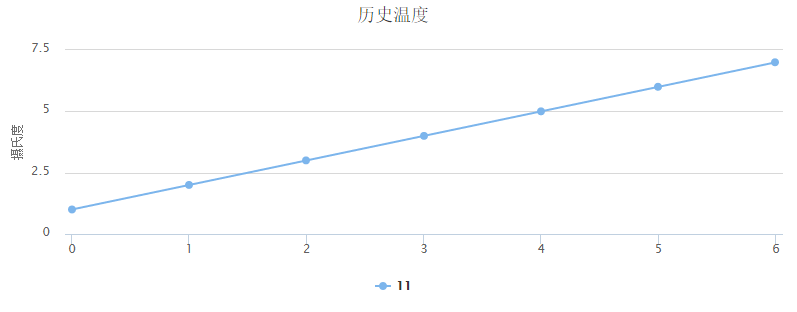


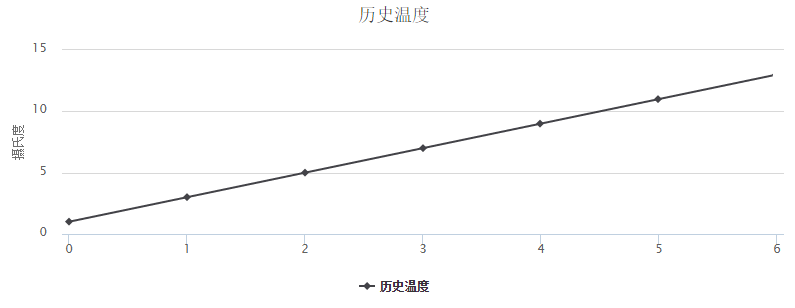
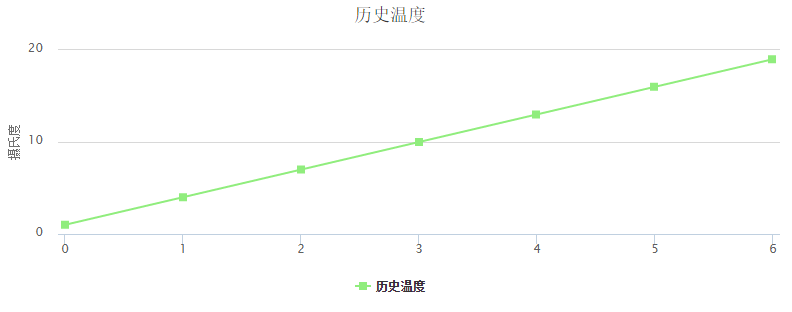
上面是每秒添加固定的数据[1,2,3,4,5,6,7],现在稍作修改,每秒添加变化的数据,如下所示, yVal[i]=yVal[i]+i; 每次添加数据时数组数据改变
var yVal=[1,2,3,4,5,6,7];
    setInterval(function(){

        for(var i =0;i<7;i++){     // 数组有7个元素
            yVal[i]=yVal[i]+i;
        }

        chart21.addSeries({        //添加数据列
            name:"历史温度",
            data:yVal
        },true);

        chart21.series[0].remove();   //移除

    },1000);
图1是原始数据[1,2,3,4,5,6,7],图2是i=0时[1,3,5,7,9,11,13] ,图3是i=1时[1,4,7,10,13,16,19] .......

然后,在这里,我发现如果不把前面的数据移除,所得的图还是挺好看的,呵呵

4.3 异步动态读取数据
way1:使用Jquery的Ajax方式,调用后台获得数据,然后进行绑定的。
(1)在脚本函数里面,初始化一个chart对象,并把series数据data设置为空:
series: [{
                    type: 'pie',
                    name: '人员数量',
                    data: []
                }]
(2)通过Ajax调用后台连接获得数据,然后绑定到具体的属性上
 //通过Ajax获取图表1数据
            $.ajaxSettings.async = false;
            var data1 = [];
            $.getJSON("/User/GetCompanyUserCountJson", function (dict) {
                for (var key in dict) {
                    if (dict.hasOwnProperty(key)) {
                        data1.push([key, dict[key]]);
                    }
                };
                chart1.series[0].setData(data1);
            });
(3)页面上写个div,设置id="container1"来放置图表
<div id="container1" style="height: 300px;max-500px"></div>
way2:简例(Highcharts之动态刷新——结合后台数据)
$(function(){
    $(document).ready(function() {
      Highcharts.setOptions({
        global: {
          useUTC: false//是否使用世界标准时间
        }
      });
      var chart;
      chart = new Highcharts.Chart({
        chart: {
          renderTo: 'container',
          type: 'spline',
          marginRight: 10,
          events: {
            load: function() {
               var series = this.series;
               setInterval(function() {
                 var result = reload();
                 var x = result.time;
                 for(var i=0; i<series.length; i++) {
                   var y = result.y[i];
                   series[i].addPoint([x, y], true, true);
                 }
               }, 1000*5);
            }
          }
        },
        title: {
          text: 'ssssss'
        },
        xAxis: {
          type: 'datetime',
          tickPixelInterval: 150
        },
        yAxis: {
          title: {
            text: 'Value'
          },
          plotLines: [{
            value: 0,
             1,
            color: '#808080'
          }]
        },
        tooltip: {
          formatter: function () {
            return '<b>' + this.series.name + '</b><br/>' +
        Highcharts.dateFormat('%Y-%m-%d %H:%M:%S', this.x) + '<br/>' +
        Highcharts.numberFormat(this.y, 2);
          }
        },
        //图例属性
        legend: {
          layout: 'vertical',
          align: 'right',
          verticalAlign: 'top',
          borderWidth: 0
      },
        exporting: {
          enabled: false
        },
        series: create()     //series属性是一个js函数的返回值,需用“js函数名()”来取得
      });
    });
function create() {
    var series = new Array();

    $.ajax({
      type: "POST",
      url: "xxxx/yyyyy.json",
      async: false,   //表示同步,如果要得到ajax处理完后台数据后的返回值,最好这样设置
      success: function(result){
        var channels = result.key;
        var size = channels.length;
        for(var i=0; i<size; i++) {
          var name = channels[i].yyyy;
          var perTotalCnt = channels[i].xxxx;
          var data = function() {
            var data = [],
              time = result.time,
              i;
            for(i=-6; i<=0; i++) {
              data.push({
                x: aaaa,
                y: zzzz
              });
            }

            return data;
          }();
          series.push({"name": name, "data": data});
        }
      }
    }, false);  //false表示“遮罩”,前台不显示“请稍后”进度提示
    alert(series);
        return series;

  }
});
way3:简例(异步动态读取数据)
$(function () {
   var chart_validatestatics;
   $(document).ready(function () {
    var options_validatestatics = {
     chart: {
      renderTo: 'container_validatestatics',
      type: 'column'
     },
     title: {
      text: '验票分析'
     },
     subtitle: {
      text: 'tourol.cn'
     },
     xAxis: {
    },
    yAxis: {
     title: {
      text: '人数'
     }
    },
    plotOptions: {
     bar: {
      dataLabels: {
       enabled: true
      }
     }
    },
    tooltip: {
     formatter: function () {
      return '<b>' + this.x + '</b><br/>' + this.series.name + ': ' + this.y + '人';
     }
    },
    credits: {
     enabled: false
    },
    series: [{
     name: "验票用户",
      3
    }]
   }
   $.get("/ajaxhandler/dataupdate.ashx?operate_type=validatestatics", function (data) {
    var xatrnames = [];
    var yvalidators = [];
    for (var i = 0; i < data.rows.length; i++) {
     xatrnames.push([
       data.rows[i].atrname
      ]);
     yvalidators.push([
       data.rows[i].atrname,
       parseInt(data.rows[i].nums)
      ]);
    }
    alert(xatrnames + yvalidators);
    options_validatestatics.xAxis.categories = xatrnames
    options_validatestatics.series[0].data = yvalidators;
    chart_validatestatics = new Highcharts.Chart(options_validatestatics);
   });
  });
 });
要注意的是:x轴数组定义好后,定义y轴数据的时候要把对应在x轴上的值也push到数组里,不然会无法显示。
对应的在ajax handler中,拼接字符串并返回即可:
string json = "{"rows":[";
  for (int i = 0; i < datas.Rows.Count; i++)
  {
   json += "{"atrname":"" + datas.Rows[i]["name"] + "","nums":"" + datas.Rows[i]["nums"] + ""},";
  }
  json = json.TrimEnd(',');
  json += "]}";
  context.Response.Write(json);
  context.Response.Flush();
  context.Response.End();
4.4 同步获取数据
使用 Websocket 与服务器建立 TCP 连接之后,会一直连接,浏览器和服务器直接可以数据相互传送。
在应用 Websocket 之前,我们可以先结合前面的动态随机数据想想,如果把数据点的Y值换成了从服务器接收的数据就可以画出接收的数据。
<script>
    Highcharts.setOptions({ global: { useUTC: false } });
    var chart21 = new Highcharts.Chart({
        chart: {
            renderTo: 'container21',
            type: 'spline'
        },
        title: {
            text: '历史温度'
        },
        subtitle: {
            text: " "
        },
        credits: {
            enabled: false
        },
        xAxis: {
            type: 'datetime',
            dateTimeLabelFormats: {
                day: '%H : %M'
            }
        },
        yAxis: {
            labels: {
                format: '{value} .00',
                style: {
                    color: Highcharts.getOptions().colors[0]
                }
            },
            title: {
                text: '温度:摄氏度',
                style: {
                    color: Highcharts.getOptions().colors[0]
                }
            },
            startOnTick: true,   //为true时,设置min才有效
            min: 0,
            plotLines: [{
                value: 0,
                 1,
                color: '#808080'
            }]
        },
        tooltip: {
            formatter: function () {
                return '<b>' + this.series.name + '</b><br/>' +
                        Highcharts.dateFormat('%Y-%m-%d %H:%M:%S', this.x) + '<br/>' + '<span style="color:#08c">' +
                        Highcharts.numberFormat(this.y, 2) + ' 摄氏度' + '</span>';
            },
            crosshairs: true
        },
        legend: {
            enabled: true
        },
        exporting: {
            enabled: false
        },
        series: [{
            type: 'spline',
            name: '实时温度',
            //data: [0,0]
            data: (function () {
                var data = [],
                        time = (new Date()).getTime(),
                        i;

                for (i = -9; i <= 0; i++) {
                    data.push({
                        //x: time + i * 1000,
                        x: time,
                        y: 0
                    });
                }
                return data;
            })()

        }]

    });

    setInterval(function(){
        var x;
        var y;
        x = (new Date()).getTime();     // 当前时间
        y = Math.random();
        chart21.series[0].addPoint([x, y], true, true);     //追加点并去掉一个点         //chart1.series[0].addPoint([x, y]);追加点( 不去掉点 )
    },1000);

</script>
改写setInterval()函数,把Y值替换成val
由于下面的代码是直接从做过的项目中copy过来的,看的时候有的地方出现的有点突兀,不用理会,只看y值的改变就好了。
 function myChart(val) {
        var x;
        var y;
        x = (new Date()).getTime();     // 当前时间
        y = val;//Math.random();

        chart1.series[0].addPoint([x, y], true, true);     //追加点并去掉一个点         //chart1.series[0].addPoint([x, y]);追加点( 不去掉点 )

    }

 function ParseValue(val) {
        var data = JSON.parse(val);   //字符串转换为对象

        var v = document.getElementById("device").innerHTML;
        if (v == data.device_id) {
            if (data.device_id > 9) {
                switch (data.value) {
                    case 0:
                        document.getElementById("vd").innerHTML = "关闭";
                        break;
                    case 1:
                        document.getElementById("vd").innerHTML = "打开";
                        break;
                    case 2:
                        document.getElementById("vd").innerHTML = "停止";
                        break;
                    default:
                }
            } else {
                document.getElementById("vd").innerHTML = data.value;
            }
        }

        if (v == data.device_id) {
            if (data.device_id < 10) {
                myChart(data.value);
            } else {
                document.getElementById("container1").hidden();
            }
        }
    }
当然,在这之前还要建立TCP连接:
<script>
    var ws;
    var SocketCreated = false;
    var isUserloggedout = false;

    window.onload = function Connect() {
        if (SocketCreated && (ws.readyState == 0 || ws.readyState == 1)) {
            //(SocketCreated = false)&&(连接未建立)。。。。readyState属性表示ReadOnly属性的状态。等于0或者1表示连接未建立
            SocketCreated = false;
            isUserloggedout = true;
            ws.close();
        } else {
            //alert("准备连接到服务器 ...");
            document.getElementById("wsServerStatus").innerHTML = "准备连接到服务器 ...";
            try {
                if ("WebSocket" in window) {
                    ws = new WebSocket("ws://192.168.1.108:2012");
                }
                else
                if("MozWebSocket" in window) {
                    ws = new MozWebSocket("ws://192.168.1.108:2012");
                }
                SocketCreated = true;
                isUserloggedout = false;
            } catch (ex) {
                alert(ex, "ERROR");
                return;
            }
            ws.onopen = WSonOpen;
            ws.onmessage = WSonMessage;
            ws.onclose = WSonClose;
            ws.onerror = WSonError;
        }
    };

    function WSonOpen() {
        ServerStatus = true;
        document.getElementById("wsServerStatus").innerHTML = "连接已建立";
        Login();
    };

    function Login() {
        var loginBody = { account: "", pass_word: "" };
        loginBody.account = "11111111111";
        loginBody.pass_word = "1111";
        var body = JSON.stringify(loginBody);

        var loginReq = { key: "/user/login", token: "", type: 1, body: body };

        ws.send(JSON.stringify(loginReq));
    }

    function WSonMessage(event) {
        var msg = JSON.parse(event.data);
        switch (msg.key) {
            case "/device/data":
            case "/device/status":
                var n = document.getElementById("content-main").childElementCount;
                for (var i = 1; i < n; i++) {
                try{
                    var m = document.getElementById("content-main").children[i];
                    m.contentWindow.ParseValue(msg.body);
                }catch(err){
                }
            }
            break;
        }
    };

    function WSonClose() {
        ServerStatus = false;
        document.getElementById("wsServerStatus").innerHTML = "连接已关闭";
    };

    function WSonError() {
        ServerStatus = false;
        document.getElementById("wsServerStatus").innerHTML = "远程连接中断";
    };

    function WsSend(val) {
        ws.send(val);
    }

</script>
