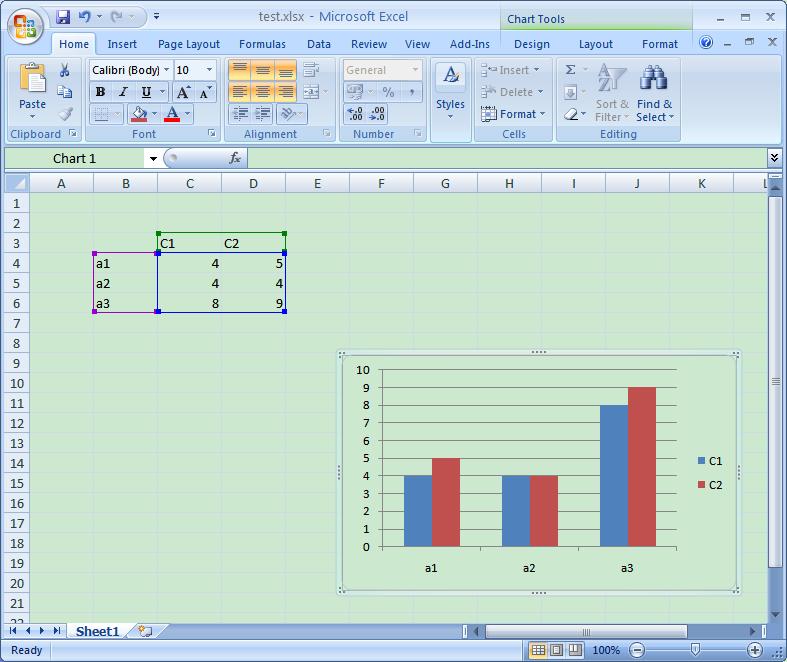
Openxml format SDK 2.0 v2 的 how to 文章里提供了一个怎样插入 chart 图表的示例, 但这个 chart的数据是独立不是根据excel sheet 上data 动态生成的chart,因此, 我在此示例代码上做了一些改动,可以根据excel sheet 上的数据, 生成 chart 图片, 效果如图
画图的逻辑结构为:
WorksheetPart<-DrawingsPart<-ChartPart<-ChartSpace<-Chart<-PlotArea<-BarChart<-BarChartSeries
Openxml 画excel 柱状图的数据存在在BarChartSeries, 一个BarChartSeries的实例代表一个颜色的柱子, 上图共有C1, C2两个BarChartSeries实例。
BarChartSeries 又包含三个部门:CategoryAxisData(x轴坐标), SeriesText(类型的名字, 这个也可以通过数据源取,sdk是传的固定值), Values(值, 柱状图的y轴值)。
Openxml的数据源对应的类型是DocumentFormat.OpenXml.Drawing.Charts.Formula, 如:new DocumentFormat.OpenXml.Drawing.Charts.Formula(”sheet1!$A$1:$C$4“), 这个是说取 sheet1的 A1 到C4的数据
这样我们改造sdk的代码就是 变BarChartSeries的值参, 为Openxml 的 Formula数据源
1. 生成x轴的数据源实例:
Code
string formulaString = string.Format("{0}!${1}${2}:${3}${4}", sheetName, columnName, startx + 1, columnName, startx + rowCount -1);
CategoryAxisData cad = new CategoryAxisData();
cad.StringReference = new StringReference() { Formula = new DocumentFormat.OpenXml.Drawing.Charts.Formula(formulaString) };
2. 生成数据的数据源实例:
Code
formulaString = string.Format("{0}!${1}${2}:${3}${4}", sheetName, columnName, startx +1, columnName, startx + rowCount-1);
DocumentFormat.OpenXml.Drawing.Charts.Values v = new DocumentFormat.OpenXml.Drawing.Charts.Values();
v.NumberReference = new NumberReference() { Formula = new DocumentFormat.OpenXml.Drawing.Charts.Formula(formulaString) };
这个数据源取得数据需要把保证cell的datatype 是"Number";因此在写数据时要用如下方法
Cell cell = InsertCellInWorksheet(name, Convert.ToUInt32(j + startx), worksheetPart);
cell.CellValue = new CellValue(index.ToString());
cell.DataType = new EnumValue<CellValues>(CellValues.Number);
worksheetPart.Worksheet.Save();
3. 生成分类柱的名字:
Code
formulaString = string.Format("{0}!${1}${2}", sheetName, columnName, startx);
SeriesText st = new SeriesText();
st.StringReference = new StringReference() { Formula = new DocumentFormat.OpenXml.Drawing.Charts.Formula(formulaString) };
4. 生成柱状图的一个分类的实例:
Code
BarChartSeries barChartSeries = barChart.AppendChild<BarChartSeries>(new BarChartSeries(new Index() { Val = new UInt32Value(i) },
new Order() { Val = new UInt32Value(i) }, st, v));
if (sIndex == 1)
barChartSeries.AppendChild(cad);
这里startx表示excel行索引, starty表示excel的列索引
改造SDK how to 方法的完整代码:
Code
1
/**//// <summary>
2
/// draw the 2D bar chart
3
/// index start from 1
4
/// </summary>
5
/// <param name="startx">index start from 1 for row</param>
6
/// <param name="starty">index start from 1 for column</param>
7
/// <param name="columnCount"></param>
8
/// <param name="rowCount"></param>
9
public void InsertChartInSpreadsheet(int startx, int starty, int columnCount, int rowCount)
10
{
11
WorksheetPart worksheetPart = CurrentWorksheetPart;
12
13
SDK How to example code#region SDK How to example code
14
// Add a new drawing to the worksheet.
15
DrawingsPart drawingsPart = worksheetPart.AddNewPart<DrawingsPart>();
16
worksheetPart.Worksheet.Append(new DocumentFormat.OpenXml.Spreadsheet.Drawing()
{ Id = worksheetPart.GetIdOfPart(drawingsPart) });
17
worksheetPart.Worksheet.Save();
18
19
// Add a new chart and set the chart language to English-US.
20
ChartPart chartPart = drawingsPart.AddNewPart<ChartPart>();
21
chartPart.ChartSpace = new ChartSpace();
22
chartPart.ChartSpace.Append(new EditingLanguage()
{ Val = new StringValue("en-US") });
23
DocumentFormat.OpenXml.Drawing.Charts.Chart chart = chartPart.ChartSpace.AppendChild<DocumentFormat.OpenXml.Drawing.Charts.Chart>(
24
new DocumentFormat.OpenXml.Drawing.Charts.Chart());
25
26
// Create a new clustered column chart.
27
PlotArea plotArea = chart.AppendChild<PlotArea>(new PlotArea());
28
Layout layout = plotArea.AppendChild<Layout>(new Layout());
29
BarChart barChart = plotArea.AppendChild<BarChart>(new BarChart(new BarDirection()
{ Val = new EnumValue<BarDirectionValues>(BarDirectionValues.Column) },
30
new BarGrouping()
{ Val = new EnumValue<BarGroupingValues>(BarGroupingValues.Clustered) }));
31
#endregion
32
33
string sheetName = GetCurrentSheetName();
34
string columnName = GetColumnName(starty - 1);
35
string formulaString = string.Format("{0}!${1}${2}:${3}${4}", sheetName, columnName, startx + 1, columnName, startx + rowCount - 1);
36
CategoryAxisData cad = new CategoryAxisData();
37
cad.StringReference = new StringReference()
{ Formula = new DocumentFormat.OpenXml.Drawing.Charts.Formula(formulaString) };
38
39
uint i = 0;
40
for (int sIndex = 1; sIndex < columnCount; sIndex++)
41
{
42
columnName = GetColumnName(starty + sIndex - 1);
43
formulaString = string.Format("{0}!${1}${2}", sheetName, columnName, startx);
44
SeriesText st = new SeriesText();
45
st.StringReference = new StringReference()
{ Formula = new DocumentFormat.OpenXml.Drawing.Charts.Formula(formulaString) };
46
47
formulaString = string.Format("{0}!${1}${2}:${3}${4}", sheetName, columnName, startx + 1, columnName, startx + rowCount - 1);
48
DocumentFormat.OpenXml.Drawing.Charts.Values v = new DocumentFormat.OpenXml.Drawing.Charts.Values();
49
v.NumberReference = new NumberReference()
{ Formula = new DocumentFormat.OpenXml.Drawing.Charts.Formula(formulaString) };
50
51
BarChartSeries barChartSeries = barChart.AppendChild<BarChartSeries>(new BarChartSeries(new Index()
{ Val = new UInt32Value(i) },
52
new Order()
{ Val = new UInt32Value(i) }, st, v));
53
if (sIndex == 1)
54
barChartSeries.AppendChild(cad);
55
i++;
56
}
57
SDK how to example Code#region SDK how to example Code
58
59
barChart.Append(new AxisId()
{ Val = new UInt32Value(48650112u) });
60
barChart.Append(new AxisId()
{ Val = new UInt32Value(48672768u) });
61
62
// Add the Category Axis.
63
CategoryAxis catAx = plotArea.AppendChild<CategoryAxis>(new CategoryAxis(new AxisId()
{ Val = new UInt32Value(48650112u) },
64
new Scaling(new Orientation()
65
{
66
Val = new EnumValue<DocumentFormat.OpenXml.Drawing.Charts.OrientationValues>(
67
DocumentFormat.OpenXml.Drawing.Charts.OrientationValues.MinMax)
68
}),
69
new AxisPosition()
{ Val = new EnumValue<AxisPositionValues>(AxisPositionValues.Bottom) },
70
new TickLabelPosition()
{ Val = new EnumValue<TickLabelPositionValues>(TickLabelPositionValues.NextTo) },
71
new CrossingAxis()
{ Val = new UInt32Value(48672768U) },
72
new Crosses()
{ Val = new EnumValue<CrossesValues>(CrossesValues.AutoZero) },
73
new AutoLabeled()
{ Val = new BooleanValue(true) },
74
new LabelAlignment()
{ Val = new EnumValue<LabelAlignmentValues>(LabelAlignmentValues.Center) },
75
new LabelOffset()
{ Val = new UInt16Value((ushort)100) }));
76
77
// Add the Value Axis.
78
ValueAxis valAx = plotArea.AppendChild<ValueAxis>(new ValueAxis(new AxisId()
{ Val = new UInt32Value(48672768u) },
79
new Scaling(new Orientation()
80
{
81
Val = new EnumValue<DocumentFormat.OpenXml.Drawing.Charts.OrientationValues>(
82
DocumentFormat.OpenXml.Drawing.Charts.OrientationValues.MinMax)
83
}),
84
new AxisPosition()
{ Val = new EnumValue<AxisPositionValues>(AxisPositionValues.Left) },
85
new MajorGridlines(),
86
new DocumentFormat.OpenXml.Drawing.Charts.NumberFormat()
{ FormatCode = new StringValue("General"), SourceLinked = new BooleanValue(true) },
87
new TickLabelPosition()
{ Val = new EnumValue<TickLabelPositionValues>(TickLabelPositionValues.NextTo) },
88
new CrossingAxis()
{ Val = new UInt32Value(48650112U) },
89
new Crosses()
{ Val = new EnumValue<CrossesValues>(CrossesValues.AutoZero) },
90
new CrossBetween()
{ Val = new EnumValue<CrossBetweenValues>(CrossBetweenValues.Between) }));
91
92
// Add the chart Legend.
93
Legend legend = chart.AppendChild<Legend>(new Legend(new LegendPosition()
{ Val = new EnumValue<LegendPositionValues>(LegendPositionValues.Right) },
94
new Layout()));
95
96
chart.Append(new PlotVisibleOnly()
{ Val = new BooleanValue(true) });
97
98
// Save the chart part.
99
chartPart.ChartSpace.Save();
100
101
// Position the chart on the worksheet using a TwoCellAnchor object.
102
drawingsPart.WorksheetDrawing = new WorksheetDrawing();
103
TwoCellAnchor twoCellAnchor = drawingsPart.WorksheetDrawing.AppendChild<TwoCellAnchor>(new TwoCellAnchor());
104
twoCellAnchor.Append(new FromMarker(new ColumnId("9"),
105
new ColumnOffset("581025"),
106
new RowId("17"),
107
new RowOffset("114300")));
108
twoCellAnchor.Append(new ToMarker(new ColumnId("17"),
109
new ColumnOffset("276225"),
110
new RowId("32"),
111
new RowOffset("0")));
112
113
// Append a GraphicFrame to the TwoCellAnchor object.
114
DocumentFormat.OpenXml.Drawing.Spreadsheet.GraphicFrame graphicFrame =
115
twoCellAnchor.AppendChild<DocumentFormat.OpenXml.Drawing.Spreadsheet.GraphicFrame>(
116
new DocumentFormat.OpenXml.Drawing.Spreadsheet.GraphicFrame());
117
graphicFrame.Macro = "";
118
119
graphicFrame.Append(new DocumentFormat.OpenXml.Drawing.Spreadsheet.NonVisualGraphicFrameProperties(
120
new DocumentFormat.OpenXml.Drawing.Spreadsheet.NonVisualDrawingProperties()
{ Id = new UInt32Value(2u), Name = "Chart 1" },
121
new DocumentFormat.OpenXml.Drawing.Spreadsheet.NonVisualGraphicFrameDrawingProperties()));
122
123
graphicFrame.Append(new Transform(new Offset()
{ X = 0L, Y = 0L },
124
new Extents()
{ Cx = 0L, Cy = 0L }));
125
126
graphicFrame.Append(new Graphic(new GraphicData(new ChartReference()
{ Id = drawingsPart.GetIdOfPart(chartPart) })
{ Uri = "http://schemas.openxmlformats.org/drawingml/2006/chart" }));
127
128
twoCellAnchor.Append(new ClientData());
129
130
// Save the WorksheetDrawing object.
131
drawingsPart.WorksheetDrawing.Save();
132
133
#endregion
134
}
获取当前sheet name的方法:
Code
private string GetCurrentSheetName()
{
string name = "";
WorkbookPart workbookPart = spreadSheet.WorkbookPart;
string relationshipId = workbookPart.GetIdOfPart(CurrentWorksheetPart);
Sheets sheets = workbookPart.Workbook.GetFirstChild<Sheets>();
foreach (Sheet item in sheets)
{
if (item.Id == relationshipId)
{
name = item.Name;
break;
}
}
return name;
}
怎样生成excel 并写数据请参看 http://www.cnblogs.com/skyfei/archive/2009/06/12/Openxml.html