XHProf
这个软件本是Facebook内部的一个应用工具,2009年3月份开源,为PHP的性能监测提供了很好的工具。官方的介绍中提到:
XHProf is a hierarchical profiler for PHP. It reports function-level call counts and inclusive and exclusive metrics such as wall (elapsed) time, CPU time and memory usage.
XHProf's light-weight nature and aggregation capabilities make it well suited for collecting "function-level" performance statistics from production environments.
可以先来看看 XHProf 提供的图形界面的截图
XHProf的一些特性:
1、Flat Profile. 提供函数级的汇总信息,比如调用次数、执行时间、内存使用、CPU占用等。

2、Hierarchical Profile。 对每个程序,进行了父级调用和子级调用的分解。
3、Diff Reports(差异报告)。有很多种情况,我们希望能够对比,比如新版本比旧版本提升了多少速度,两个版本的差距究竟在哪里。Diff Report 就是这样的工具,接收两个输入,并且分别给出各自的 Flat Profile 和 Hierarchical Profile 报告。
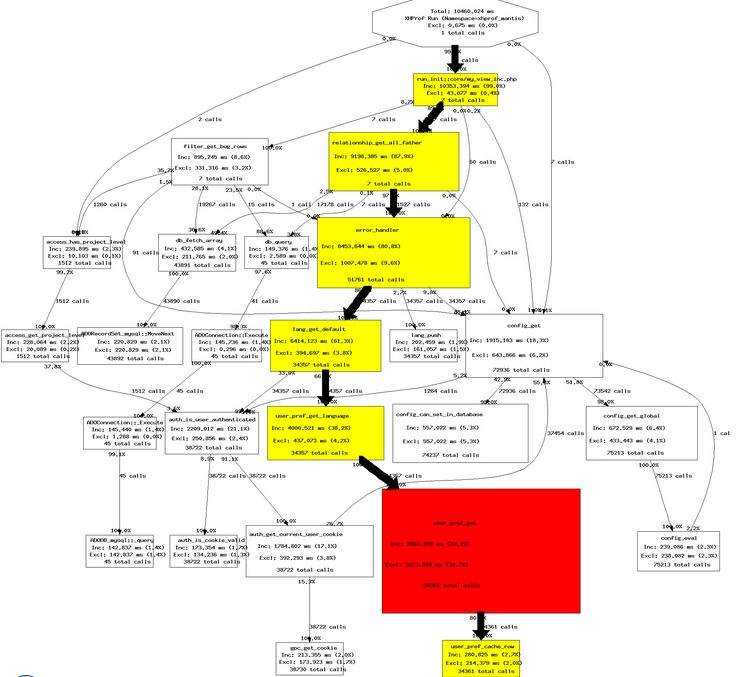
4、Callgraph View(调用视图)。性能监测的数据可以绘制成调用视图,方便我们查看。
5、Memory Profile(内存监控)。这个特性帮助我们了解PHP如何分配和释放内存。值得注意的是,XHProf并不是严格的监测内存的分配和释放动作,而是计算每个函数进入和退出时的内存状况,这是一个相对简单的实现方式,但是基本上也能够满足我们日常的监控需求。
6、如何处理外部文件。XHProf将 include,require,include_once,require_once进来的文件视作是一个 function。
XHProf目前只支持一个级别的函数追踪,但是貌似也没有特别大的影响。
XHProf的安装配置
xhprof的安装配置很简单,我们首先在 PECL 的网站上下载 源码包 然后执行安装过程
% cd <xhprof_source_directory>/extension/
% phpize
% ./configure --with-php-config=<path to php-config>
% make
% make install
% make test
php.ini file: You can update your php.ini file to automatically load your extension. Add the following to your php.ini file.
[xhprof]
extension=xhprof.so
;
; directory used by default implementation of the iXHProfRuns
; interface (namely, the XHProfRuns_Default class) for storing
; XHProf runs.
;
xhprof.output_dir=<directory_for_storing_xhprof_runs>
xhprof的使用也很简单,只要将需要监控的脚本放在 xhprof_enable() 和 xhprof_disable() 中间,就可以得到相应的结果,同时也提供了一些参数可以让我们设置是否监控 Memory, CPU 的使用,是否监控PHP内置的函数,从 0.9.2 之后,还可以设置跳过一些特定的函数。
XHProf 生成的数据,可以用 XHProf UI 来进行简单的显示。
XHProf使用也很简单,下面是一个官方的例子:
<?php
function bar($x) {
if ($x > 0) {
bar($x - 1);
}
}function foo() {
for ($idx = 0; $idx < 2; $idx++) {
bar($idx);
$x = strlen("abc");
}
}xhprof_enable(XHPROF_FLAGS_CPU + XHPROF_FLAGS_MEMORY);
foo();
$xhprof_data = xhprof_disable();
//
// Saving the XHProf run
// using the default implementation of iXHProfRuns.
//
include_once "xhprof_lib/utils/xhprof_lib.php";
include_once "xhprof_lib/utils/xhprof_runs.php";$xhprof_runs = new XHProfRuns_Default();
// Save the run under a namespace "xhprof_foo".
//
// **NOTE**:
// By default save_run() will automatically generate a unique
// run id for you. [You can override that behavior by passing
// a run id (optional arg) to the save_run() method instead.]
//
$run_id = $xhprof_runs->save_run($xhprof_data, "xhprof_foo");echo "---------------\n".
"Assuming you have set up the http based UI for \n".
"XHProf at some address, you can view run at \n".
"http://<xhprof-ui-address>/index.php?run=$run_id&source=xhprof_foo\n".
"---------------\n";?>
我们可以持久化记录的数据,数据以文件的形式保存在指定的目录,如下图:
 有了这个工具,我们可以根据其提供的数据,与相应的通知接口整合,在程序运行出现问题时,及时的发送通知信息。
xhprof画图使用的dot程序需要服务器上有libpng的环境支持,要想这部分能够正常绘图,需要安装 graphviz-2.24.0、libpng才行,具体的在参考资料4中有说。
PHP性能监控,还有两个可用的工具,一个是 XDebug,另外一个是 ZendServer,我会在接下来继续进行介绍。
参考文档:
1、Speed UP your php with xhprof
2、xhprof document
3、xhprof 中文文档