MATLAB 绘制3D图形一些常用的命令
shading:是用来处理色彩效果的,分以下三种:
1、no shading 一般的默认模式 即shading faceted
2、shading flat 在faceted的基础上去掉图上的网格线
3、shading interp 在flat的基础上进行色彩的插值处理,使色彩平滑过渡
clc;clear;close all;
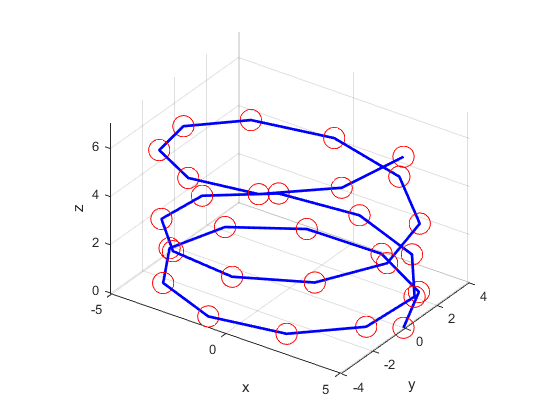
%% 3D lines
t = linspace(0,6*pi,30);
x = 5*cos(t);
y = 4*sin(t);
z = 0.02*t.^2;
figure
hold on
plot3(x,y,z,'b','linewidth',2)
plot3(x,y,z,'ro','Markersize',16)
xlabel('x')
ylabel('y')
zlabel('z')
grid on
axis('equal')
view([35,30])
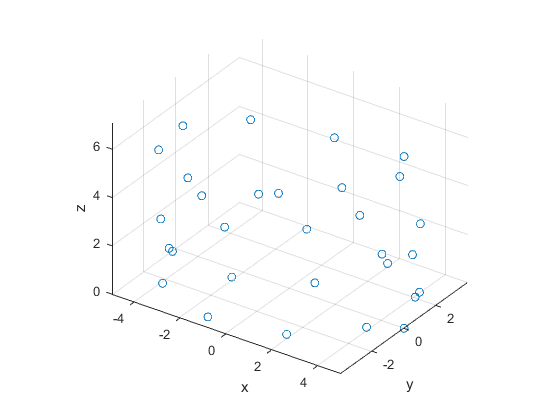
figure
scatter3(x,y,z)
xlabel('x')
ylabel('y')
zlabel('z')
grid on
axis('equal')
view([35,30])
%% 3D Surfaces
x = [1 2 5]
y = [2 3 4];
z = [1 3 0];

figure
patch(x,y,z,'m')

%mesh
x1 = linspace(-pi,pi,20);
x2 = linspace(-10,18,30);
[X1,X2] = meshgrid(x1,x2);
figure
Z = cos(X1).*X2;
mesh(X1,X2,Z)
xlabel('x_1')
ylabel('x_2')
zlabel('z = f(x_1,x_2)')
grid on
title('使用“mesh”命令绘图')
view([35,30])
% axis('equal')

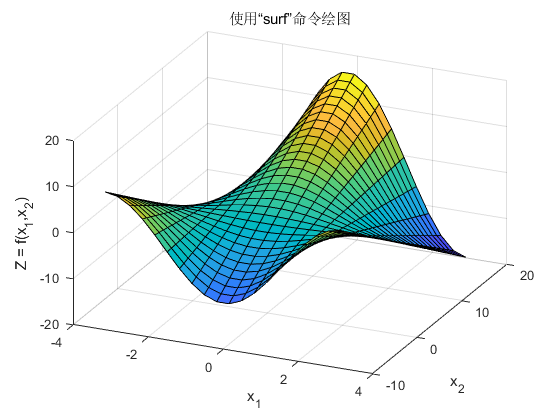
% surf
figure
Z = cos(X1).*X2;
surf(X1,X2,Z)
xlabel('x_1')
ylabel('x_2')
zlabel('Z = f(x_1,x_2)')
grid on
title('使用“surf”命令绘图')
view([35,30])
% axis('equal')
figure
x1 = linspace(-pi,pi,200); %数据取得更多
x2 = linspace(-10,18,300);
[X1,X2] = meshgrid(x1,x2);
Z = cos(X1).*X2;
surf(X1,X2,Z)
xlabel('x_1')
ylabel('x_2')
zlabel('z = f(x_1,x_2)')
grid on
title('使用“surf”命令绘图')
view([35,30])
% axis('equal')

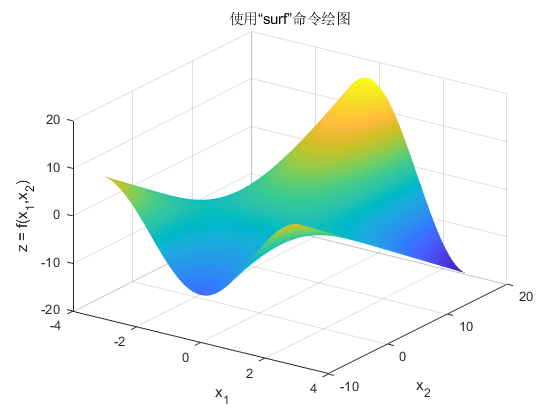
figure
x1 = linspace(-pi,pi,200); %数据取得更多
x2 = linspace(-10,18,300);
[X1,X2] = meshgrid(x1,x2);
Z = cos(X1).*X2;
surf(X1,X2,Z)
xlabel('x_1')
ylabel('x_2')
zlabel('z = f(x_1,x_2)')
grid on
title('使用“surf”命令绘图')
view([35,30])
shading interp %去掉绘图中的线条
figure
x1 = linspace(-pi,pi,20);
x2 = linspace(-10,18,30);
[X1,X2] = meshgrid(x1,x2);
Z = cos(X1).*X2;
surf(X1,X2,Z)
xlabel('x_1')
ylabel('x_2')
zlabel('z = f(x_1,x_2)')
grid on
title('使用“surf”命令绘图')
view([35,30])
shading interp %去掉绘图中的线条
colorbar     %给绘图增加图例

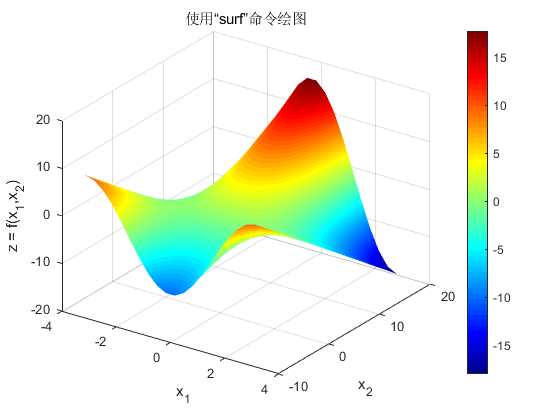
figure
surf(X1,X2,Z)
xlabel('x_1')
ylabel('x_2')
zlabel('z = f(x_1,x_2)')
grid on
title('使用“surf”命令绘图')
view([35,30])
shading interp %去掉绘图中的线条
colormap(jet) % colormap winter/winter/autumn/spring
%colormap map 或者colormap(map)都可以
colorbar %给绘图增加图例
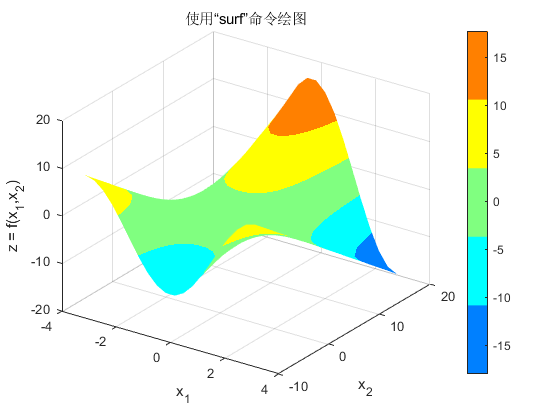
figure
surf(X1,X2,Z)
xlabel('x_1')
ylabel('x_2')
zlabel('z = f(x_1,x_2)')
grid on
title('使用“surf”命令绘图')
view([35,30])
shading interp %去掉绘图中的网格线条
colormap(jet(5)) %  colormap winter/winter/autumn/spring/hsv/hot/cool/gray
colorbar     %给绘图增加图例
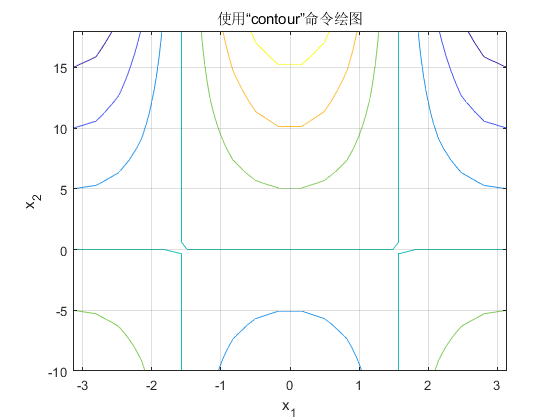
%contour
figure
contour(X1,X2,Z)
xlabel('x_1')
ylabel('x_2')
zlabel('z = f(x_1,x_2)')
grid on
title('使用“contour”命令绘图')
%surfc
figure
surfc(X1,X2,Z)
xlabel('x_1')
ylabel('x_2')
zlabel('z = f(x_1,x_2)')
grid on
title('使用“surfc”命令绘图')
view([35,30])
shading interp %去掉绘图中的线条
colormap(jet)  %  colormap winter/winter/autumn/spring/hsv/hot/cool/gray
colorbar     %给绘图增加图例

%画一个复合图
x1_line  = linspace(-1,1,20);
x2_line = linspace(-10,10,20);
z_line = cos(x1_line).*x2_line;

figure
hold on
surf(X1,X2,Z)
plot3(x1_line,x2_line,z_line,'m','linewidth',2)
xlabel('x_1')
ylabel('x_2')
zlabel('z = f(x_1,x_2)')
grid on
title('复合图')
view([35,30])
shading interp %去掉绘图中的线条
colormap(jet)  %  colormap winter/winter/autumn/spring/hsv/hot/cool/gray
colorbar     %给绘图增加图例

% 画matlab logo
figure
L = 160*membrane(1,100); %使用指令membrane来查看matlab的logo网格图
surf(L)
shading interp
colormap autumn

全部代码:


clc;clear;close all;
%% 3D lines
t = linspace(0,6*pi,30);
x = 5*cos(t);
y = 4*sin(t);
z = 0.02*t.^2;

figure
hold on
plot3(x,y,z,'b','linewidth',2)
plot3(x,y,z,'ro','Markersize',16)
xlabel('x')
ylabel('y')
zlabel('z')
grid on
axis('equal')
view([35,30])

figure
scatter3(x,y,z)
xlabel('x')
ylabel('y')
zlabel('z')
grid on
axis('equal')
view([35,30])

%% 3D Surfaces
x = [1 2 5];
y = [2 3 4];
z = [1 3 0];

figure
patch(x,y,z,'m')

%mesh
x1 = linspace(-pi,pi,20);
x2 = linspace(-10,18,30);
[X1,X2] = meshgrid(x1,x2);
figure
Z = cos(X1).*X2;
mesh(X1,X2,Z)
xlabel('x_1')
ylabel('x_2')
zlabel('z = f(x_1,x_2)')
grid on
title('使用“mesh”命令绘图')
view([35,30])
% axis('equal')

% surf
figure
Z = cos(X1).*X2;
surf(X1,X2,Z)
xlabel('x_1')
ylabel('x_2')
zlabel('Z = f(x_1,x_2)')
grid on
title('使用“surf”命令绘图')
view([35,30])
% axis('equal')

figure
x1 = linspace(-pi,pi,200); %数据取得更多
x2 = linspace(-10,18,300);
[X1,X2] = meshgrid(x1,x2);
Z = cos(X1).*X2;
surf(X1,X2,Z)
xlabel('x_1')
ylabel('x_2')
zlabel('z = f(x_1,x_2)')
grid on
title('使用“surf”命令绘图')
view([35,30])
% axis('equal')

figure
x1 = linspace(-pi,pi,200); %数据取得更多
x2 = linspace(-10,18,300);
[X1,X2] = meshgrid(x1,x2);
Z = cos(X1).*X2;
surf(X1,X2,Z)
xlabel('x_1')
ylabel('x_2')
zlabel('z = f(x_1,x_2)')
grid on
title('使用“surf”命令绘图')
view([35,30])
shading interp %去掉绘图中的线条

figure
x1 = linspace(-pi,pi,20);
x2 = linspace(-10,18,30);
[X1,X2] = meshgrid(x1,x2);
Z = cos(X1).*X2;
surf(X1,X2,Z)
xlabel('x_1')
ylabel('x_2')
zlabel('z = f(x_1,x_2)')
grid on
title('使用“surf”命令绘图')
view([35,30])
shading interp %去掉绘图中的线条
colorbar     %给绘图增加图例

figure
surf(X1,X2,Z)
xlabel('x_1')
ylabel('x_2')
zlabel('z = f(x_1,x_2)')
grid on
title('使用“surf”命令绘图')
view([35,30])
shading interp %去掉绘图中的线条
colormap(jet)  %  colormap winter/winter/autumn/spring
%colormap map  或者colormap(map)都可以
colorbar     %给绘图增加图例

figure
surf(X1,X2,Z)
xlabel('x_1')
ylabel('x_2')
zlabel('z = f(x_1,x_2)')
grid on
title('使用“surf”命令绘图')
view([35,30])
shading interp %去掉绘图中的网格线条
colormap(jet(5)) %  colormap winter/winter/autumn/spring/hsv/hot/cool/gray
colorbar     %给绘图增加图例

%contour
figure
contour(X1,X2,Z)
xlabel('x_1')
ylabel('x_2')
zlabel('z = f(x_1,x_2)')
grid on
title('使用“contour”命令绘图')

%surfc
figure
surfc(X1,X2,Z)
xlabel('x_1')
ylabel('x_2')
zlabel('z = f(x_1,x_2)')
grid on
title('使用“surfc”命令绘图')
view([35,30])
shading interp %去掉绘图中的线条
colormap(jet)  %  colormap winter/winter/autumn/spring/hsv/hot/cool/gray
colorbar     %给绘图增加图例

%画一个复合图
x1_line  = linspace(-1,1,20);
x2_line = linspace(-10,10,20);
z_line = cos(x1_line).*x2_line;

figure
hold on
surf(X1,X2,Z)
plot3(x1_line,x2_line,z_line,'m','linewidth',2)
xlabel('x_1')
ylabel('x_2')
zlabel('z = f(x_1,x_2)')
grid on
title('复合图')
view([35,30])
shading interp %去掉绘图中的线条
colormap(jet)  %  colormap winter/winter/autumn/spring/hsv/hot/cool/gray
colorbar     %给绘图增加图例

% 画matlab logo
figure
L = 160*membrane(1,100); %使用指令membrane来查看matlab的logo网格图
surf(L)
shading interp
colormap autumn
2020-10-04