前面的博客,有具体的ELK安装配置步骤,此处在其基础上修改
修改配置文件并启动
[root@topcheer filebeat-6.2.3-linux-x86_64]# vim filebeat.yml
[root@topcheer filebeat-6.2.3-linux-x86_64]# ll
总用量 50772
drwxr-x---.  2 root root       39 12月  2 13:57 data
-rw-r--r--.  1 root root    44384 3月  13 2018 fields.yml
-rwxr-xr-x.  1 root root 49058867 3月  13 2018 filebeat
-rw-r--r--.  1 root root  1887159 12月  3 17:47 filebeat-7-5-0
-rw-r-----.  1 root root    52193 3月  13 2018 filebeat.reference.yml
-rw-------.  1 root root     7299 12月  3 17:58 filebeat.yml
drwxrwxr-x.  4 wgr  wgr        24 3月  13 2018 kibana
-rw-r--r--.  1 root root      583 3月  13 2018 LICENSE.txt
drwxr-xr-x. 14 wgr  wgr       179 3月  13 2018 module
drwxr-xr-x.  2 root root     4096 3月  13 2018 modules.d
-rw-------.  1 root root   604101 12月  3 17:58 nohup.out
-rw-r--r--.  1 root root   198236 3月  13 2018 NOTICE.txt
-rw-r--r--.  1 root root      802 3月  13 2018 README.md
[root@topcheer filebeat-6.2.3-linux-x86_64]# rm -rf nohup.out
[root@topcheer filebeat-6.2.3-linux-x86_64]# nohup ./filebeat -e -c filebeat.yml &
[1] 66345
[root@topcheer filebeat-6.2.3-linux-x86_64]# nohup: 忽略输入并把输出追加到"nohup.out"

[root@topcheer filebeat-6.2.3-linux-x86_64]# ll
总用量 50072
drwxr-x---.  2 root root       39 12月  3 17:58 data
-rw-r--r--.  1 root root    44384 3月  13 2018 fields.yml
-rwxr-xr-x.  1 root root 49058867 3月  13 2018 filebeat
-rw-r--r--.  1 root root  1887159 12月  3 17:47 filebeat-7-5-0
-rw-r-----.  1 root root    52193 3月  13 2018 filebeat.reference.yml
-rw-------.  1 root root     7299 12月  3 17:58 filebeat.yml
drwxrwxr-x.  4 wgr  wgr        24 3月  13 2018 kibana
-rw-r--r--.  1 root root      583 3月  13 2018 LICENSE.txt
drwxr-xr-x. 14 wgr  wgr       179 3月  13 2018 module
drwxr-xr-x.  2 root root     4096 3月  13 2018 modules.d
-rw-------.  1 root root     1708 12月  3 17:58 nohup.out
-rw-r--r--.  1 root root   198236 3月  13 2018 NOTICE.txt
-rw-r--r--.  1 root root      802 3月  13 2018 README.md
[root@topcheer filebeat-6.2.3-linux-x86_64]# tail -200f nohup.out
2019-12-03T17:58:50.916+0800    INFO    instance/beat.go:468    Home path: [/mnt/filebeat-6.2.3-linux-x86_64] Config path: [/mnt/filebeat-6.               2.3-linux-x86_64] Data path: [/mnt/filebeat-6.2.3-linux-x86_64/data] Logs path: [/mnt/filebeat-6.2.3-linux-x86_64/logs]
2019-12-03T17:58:50.926+0800    INFO    instance/beat.go:475    Beat UUID: 6e3ca243-535f-4f7b-946d-c1172536d8f5
2019-12-03T17:58:50.926+0800    INFO    instance/beat.go:213    Setup Beat: filebeat; Version: 6.2.3
2019-12-03T17:58:50.928+0800    INFO    pipeline/module.go:76   Beat name: topcheer
2019-12-03T17:58:50.980+0800    INFO    instance/beat.go:301    filebeat start running.
2019-12-03T17:58:50.981+0800    INFO    registrar/registrar.go:108      Loading registrar data from /mnt/filebeat-6.2.3-linux-x86_64/data/re               gistry
2019-12-03T17:58:50.981+0800    INFO    [monitoring]    log/log.go:97   Starting metrics logging every 30s
2019-12-03T17:58:50.993+0800    INFO    registrar/registrar.go:119      States Loaded from registrar: 2
2019-12-03T17:58:50.993+0800    WARN    beater/filebeat.go:261  Filebeat is unable to load the Ingest Node pipelines for the configured modu               les because the Elasticsearch output is not configured/enabled. If you have already loaded the Ingest Node pipelines or are using Logstash p               ipelines, you can ignore this warning.
配置文件信息filebeat.yml
- type: log

  # Change to true to enable this prospector configuration.
  enabled: true

  # Paths that should be crawled and fetched. Glob based paths.
  paths:
    - /var/log/nginx/*.log
    #- c:programdataelasticsearchlogs*


output.redis:
  # The Redis hosts
  hosts: ["192.168.180.113:6379"]
  key: "nginx-log"
  db: 0
启动logstash
[root@topcheer logstash-6.2.3]# vim redis.conf
[root@topcheer logstash-6.2.3]# rm -rf nohup.out
[root@topcheer logstash-6.2.3]# nohup bin/logstash -f redis.conf &
[14] 37766
[root@topcheer logstash-6.2.3]# nohup: 忽略输入并把输出追加到"nohup.out"

[root@topcheer logstash-6.2.3]# tail -200f nohup.out
Sending Logstash's logs to /mnt/logstash-6.2.3/logs which is now configured via log4j2.properties
[2019-12-03T18:03:42,080][INFO ][logstash.modules.scaffold] Initializing module {:module_name=>"fb_apache", :directory=>"/mnt/logstash-6.2.3               /modules/fb_apache/configuration"}
[2019-12-03T18:03:42,268][INFO ][logstash.modules.scaffold] Initializing module {:module_name=>"netflow", :directory=>"/mnt/logstash-6.2.3/m               odules/netflow/configuration"}
[2019-12-03T18:03:45,727][WARN ][logstash.config.source.multilocal] Ignoring the 'pipelines.yml' file because modules or command line option               s are specified
[2019-12-03T18:03:52,276][INFO ][logstash.runner          ] Starting Logstash {"logstash.version"=>"6.2.3"}
[2019-12-03T18:03:54,771][INFO ][logstash.agent           ] Successfully started Logstash API endpoint {:port=>9600}
[2019-12-03T18:03:59,664][INFO ][logstash.pipeline        ] Starting pipeline {:pipeline_id=>"main", "pipeline.workers"=>4, "pipeline.batch.               size"=>125, "pipeline.batch.delay"=>50}
[2019-12-03T18:04:00,579][INFO ][logstash.outputs.elasticsearch] Elasticsearch pool URLs updated {:changes=>{:removed=>[], :added=>[http://1               27.0.0.1:9200/]}}
[2019-12-03T18:04:00,596][INFO ][logstash.outputs.elasticsearch] Running health check to see if an Elasticsearch connection is working {:hea               lthcheck_url=>http://127.0.0.1:9200/, :path=>"/"}
[2019-12-03T18:04:01,025][WARN ][logstash.outputs.elasticsearch] Restored connection to ES instance {:url=>"http://127.0.0.1:9200/"}
[2019-12-03T18:04:01,219][INFO ][logstash.outputs.elasticsearch] ES Output version determined {:es_version=>6}
[2019-12-03T18:04:01,224][WARN ][logstash.outputs.elasticsearch] Detected a 6.x and above cluster: the `type` event field won't be used to d               etermine the document _type {:es_version=>6}
logstash配置文件
[root@topcheer logstash-6.2.3]# cat redis.conf
input {
        redis {
        host => "192.168.180.113"
        data_type => "list"
        port => "6379"
        key => "nginx-log"
        type => "redis-input"
        codec => plain {
                charset => "UTF-8"
     }
    }
}
filter {
    json{
        source =>"message"
        }
}
output {
    elasticsearch {
        hosts => ["127.0.0.1:9200"]
        codec => "json"
    }
}
[root@topcheer logstash-6.2.3]#
启动Kibana
[root@topcheer kibana-6.2.3-linux-x86_64]# rm -rf nohup.out
[root@topcheer kibana-6.2.3-linux-x86_64]# nohup bin/kibana &
[16] 37870
[root@topcheer kibana-6.2.3-linux-x86_64]# nohup: 忽略输入并把输出追加到"nohup.out"

[root@topcheer kibana-6.2.3-linux-x86_64]# ll
总用量 1164
drwxr-xr-x   2 wgr  wgr       64 3月  13 2018 bin
drwxrwxr-x   2 wgr  wgr       24 12月  2 11:01 config
drwxrwxr-x   2 wgr  wgr       18 9月  21 23:35 data
-rw-rw-r--   1 wgr  wgr      562 3月  13 2018 LICENSE.txt
drwxrwxr-x   6 wgr  wgr      108 3月  13 2018 node
drwxrwxr-x 906 wgr  wgr    28672 3月  13 2018 node_modules
-rw-------   1 root root       0 12月  3 18:05 nohup.out
-rw-rw-r--   1 wgr  wgr  1129761 3月  13 2018 NOTICE.txt
drwxrwxr-x   3 wgr  wgr       45 3月  13 2018 optimize
-rw-rw-r--   1 wgr  wgr      721 3月  13 2018 package.json
drwxrwxr-x   2 wgr  wgr        6 3月  13 2018 plugins
-rw-rw-r--   1 wgr  wgr     4772 3月  13 2018 README.txt
drwxr-xr-x  15 wgr  wgr      225 3月  13 2018 src
drwxrwxr-x   5 wgr  wgr       47 3月  13 2018 ui_framework
drwxr-xr-x   2 wgr  wgr      290 3月  13 2018 webpackShims
[root@topcheer kibana-6.2.3-linux-x86_64]# tail -200f nohup.out
{"type":"log","@timestamp":"2019-12-03T10:06:46Z","tags":["status","plugin:kibana@6.2.3","info"],"pid":37870,"state":"green","message":"Stat               us changed from uninitialized to green - Ready","prevState":"uninitialized","prevMsg":"uninitialized"}
{"type":"log","@timestamp":"2019-12-03T10:06:46Z","tags":["status","plugin:elasticsearch@6.2.3","info"],"pid":37870,"state":"yellow","messag               e":"Status changed from uninitialized to yellow - Waiting for Elasticsearch","prevState":"uninitialized","prevMsg":"uninitialized"}
{"type":"log","@timestamp":"2019-12-03T10:06:47Z","tags":["status","plugin:console@6.2.3","info"],"pid":37870,"state":"green","message":"Sta               tus changed from uninitialized to green - Ready","prevState":"uninitialized","prevMsg":"uninitialized"}
{"type":"log","@timestamp":"2019-12-03T10:06:47Z","tags":["status","plugin:timelion@6.2.3","info"],"pid":37870,"state":"green","message":"St               atus changed from uninitialized to green - Ready","prevState":"uninitialized","prevMsg":"uninitialized"}
{"type":"log","@timestamp":"2019-12-03T10:06:48Z","tags":["status","plugin:metrics@6.2.3","info"],"pid":37870,"state":"green","message":"Sta               tus changed from uninitialized to green - Ready","prevState":"uninitialized","prevMsg":"uninitialized"}
{"type":"log","@timestamp":"2019-12-03T10:06:48Z","tags":["listening","info"],"pid":37870,"message":"Server running at http://192.168.180.11               3:5601"}
{"type":"log","@timestamp":"2019-12-03T10:06:50Z","tags":["status","plugin:elasticsearch@6.2.3","info"],"pid":37870,"state":"green","message               ":"Status changed from yellow to green - Ready","prevState":"yellow","prevMsg":"Waiting for Elasticsearch"}
{"type":"response","@timestamp":"2019-12-03T10:07:46Z","tags":[],"pid":37870,"method":"get","statusCode":200,"req":{"url":"/","method":"get"               ,"headers":{"host":"192.168.180.113:5601","connection":"keep-alive","upgrade-insecure-requests":"1","user-agent":"Mozilla/5.0 (Windows NT 10               .0; Win64; x64) AppleWebKit/537.36 (KHTML, like Gecko) Chrome/73.0.3683.103 Safari/537.36","accept":"text/html,application/xhtml+xml,applica               tion/xml;q=0.9,image/webp,image/apng,*/*;q=0.8,application/signed-exchange;v=b3","accept-encoding":"gzip, deflate","accept-language":"zh-CN,               zh;q=0.9,en-US;q=0.8,en;q=0.7"},"remoteAddress":"192.168.180.1","userAgent":"192.168.180.1"},"res":{"statusCode":200,"responseTime":178,"con               tentLength":9},"message":"GET / 200 178ms - 9.0B"}
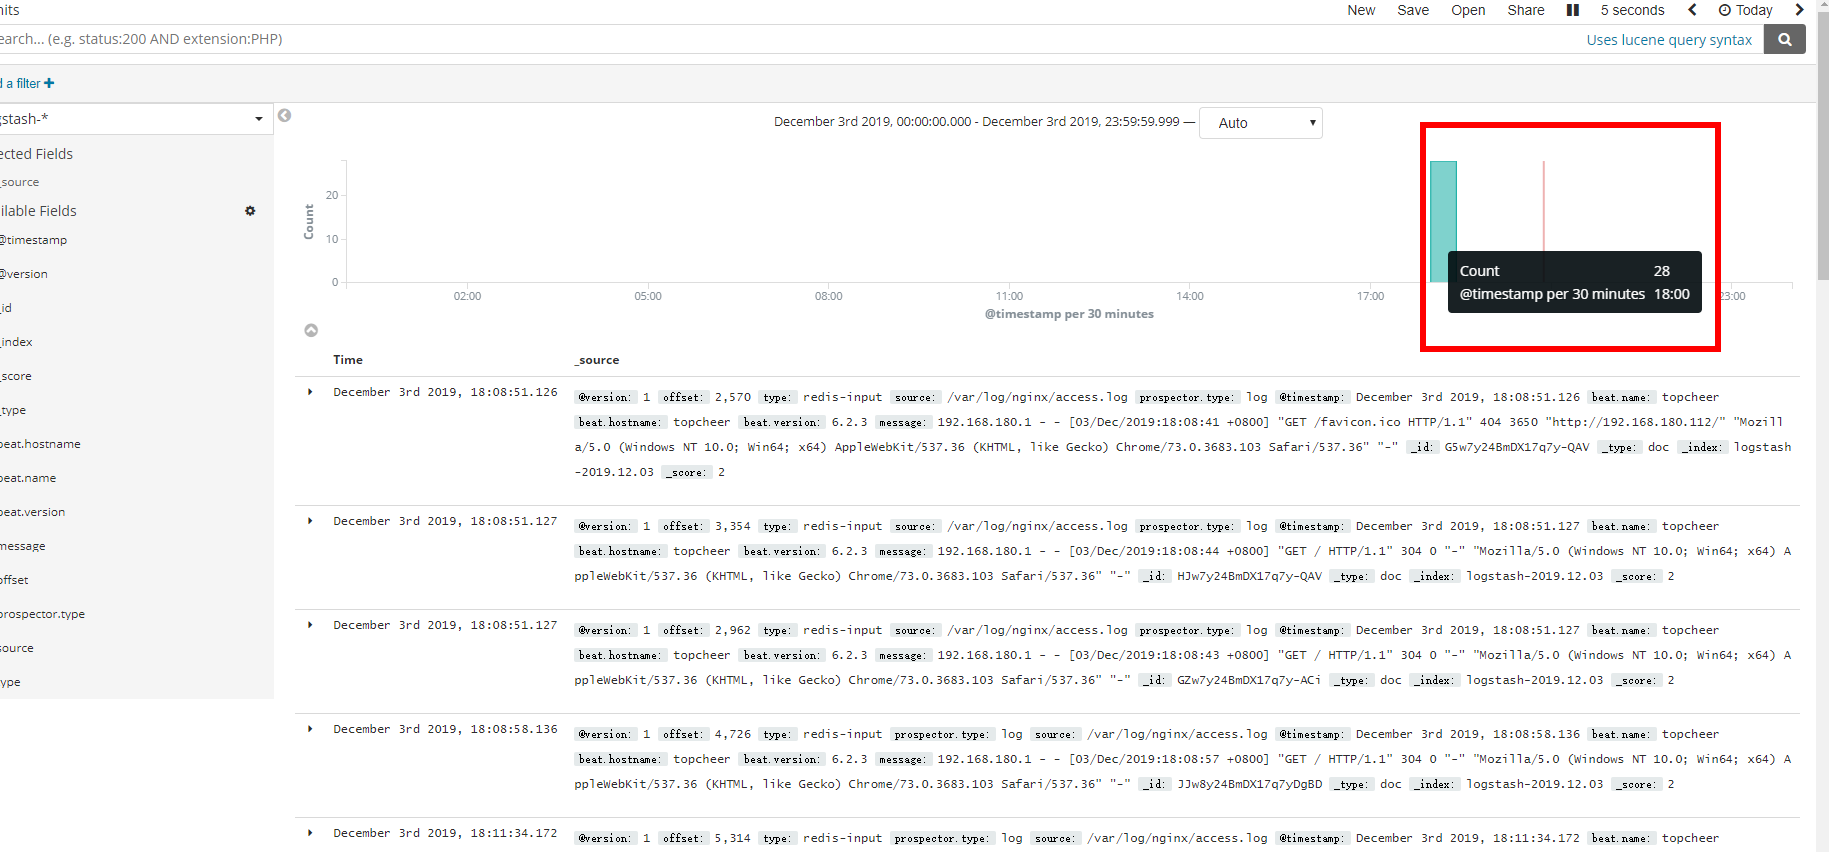
测试,多次发起请求