Matplotlib是最流行的Python底层绘图库,主要做数据可视化图表,名字取材于MATLAB。
折线图
#导入需要用到的模块
from matplotlib import pyplot as plt
import random
from matplotlib import font_manager
#输入x轴和y轴的值(二者必须个数相等一一对应)
x = range(0,120)
y_1 = [random.randint(26, 31) for i in range(120)]
y_2 = [random.randint(29, 42) for j in range(120)]
#配置图片大小及清晰度,以及解决中文字体无法显示的问题
fig = plt.figure(figsize=(20,8),dpi = 80)
font = font_manager.FontProperties(fname="C:WindowsFontsmsyh.ttc")
#自定义显示x轴刻度文字
_xtick_labels = ["10点{}分".format(str(i).rjust(2,'0')) for i in range(60)]
_xtick_labels += ["11点{}分".format(str(i).rjust(2,'0')) for i in range(60)]
#调整x轴刻度间距并指定字体样式
plt.xticks(x[::3], _xtick_labels[::3], rotation = 45, fontproperties=font)
plt.yticks(range(min(min(y_1),min(y_2)), max(max(y_1)+1,max(y_2)+1)), fontproperties=font)
#添加描述信息
plt.xlabel("时间", fontproperties=font)
plt.ylabel("温度 单位(℃)", fontproperties=font)
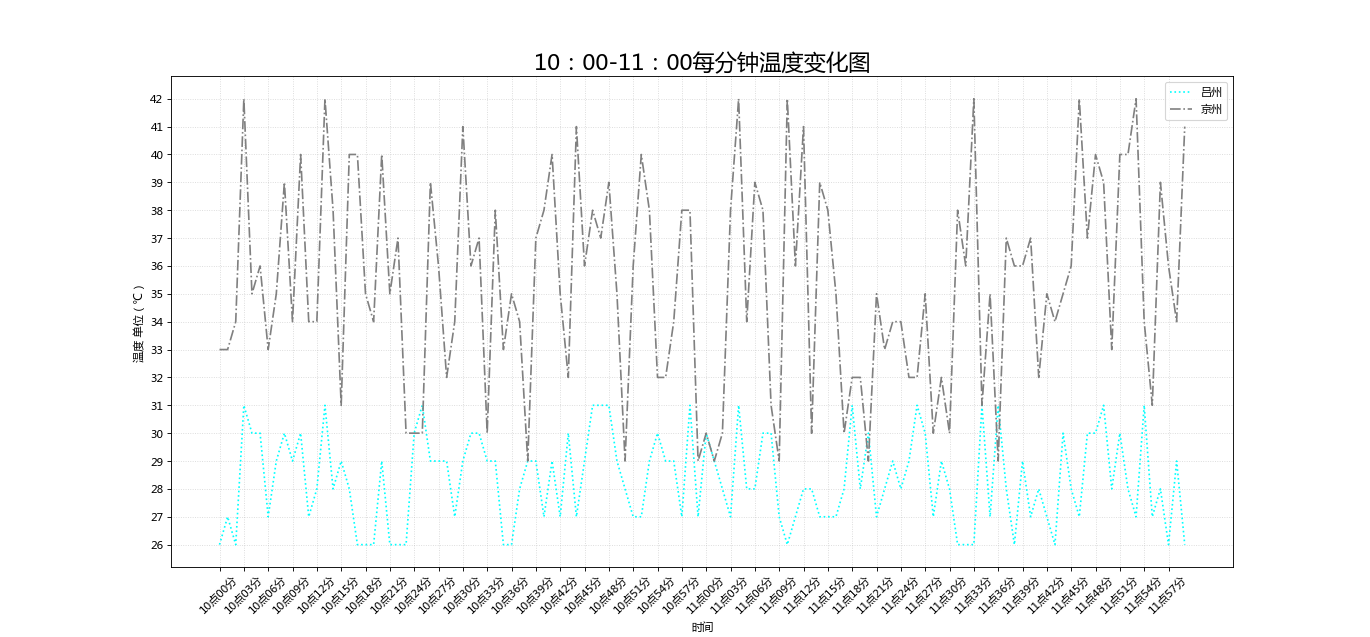
plt.title("10:00-11:00每分钟温度变化图", fontproperties=font, size=20)
#添加网格(alpha控制透明度,linestyle控制线型)
plt.grid(alpha=0.5, linestyle=":")
#画多条折线就多次调用plot函数(label为图例中的文字描述)
plt.plot(x,y_1, label="吕州", color="cyan", linestyle=":")
plt.plot(x,y_2, label="京州", color="gray", linestyle="-.")
#仅仅在图例中的字体需要用prop来指定,其余都用fontproperties来指定
plt.legend(prop=font)
#展示图形
plt.show()
结果如图:
散点图
# 导入需要用到的模块
from matplotlib import pyplot as plt
from matplotlib import font_manager
# 输入x轴和y轴的值(二者必须个数相等一一对应,这里为了避免拥挤将两个月份的温度值分列在x轴的左右两侧)
y_3 = [11, 17, 16, 11, 12, 11, 12, 6, 6, 7, 8, 9, 12, 15, 14, 17,
18, 21, 16, 17, 20, 14, 15, 15, 15, 19, 21, 22, 22, 22, 23]
y_10 = [26, 26, 28, 19, 21, 17, 16, 19, 18, 20, 20, 19, 22, 23, 17,
20, 21, 20, 22, 15, 11, 15, 5, 13, 17, 10, 11, 13, 12, 13, 6]
x_3 = range(1, 32)
x_10 = range(43, 74)
# 配置图片大小及清晰度,以及解决中文字体无法显示的问题
plt.figure(figsize=(30, 8), dpi=80)
font = font_manager.FontProperties(fname="c:windowsFontsmsyh.ttc")
# 调整x轴的刻度文字
_x = list(x_3) + list(x_10)
_xtick_labels = ["3月{}日".format(i) for i in x_3]
_xtick_labels += ["10月{}日".format(j) for j in x_3]
# 调整x轴刻度间距并指定字体样式
plt.xticks(_x[::3], _xtick_labels[::3], fontproperties=font, rotation=45)
plt.yticks(range(min(min(y_3), min(y_10))-3, max(max(y_3), max(y_10))+3), fontproperties=font)
# 添加描述信息
plt.xlabel("日期", fontproperties=font)
plt.ylabel("温度 单位(℃)", fontproperties=font)
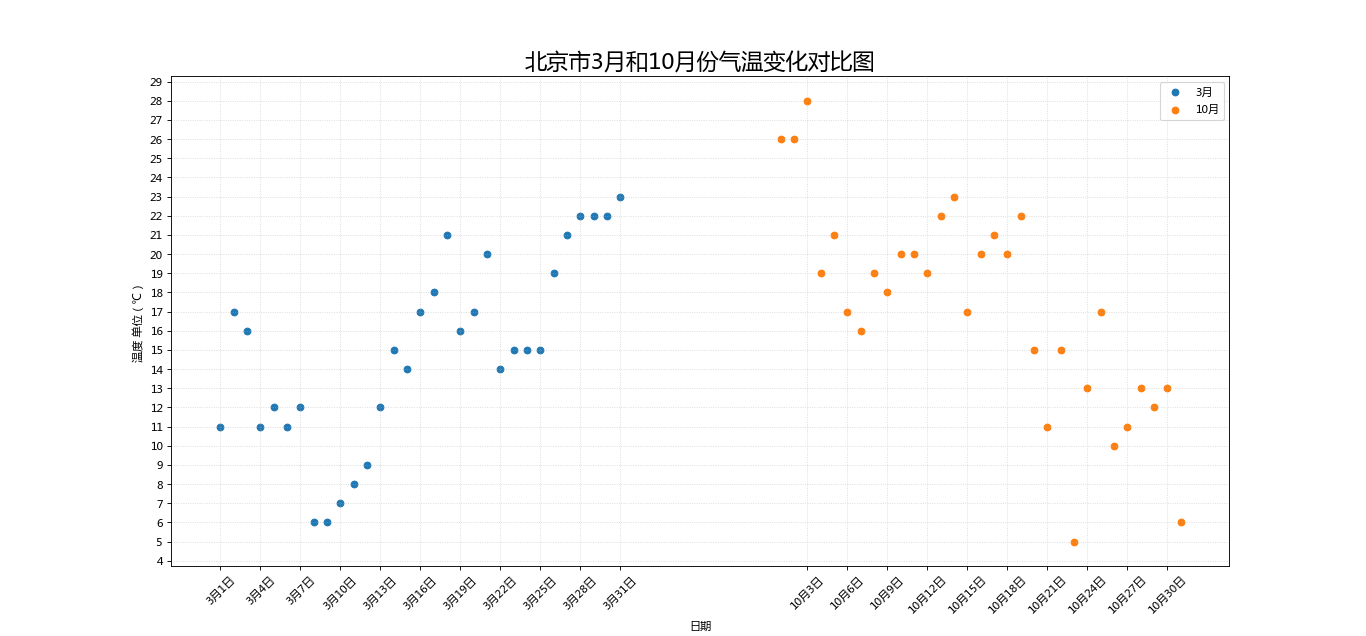
plt.title("北京市3月和10月份气温变化对比图", fontproperties=font, size=20)
# 添加网格(alpha控制透明度,linestyle控制线型)
plt.grid(alpha=0.5, linestyle=":")
# 仅仅在图例中的字体需要用prop来指定,其余都用fontproperties来指定
plt.legend(prop=font)
# 绘图
plt.scatter(x_3, y_3, label="3月",)
plt.scatter(x_10, y_10, label="10月")
# 展示图形
plt.show()
结果如图:
条形图
# 导入需要用到的模块
from matplotlib import pyplot as plt
from matplotlib import font_manager

# 为名字过长的影片名中添加换行符
names_1 = ["战狼2", "速度与激情8", "功夫瑜伽", "西游伏妖篇", "变形金刚5:最后的骑士", "摔跤吧!爸爸", "加勒比海盗5:死无对证",
     "金刚:骷髅岛", "极限特工:终极回归", "生化危机6:终章", "乘风破浪", "神偷奶爸3", "智取威虎山", "大闹天竺",
     "金刚狼3:殊死一战", "蜘蛛侠:英雄归来", "悟空传", "银河护卫队2", "情圣", "新木乃伊", ]
names_2 = []
for name in names_1:
    if len(list(name)) > 5:
        ls_1 = list(name)
        ls_1.insert(5, '
')
        name = "".join(ls_1)
    names_2.append(name)

# 输入x轴和y轴的值(二者必须个数相等一一对应)
x = range(len(names_1))
y = [56.01, 26.94, 17.53, 16.49, 15.45, 12.96, 11.8, 11.61, 11.28, 11.12,
     10.49, 10.3, 8.75, 7.55, 7.32, 6.99, 6.88, 6.86, 6.58, 6.23]

plt.figure(figsize=(20, 15), dpi=80)
font = font_manager.FontProperties(fname="c:windowsFontsmsyh.ttc")

plt.xticks(x, names_2, fontproperties=font, rotation=90)

plt.bar(x, y, width=0.3, color="orange")
# 在条形图上显示数值
for xx, yy in zip(x,y):
    plt.text(xx, yy+0.5, str(yy), ha='center')
# 添加描述信息
plt.xlabel("影片名称", fontproperties=font)
plt.ylabel("票房数", fontproperties=font)
plt.title("热门电影3日票房", fontproperties=font, size=20)
plt.show()
结果如图:
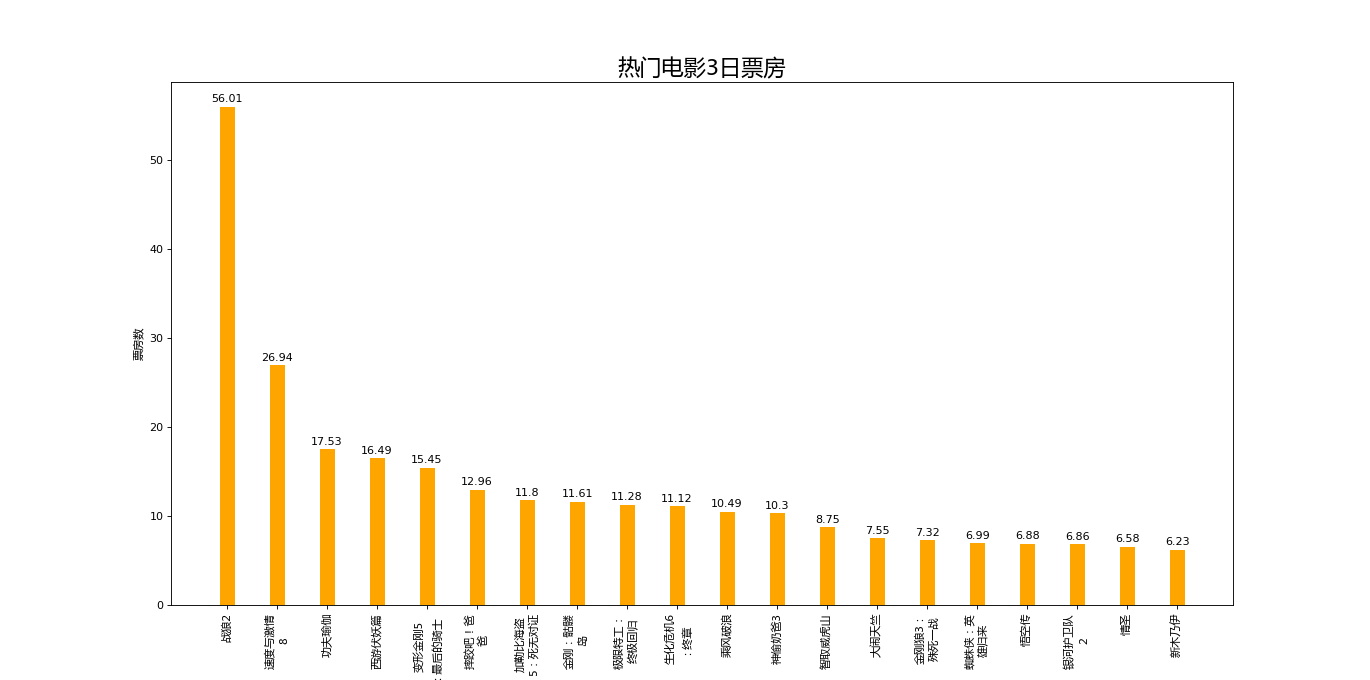
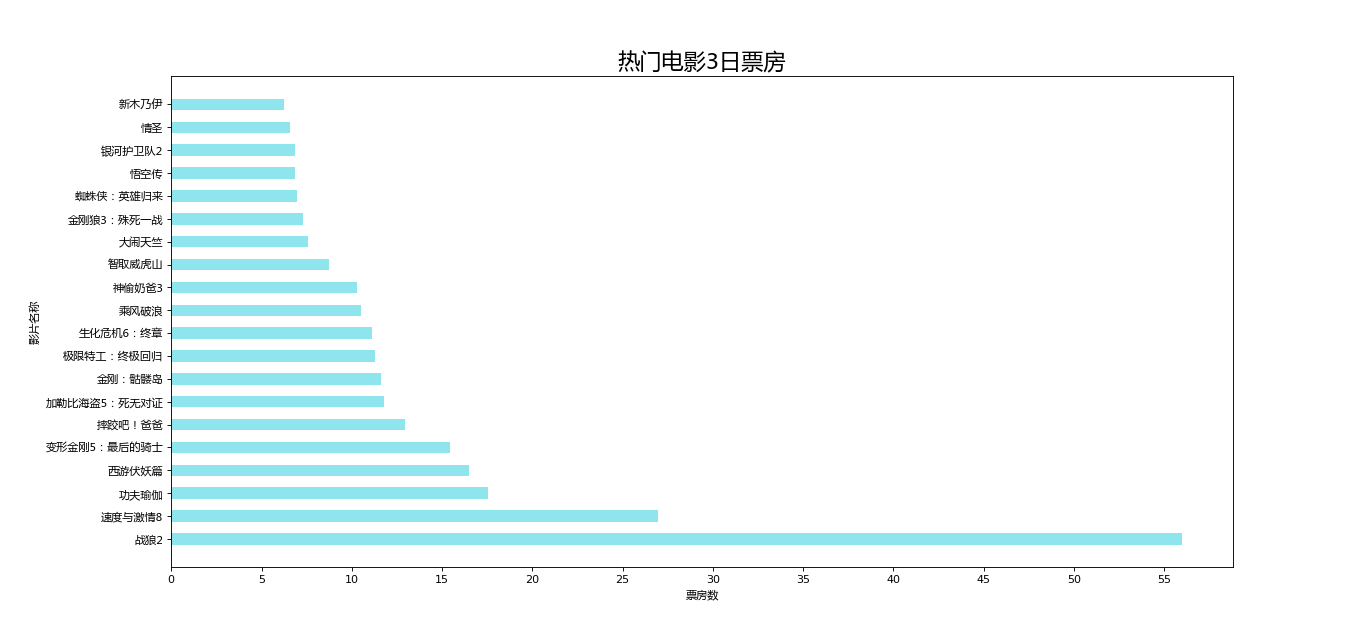
可以看到竖的条形图在面对文字比较多的时候会出现显示困难的问题,所以这时我们需要用到横向的条形图
# 导入需要用到的模块
from matplotlib import pyplot as plt
from matplotlib import font_manager

names_1 = ["战狼2", "速度与激情8", "功夫瑜伽", "西游伏妖篇", "变形金刚5:最后的骑士", "摔跤吧!爸爸", "加勒比海盗5:死无对证",
     "金刚:骷髅岛", "极限特工:终极回归", "生化危机6:终章", "乘风破浪", "神偷奶爸3", "智取威虎山", "大闹天竺",
     "金刚狼3:殊死一战", "蜘蛛侠:英雄归来", "悟空传", "银河护卫队2", "情圣", "新木乃伊", ]

# 输入x轴和y轴的值(二者必须个数相等一一对应)
x = range(len(names_1))
y = [56.01, 26.94, 17.53, 16.49, 15.45, 12.96, 11.8, 11.61, 11.28, 11.12,
     10.49, 10.3, 8.75, 7.55, 7.32, 6.99, 6.88, 6.86, 6.58, 6.23]

plt.figure(figsize=(20, 8), dpi=80)
font = font_manager.FontProperties(fname="c:windowsFontsmsyh.ttc")

plt.xticks(range(0, 61)[::5])
plt.yticks(x, names_1, fontproperties=font)

plt.barh(x, y, height=0.5, color="#8EE5EE")

plt.xlabel("票房数", fontproperties=font)
plt.ylabel("影片名称", fontproperties=font)
plt.title("热门电影3日票房", fontproperties=font, size=20)

plt.show()
结果如图:
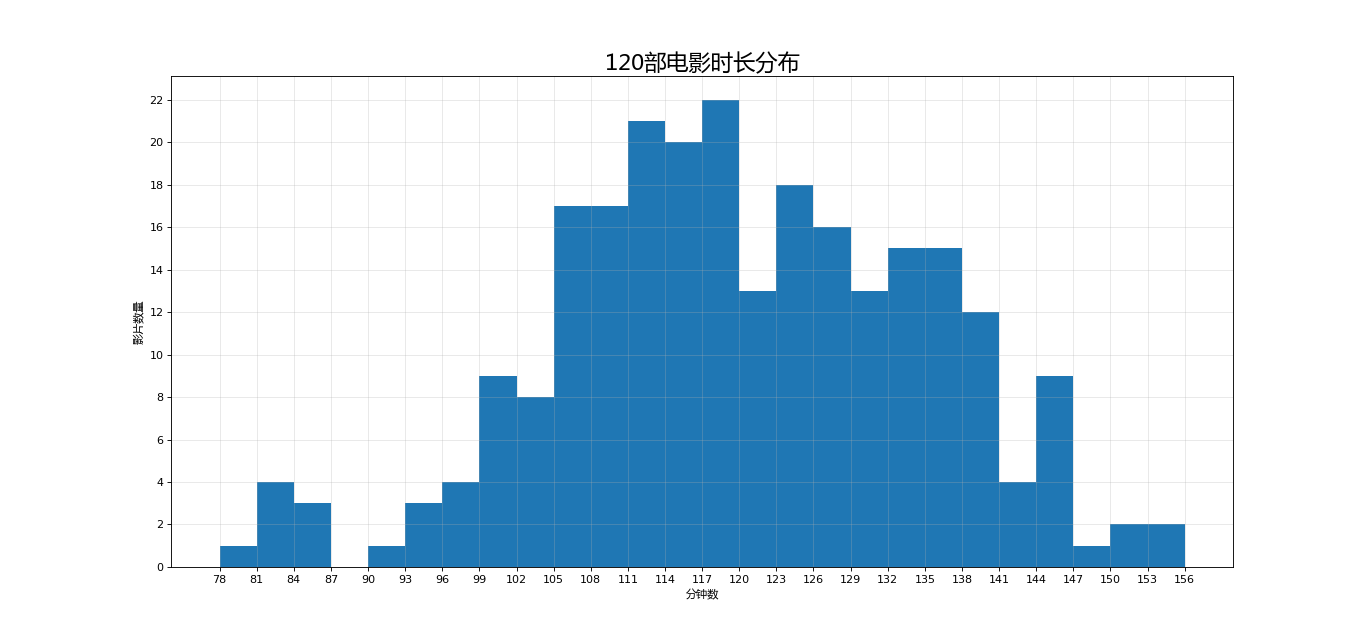
直方图
from matplotlib import pyplot as plt
from matplotlib import font_manager

a=[131,  98, 125, 131, 124, 139, 131, 117, 128, 108, 135, 138, 131, 102, 107, 114, 119, 128, 121, 142, 127, 130, 124, 101, 110, 116, 117, 110, 128, 128, 115,  99, 136, 126, 134,  95, 138, 117, 111,78, 132, 124, 113, 150, 110, 117,  86,  95, 144, 105, 126, 130,126, 130, 126, 116, 123, 106, 112, 138, 123,  86, 101,  99, 136,123, 117, 119, 105, 137, 123, 128, 125, 104, 109, 134, 125, 127,105, 120, 107, 129, 116, 108, 132, 103, 136, 118, 102, 120, 114,105, 115, 132, 145, 119, 121, 112, 139, 125, 138, 109, 132, 134,156, 106, 117, 127, 144, 139, 139, 119, 140,  83, 110, 102,123,107, 143, 115, 136, 118, 139, 123, 112, 118, 125, 109, 119, 133,112, 114, 122, 109, 106, 123, 116, 131, 127, 115, 118, 112, 135,115, 146, 137, 116, 103, 144,  83, 123, 111, 110, 111, 100, 154,136, 100, 118, 119, 133, 134, 106, 129, 126, 110, 111, 109, 141,120, 117, 106, 149, 122, 122, 110, 118, 127, 121, 114, 125, 126,114, 140, 103, 130, 141, 117, 106, 114, 121, 114, 133, 137,  92,121, 112, 146,  97, 137, 105,  98, 117, 112,  81,  97, 139, 113,134, 106, 144, 110, 137, 137, 111, 104, 117, 100, 111, 101, 110,105, 129, 137, 112, 120, 113, 133, 112,  83,  94, 146, 133, 101,131, 116, 111,  84, 137, 115, 122, 106, 144, 109, 123, 116, 111,111, 133, 150]

plt.figure(figsize=(20,8), dpi=80)
font = font_manager.FontProperties(fname="c:windowsFontsmsyh.ttc")

# 计算组数
bin_width = 3
num_bin = (max(a) - min(a)) // bin_width

plt.xticks(range(min(a), max(a) + bin_width)[::3])
plt.yticks(range(0, len(a)+1)[::2])

plt.xlabel("分钟数", fontproperties=font)
plt.ylabel("影片数量", fontproperties=font)
plt.title("120部电影时长分布", fontproperties=font, size=20)

plt.grid(alpha=1)

plt.hist(a, num_bin)
plt.show()
结果如图;
以下是以上代码中常用的参数值与代号对应的列表:
| 线型名称 | 线型代号 |
|---|---|
| 实线 | - |
| 虚线,破折线 | -- |
| 点划线 | -. |
| 点虚线,虚线 | : |
颜色代码见:RGB颜色对照表