换了新工作,也确定了我未来数据可视化的发展方向。新年第一篇博客,又逢春运,这篇技术文章就来交给大家如何做一个酷炫的迁徙图(支持移动哦)。(求star 代码点这里)
迁徙图的制作思路分为静态的元素和变换的动画。其中动画是围绕着静态的元素变换,所以我们首要的任务就是如何绘制静态的元素。
仔细看一下,静态的元素分为弧线(Arc)、弧线端点的箭头(Marker),动画部分主要是弧线终点向脉冲波一样的圆(Pulse),以及像流星一样的动态小箭头和弧线的光晕,这两个我们放在一起成为Spark。我们可以看到Spark主要在弧线上运动,如果你仔细观察一下会发现终点处点头的指向也是朝着终点处的切线方向,所以我们把主要的任务放在如何根据两个点绘制一段弧线。
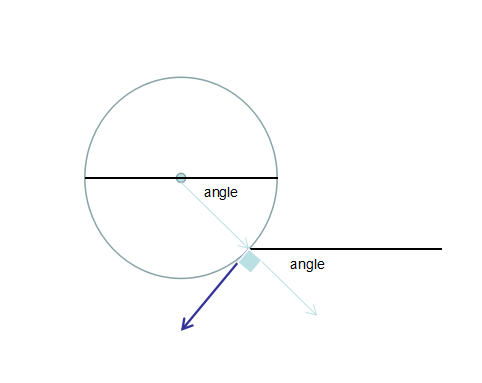
我们要绘制这段弧线就要知道圆心和半径,而数学定理告诉我们的是三点定圆,过两个点的圆有无数个,所以我们只能找一个比较合适的圆。
所以现在的问题变成了已知两点pointF和pointT,求一个合适的圆心pointC (xc, yc);
根据pointF和pointT所以我们能够确定一条直线,他的斜率 kt =(yt - yf)/ (xt - xf);
根据PointF和pointT我们能够计算出他们的中点pointH=(m, n); m = (xt - xf) / 2, n = (yt - yf) / 2;
经过两点的圆一定在他们两点的中垂线上,而直线的中垂线斜率kl与直线的斜率kt存在数学关系:kl * kt = -1;
把我们的参数全部套入这个公式可得:
((yc - n)/ (xc - m)) * ((yt - yf)/ (xt - xf)) = -1;
接着变换一下:
(yc - n) / (xc - m) = -(xt - xf) / (yt - yf);
去掉碍事的负号:
(yc - n) / (xc - m) = (xt - xf) / (yf - yt);
再变换一下:
(yc - n)/ (xt - xf) = (xc - m) / (yf - yt) = factor;
到此我们得到:
yc - n = (xt - xf) * factor;
xc - m = (yf - yt) * factor;
这两行公式中都各存在两个位置参数(yc、factor) 和 (xc、factor);所以只要找到一个合适的factor就能够得到合适的圆心进而得到半径起始角和终止角以及半径。有了这些那么Marker的指向、Spark的轨迹都可以确定了。
现在需要做的是把上述过程转换为代码:
var Arc = (function() {
    var A = function(options) {
      var startX = options.startX,
      startY = options.startY,
      endX = options.endX,
      endY = options.endY;

      //两点之间的圆有多个,通过两点及半径便可以定出两个圆,根据需要选取其中一个圆
      var L = Math.sqrt(Math.pow(startX - endX, 2) + Math.pow(startY - endY, 2));
      var m = (startX + endX) / 2; // 横轴中点
      var n = (startY + endY) / 2; // 纵轴中点
      var factor = 1.5;

      var centerX = (startY - endY) * factor + m;
      var centerY = (endX - startX) * factor + n;

      var radius = Math.sqrt(Math.pow(L / 2, 2) + Math.pow(L * factor, 2));
      var startAngle = Math.atan2(startY - centerY, startX - centerX);
      var endAngle = Math.atan2(endY - centerY, endX - centerX);

      // this.L = L;
      this.startX = startX;
      this.startY = startY;
      this.endX = endX;
      this.endY = endY;
      this.centerX = centerX;
      this.centerY = centerY;
      this.startAngle = startAngle;
      this.endAngle = endAngle;
      this.startLabel = options && options.labels && options.labels[0],
      this.endLabel = options && options.labels && options.labels[1],
      this.radius = radius;
      this.lineWidth = options.width || 1;
      this.strokeStyle = options.color || '#000';
      this.shadowBlur = options.shadowBlur;
    };

    A.prototype.draw = function(context) {
      context.save();
      context.lineWidth = this.lineWidth;
      context.strokeStyle = this.strokeStyle;
      context.shadowColor = this.strokeStyle;
      context.shadowBlur = this.shadowBlur || 2;

      context.beginPath();
      context.arc(this.centerX, this.centerY, this.radius, this.startAngle, this.endAngle, false);
      context.stroke();
      context.restore();

      context.save();
      context.fillStyle = this.strokeStyle;
      context.font = "15px sans-serif";
      if (this.startLabel) {
        context.fillText(this.startLabel, x, y);
      }
      if (this.endLabel) {
        context.fillText(this.endLabel, x, y);
      }
      context.restore();
    };

    return A;
  })();
理解了上述过程,我们就已经成功了一半。下一步的重点就是动画的绘制。关于动画首先要了解requestAnimationFrame,不知道的小伙伴要去恶补一下啦。好啦,言归正传。Spark动画分为两部分,一部拖尾效果,一部分是弧线光晕效果,当你第一次打开时候会发现,弧线光晕会随着小箭头运动,到达终点后光晕停止运动,剩下小箭头自己运动。由于每个圆的大小不一致,我们需要在每次动画过程中控制光晕和小箭头的位置。
由于他们是在圆弧上运动,所以我们只要每次计算出他们新的弧度就可以了,弧度的步长可以这样来制定:每走过20像素所转过的弧度就是各个Spark的步长啦。
所以factor = 20 / radius;
每次绘制时,光晕与小箭头的弧度位置为:
var endAngle = this.endAngle;
      // 匀速
      var angle = this.trailAngle +  this.factor;
弧度确定之后我们就能得到小箭头的位置,但是目前并不能得到小箭头的方向。根据canvas中角度的特点,再由简单的几何知识,可以得到小箭头的旋转方向应该为:rotation = angle + Math.PI / 2;
目前为止我们解决了Spark动画中的两大问题,剩下了最后一个:拖尾效果。看起来由粗到细这段就是拖尾效果。

实际上为了保证在移动端的性能,本次实例中并没有明显的拖尾。但拖尾还是一个比较常见的特效,所以我们需要把它掌握。拖尾效果一般是对一个元素进行多次复制,并线性的渐变这队影元素的大小宽度以及颜色的透明度在达到由粗到细由大到小颜色有深变浅的效果。那么每次绘制时候都需要知道这队影元素每个的位置,每个的线宽以及每个的颜色,根据上面讨论的元素位置需要根据弧度来确定。我们说过他们的位置是渐变的,渐变的步长可以这样指定,假设从头到尾的弧长为80,那么每个影元素的之间的间隔为:
this.deltaAngle = (80 / Math.min(this.radius, 400)) / this.tailPointsCount;
由此便可绘制出拖尾效果:
// 拖尾效果
      var count = this.tailPointsCount;
      for (var i = 0;  i < count; i++) {
        var arcColor = utils.calculateColor(this.strokeStyle, 0.3-0.3/count*i);
        var tailLineWidth = 5;
        if (this.trailAngle - this.deltaAngle * i > this.startAngle)  {
          this.drawArc(context, arcColor,
            tailLineWidth - tailLineWidth / count * i,
            this.trailAngle - this.deltaAngle * i,
            this.trailAngle
          );
        }
      }
所以整个Spark的代码如下:


var Spark = (function() {
    var S = function(options) {
      var startX = options.startX,
      startY = options.startY,
      endX = options.endX,
      endY = options.endY;

      //两点之间的圆有多个,通过两点及半径便可以定出两个圆,根据需要选取其中一个圆
      var L = Math.sqrt(Math.pow(startX - endX, 2) + Math.pow(startY - endY, 2));
      var m = (startX + endX) / 2; // 横轴中点
      var n = (startY + endY) / 2; // 纵轴中点
      var factor = 1.5;

      var centerX = (startY - endY) * factor + m;
      var centerY = (endX - startX) * factor + n;

      var radius = Math.sqrt(Math.pow(L / 2, 2) + Math.pow(L * factor, 2));
      var startAngle = Math.atan2(startY - centerY, startX - centerX);
      var endAngle = Math.atan2(endY - centerY, endX - centerX);

      // 保证Spark的弧度不超过Math.PI
      if (startAngle * endAngle < 0) {
        if (startAngle < 0) {
          startAngle += Math.PI * 2;
          endAngle += Math.PI * 2;
        } else {
          endAngle += Math.PI * 2;
        }
      }

      this.tailPointsCount = 5; // 拖尾点数
      this.centerX = centerX;
      this.centerY = centerY;
      this.startAngle = startAngle;
      this.endAngle = endAngle;
      this.radius = radius;
      this.lineWidth = options.width || 5;
      this.strokeStyle = options.color || '#000';
      this.factor = 2 / this.radius;
      this.deltaAngle = (80 / Math.min(this.radius, 400)) / this.tailPointsCount;
      this.trailAngle = this.startAngle;
      this.arcAngle = this.startAngle;

      this.animateBlur = true;

      this.marker = new Marker({
        x: 50,
        y:80,
        rotation: 50 * Math.PI / 180,
        style: 'arrow',
        color: 'rgb(255, 255, 255)',
        size: 2,
        borderWidth: 0,
        borderColor: this.strokeStyle
      });
    };

    S.prototype.drawArc = function(context, strokeColor, lineWidth, startAngle, endAngle) {
      context.save();
      context.lineWidth = lineWidth;
      // context.lineWidth = 5;
      context.strokeStyle = strokeColor;
      context.shadowColor = this.strokeStyle;
      // context.shadowBlur = 5;
      context.lineCap = "round";
      context.beginPath();
      context.arc(this.centerX, this.centerY, this.radius, startAngle, endAngle, false);
      context.stroke();
      context.restore();
    };

    S.prototype.draw = function(context) {
      var endAngle = this.endAngle;
      // 匀速
      var angle = this.trailAngle + (endAngle - this.startAngle) * this.factor;
      var strokeColor = this.strokeStyle;
      if (this.animateBlur) {
        this.arcAngle = angle;
      }
      this.trailAngle = angle;
      strokeColor = utils.calculateColor(strokeColor, 0.1);

      this.drawArc(context, strokeColor, this.lineWidth, this.startAngle, this.arcAngle);

      // 拖尾效果
      var count = this.tailPointsCount;
      for (var i = 0;  i < count; i++) {
        var arcColor = utils.calculateColor(this.strokeStyle, 0.3-0.3/count*i);
        var tailLineWidth = 5;
        if (this.trailAngle - this.deltaAngle * i > this.startAngle)  {
          this.drawArc(context, arcColor,
            tailLineWidth - tailLineWidth / count * i,
            this.trailAngle - this.deltaAngle * i,
            this.trailAngle
          );
        }
      }

      context.save();
      context.translate(this.centerX, this.centerY);
      this.marker.x = Math.cos(this.trailAngle) * this.radius;
      this.marker.y = Math.sin(this.trailAngle) * this.radius;
      this.marker.rotation = this.trailAngle + Math.PI / 2;
      this.marker.draw(context);
      context.restore();

      if ((endAngle - this.trailAngle) * 180 / Math.PI < 0.5) {
        this.trailAngle = this.startAngle;
        this.animateBlur = false;
      }
    };

    return S;
  })();
到目前为止,迁徙图中主要的技术难点就已经讲完了。但如何把它放到地图上,这个问题我们将在下篇文章中讨论。