https://github.com/garrettj403/SciencePlots
Demo
import numpy as np
import matplotlib.pyplot as plt
import matplotlib
matplotlib.matplotlib_fname()

def model(x, p):
    return x ** (2 * p + 1) / (1 + x ** (2 * p))

plt.style.available
['Solarize_Light2',
 '_classic_test_patch',
 'bmh',
 'bright',
 'classic',
 'dark_background',
 'fast',
 'fivethirtyeight',
 'ggplot',
 'grayscale',
 'grid',
 'high-contrast',
 'high-vis',
 'ieee',
 'light',
 'muted',
 'no-latex',
 'notebook',
 'pgf',
 'retro',
 'scatter',
 'science',
 'seaborn',
 'seaborn-bright',
 'seaborn-colorblind',
 'seaborn-dark',
 'seaborn-dark-palette',
 'seaborn-darkgrid',
 'seaborn-deep',
 'seaborn-muted',
 'seaborn-notebook',
 'seaborn-paper',
 'seaborn-pastel',
 'seaborn-poster',
 'seaborn-talk',
 'seaborn-ticks',
 'seaborn-white',
 'seaborn-whitegrid',
 'std-colors',
 'tableau-colorblind10',
 'vibrant']
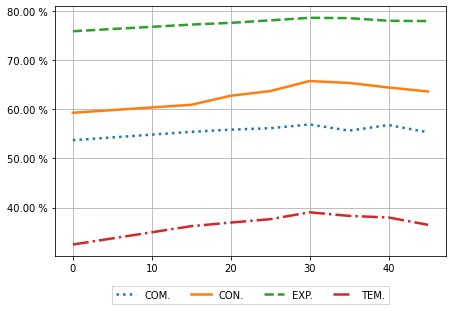
# -- coding: gbk --

x = np.array( [0, 15, 20, 25, 30, 35, 40, 45])

with plt.style.context(['no-latex']):
    pred = np.array([[53.71, 55.41, 55.86, 56.15, 56.92, 55.65, 56.80, 55.31],
                     [59.30, 60.92, 62.76, 63.72, 65.76, 65.37, 64.44, 63.63],
                     [75.90, 77.26, 77.61, 78.12, 78.64, 78.57, 78.03, 77.97],
                     [32.46, 36.20, 36.93, 37.62, 39.02, 38.29, 37.97, 36.47]
             ])
    styles = [':', '-', '--', '-.']
    for p, style in zip(pred, styles):
        plt.plot(x, p, label=x, linestyle=style, linewidth=2.5)

    #定义自定义字体,文件名从1.b查看系统中文字体中来
    myfont = matplotlib.font_manager.FontProperties(fname='/home/zjdou/anaconda3/envs/Pytorch/lib/python3.6/site-packages/matplotlib/mpl-data/fonts/ttf/simhei.ttf')
    #解决负号'-'显示为方块的问题
#     matplotlib.rcParams['axes.unicode_minus']=False
#     plt.title(u'中文', fontproperties=myfont, fontdict={'weight':'normal','size': 20})
#     plt.title(u'模型在不同遮蔽比例下的表现')

    plt.grid(True)
    plt.tight_layout()

    import matplotlib.ticker as mticker
    plt.gca().yaxis.set_major_formatter(mticker.FormatStrFormatter('%.2f %%'))
    plt.legend(['COM.', 'CON.', 'EXP.', 'TEM.'], loc='upper center', bbox_to_anchor=(0.5, -0.1),fancybox=False, shadow=False, ncol=4)

    plt.show()
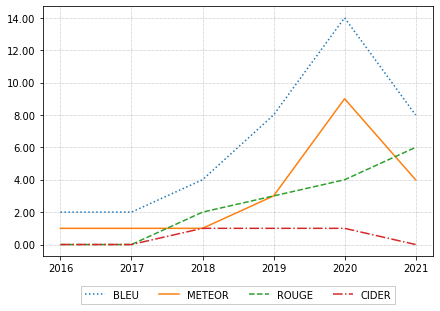
Demo2
- 数据样式
Year BLEU METEOR ROUGE CIDER
2016 2 1 0 0
2017 2 1 0 0
2018 4 1 2 1
2019 8 3 3 1
2020 14 9 4 1
2021 8 4 6 0
with plt.style.context(['grid']):

    styles = [':', '-', '--', '-.']
    for d, s in zip(data.columns[1:], styles):
        plt.plot(data['Year'], data[d], label=data[d], linestyle=s, linewidth=1.5)

    #定义自定义字体,文件名从1.b查看系统中文字体中来
    myfont = matplotlib.font_manager.FontProperties(fname='/home/zjdou/anaconda3/envs/Pytorch/lib/python3.6/site-packages/matplotlib/mpl-data/fonts/ttf/simhei.ttf')
    #解决负号'-'显示为方块的问题
#     matplotlib.rcParams['axes.unicode_minus']=False
#     plt.title(u'中文', fontproperties=myfont, fontdict={'weight':'normal','size': 20})
#     plt.title(u'模型在不同遮蔽比例下的表现')

    plt.grid(True)
    plt.tight_layout()

    import matplotlib.ticker as mticker
    plt.gca().yaxis.set_major_formatter(mticker.FormatStrFormatter('%.2f'))
    plt.legend(['BLEU', 'METEOR', 'ROUGE', 'CIDER'], loc='upper center', bbox_to_anchor=(0.5, -0.1),fancybox=False, shadow=False, ncol=4)
#     plt.legend(['BLEU', 'METEOR', 'ROUGE', 'CIDER'])

#     plt.savefig('plot2.pdf')


    plt.show()