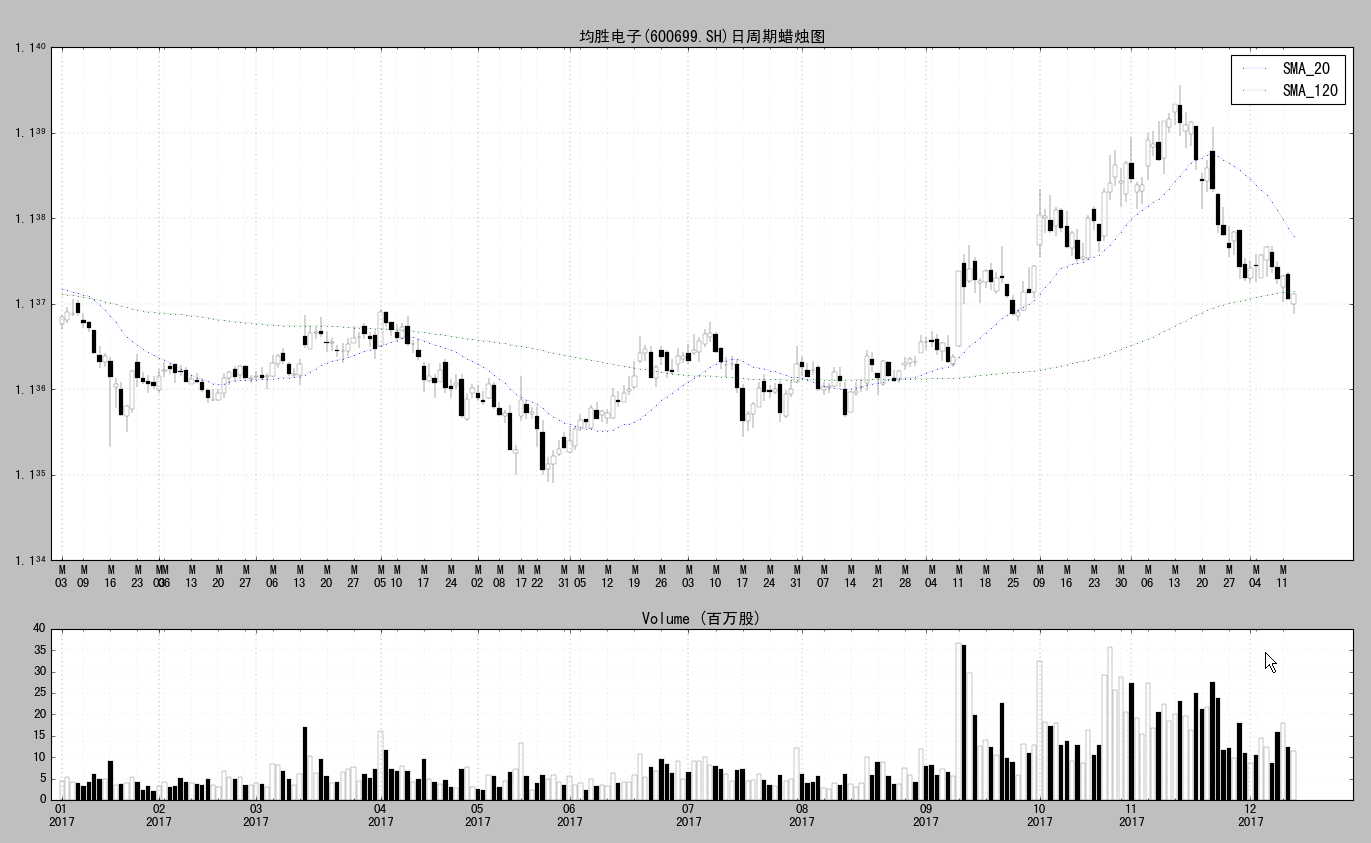
用matplotlib制作的比较满意的蜡烛图
2D图形制作包, 功能强大, 习练了很久, 终于搞定了一个比较满意的脚本.
特点:
- 使用方面要非常简单
- 绘制出来的图要非常的满意, 具有如下的特点
- 时间和空间的比例尺需要固定, 就是说图件的大小需要依据数据的长度和价格的变动幅度自动调整, 至少时间轴上应该如此.
- 时间轴的刻度: 对于日线图而言, 年/月/日/星期几 都应该一目了然.
- Y轴: 对数刻度, 10%等比刻度线, 刻度值的标签应该能反应绝对的股价, 支持双Y轴(右侧的Y轴度量大盘的变化)
- 蜡烛非白即黑, 只要两种颜色(包括边界线)
- 分辨率要足够高, 至少300DPI, 方便原样(无伸缩)打印
- 应该支持非常方便地抽取子集, 然后制图
版本持续升级:
2017.12 的备忘录
在以前的函数式代码的基础上, OOP方式重构代码, 方便以后扩展功能, 也让程序运行得更健硕
结果展示
主块代码
绘图模块的代码
结果展示:
png file from my github:
https://github.com/duanqingshan/learngit/blob/master/均胜电子_20171230_182515__468000.png
gif file from my cnblogs:
https://files.cnblogs.com/files/duan-qs/均胜电子_20171226_220616__255000.gif
主代码块:
# -*- coding: utf-8 -*-

u''' 研究K线形态: 从单个K线做起, 然后K线组合, 然后K线形态
# 1. 定义两个实例
# 2. 加载数据
# 3. 前复权处理
# 4. 计算指标
# 5. 形态研究之: 提取与显示
# 6. 绘图  主图+成交量图
'''

import amipy as ami
import plotter as pl
import pattern as pa
reload(pa)
reload(ami)

context = ami.Context('600699.SH')  # 000911
#context = ami.Context('002242.SZ')  # 000911
stk = ami.Stock(context)

stk.grab_data_tdxlday(context, num_days=None)
stk.load_tdx_qx()

stk.qfq()

stk.ma20 = ami.TTR.sma(stk.ohlc.close, 20)
stk.cyc61 = ami.TTR.sma(stk.ohlc.close, 120)

pattern = pa.Pattern(stk)
pattern.study_csyx(roc1=0.3/100)

#subset = slice(-250*3, None) # '2017-07'  '2017'
subset = slice(-120,None) # '2017-07'  '2017'
plotter = pl.Plotter(context,stk,subset,quanxi=None)
#    plotter.plot_candle_vol()
#plotter.plot_candle_vol(savefig=True)

#plotter.plot_timing(timing=pattern.csyx)
#plotter.plot_timing(timing=pattern.szx)
plotter.plot_timing(timing=pattern.upgap, savefig=True)
#plotter.plot_timing(timing=pattern.dngap)
绘图代码:
# -*- coding: utf-8 -*-

#import sys

import numpy as np
import pandas as pd

import datetime

import matplotlib
import matplotlib.pyplot as plt
from matplotlib.ticker import (
        FixedLocator,
        #MultipleLocator,
        #LogLocator,

        #NullFormatter,
        FuncFormatter,
        #LogFormatter
        )
from matplotlib.font_manager import FontProperties
from matplotlib.text import Text
myfont = FontProperties(fname=r"c:windowsfontsmsyh.ttf")  #size可不用指定
matplotlib.rcParams['axes.unicode_minus'] = False

#import amipy as ami
import ttr as TTR

#==============================================================================
# Python中的作用域及global用法 - Summer_cool - 博客园
# https://www.cnblogs.com/summer-cool/p/3884595.html
#
# 函数定义了本地作用域,而模块定义的是全局作用域。
# 如果想要在函数内定义全局作用域,需要加上global修饰符。
#
# 变量名解析:LEGB原则
# 当在函数中使用未认证的变量名时,Python搜索4个作用域:
#     [本地作用域(L-local)(函数内部声明但没有使用global的变量),
#      之后是上一层结构def或者lambda的本地作用域(E-enclosure),
#      之后是全局作用域(G-global)(函数中使用global声明的变量或在模块层声明的变量),
#      最后是内置作用域(B)(即python的内置类和函数等)]
#      并且在第一处能够找到这个变量名的地方停下来。
#      如果变量名在整个的搜索过程中都没有找到,Python就会报错。
#
# 补:上面的变量规则只适用于简单对象,当出现引用对象的属性时,则有另一套搜索规则:
#     属性引用搜索一个或多个对象,而不是作用域,并且有可能涉及到所谓的"继承"
# 补2:global修饰符在python里的一个独特现象:
#     在模块层面定义的变量(无需global修饰),
#     如果在函数中没有再定义同名变量,可以在函数中当做全局变量使用.
#     如果在函数中要对它重新赋值的话, 则必须在本函数中事先声明为全局变量, 否则会抛出异常.
#
#     #先声明全局本函数里用到的全局变量: 图表, 上下文, 股票对象
#     #使用global语句可以清楚地表明变量是在外面的块定义的, 而且在本函数内
#     #可以使用或者修改这些变量(前提是必须先声明为全局变量, 以便告诉python
#     #解释器这些变量是全局的(主块和函数块共有的)已经是在外部--主代码块里--定义好了的,
#     # 或者是本代码块要传递到主代码块里的变量).
#==============================================================================

class Plotter(object):
    u'''
    Plotter class to make picture of stock's ohlcv data
    '''
    # define class var
    ptype_dict={
        'lday':u'日',
        'lc5':u'五分钟'} # 这里声明的变量, 不用加global修饰符, 也是全局变量


    def __init__(self, context, stk, subset, quanxi=None):
        self.context = context
        self.stk = stk
        self.subset = subset
        self.quanxi = quanxi
        self.fig = None
        self.ax1 = self.ax2 = self.ax3 = None
        self.candle_colors = None
        self.length = None
        self.x = None

    def plot_candle_only(self, savefig=False):
        u'''仅绘制主图
        '''
        self.layout(volume_bars=False)
        self.candles()
        self.primary_curves()
        self.savfig(savefig)
        #fig #在ipython console里显示整个图表

    def plot_candle_vol(self, savefig=False):
        u'''主图+成交量图
        '''
        self.layout(volume_bars=True)
        self.candles()
        self.primary_curves()
        self.vol_bars()
        self.savfig(savefig)
        pass

    def plot_timing(self, timing=None, savefig=False):
        u'''画图: timing之K线性形态
            candles + (MA20, MA120) + 形态标注
            volume bar
        para:
            timing: Series,
            note: str, {'csyx', 'szx', etc}, 长上影线, 十字星等

        '''
        self.layout(volume_bars=True)
        self.candles()
        self.primary_curves()
        self.vol_bars()
        self.annotate(timing)
        self.savfig(savefig)


    def layout(self, volume_bars=True):
        u'''

        '''
        if volume_bars:
            self.fig, (self.ax1, self.ax2) = plt.subplots(2, 1, sharex=True, gridspec_kw={'height_ratios': [3,1]} )
        else:
            self.fig,self.ax1 = plt.subplots(1,1)
            #res = fig, ax1
        #return res

    def candles(self,
                col_func=None):
        u'''

        subset:
            slice object, slice(start,stop,step)
            that is:
                slice(100)
                slice(-100,None)
                slice(100,200)
                slice(-200,-100,2)
                '2011-09'
                '2017'
        '''

        def default_col_func(index, open1, close, low, high):
            return 'black' if open1[index] > close[index] else 'white' # r g b  cyan black white

        subset=self.subset
        col_func= col_func or default_col_func
        ohlc = self.stk.ohlc[subset] if self.subset else self.stk.ohlc
        open1,high,low,close = ohlc.open, ohlc.high, ohlc.low, ohlc.close
        self.length = length = len(close)
        self.x = x = np.arange(length)
        candle_colors = [col_func(i, open1, close, low, high) for i in x]
        self.candle_colors = candle_colors
        # 计算出 每日的开盘价/收盘价里的最大值和最小值
        oc_min = pd.concat([open1, close], axis=1).min(axis=1)
        oc_max = pd.concat([open1, close], axis=1).max(axis=1)

        #candles = ax1.bar(x, oc_max-oc_min, bottom=oc_min, color=candle_colors, linewidth=0)
        #lines = ax1.vlines(x + 0.4, low, high, color=candle_colors, linewidth=1)
        candles = self.ax1.bar(x-0.4, oc_max-oc_min, bottom=oc_min, color=candle_colors, linewidth=0.2, edgecolor='black')
        shadlines_up = self.ax1.vlines(x,    oc_max, high, color=['black']* length, linewidth=0.3)
        shadlines_dn = self.ax1.vlines(x,    low, oc_min,  color=['black']* length, linewidth=0.3)
        #print candles.__class__, shadlines_up.__class__, shadlines_dn.__class__
        isinstance(candles,      matplotlib.container.BarContainer) == True
        isinstance(shadlines_dn, matplotlib.collections.LineCollection)
        isinstance(shadlines_up, matplotlib.collections.LineCollection)

        self.custom_figure()
        self.custom_yaxis()
        pass

    def primary_curves(self): #subset=None):
        #ohlc = stk.ohlc[subset] if subset else stk.ohlc
        #close = ohlc.close
        subset = self.subset
        if (isinstance(self.stk.ma20, pd.Series) and isinstance(self.stk.cyc61, pd.Series)):
            ma20 = self.stk.ma20[subset] if subset else self.stk.ma20
            cyc61 = self.stk.cyc61[subset] if subset else self.stk.cyc61
            indicators = [ma20, cyc61]
            x=self.x
            for ind in indicators:
                self.ax1.plot(x, ind, 'o-', lw=0.1, markersize=0.7, markeredgewidth=0.1, label=ind.name) #带圆圈标记的实线
            self.ax1.legend()

        self.custom_xaxis(ax=self.ax1)


    def secondary_curves(self, ax):
    #    ohlc = stk.ohlc[subset] if subset else stk.ohlc
        pass

    def vol_bars(self):
        u'''

        '''
        subset = self.subset
        ohlc = self.stk.ohlc[subset] if subset else self.stk.ohlc
        volume = ohlc['volume']
        #open1,high,low,close = ohlc.open, ohlc.high, ohlc.low, ohlc.close
        x = self.x

        volume_scale = None
        scaled_volume = volume
        if volume.max() > 1000*1000:
            volume_scale = u'百万股' #'M'
            scaled_volume = volume / 1000.0/1000.0
        elif volume.max() > 1000:
            volume_scale = u'千股'
            scaled_volume = volume / 1000.0
        self.ax2.bar(x-0.4, scaled_volume, color=self.candle_colors, linewidth=0.2, edgecolor='black')
        volume_title = 'Volume'
        if volume_scale:
            volume_title = 'Volume (%s)' % volume_scale
        #ax2.set_title(volume_title) # 太难看了
        self.ax2.set_ylabel(volume_title, fontdict=None)
        self.ax2.xaxis.grid(False)
        #plt.setp(ax.get_xticklabels(minor=False), fontsize=6)

        self.custom_xaxis(self.ax2)

        pass

    def annotate(self, timing):
        u'''在主图上标注给定的K线形态:
        param:
            timing: event of Series of k-pattern
            note: str, 对应于事件的标注文本
        example:
            >>> plotter.annotate(csyx) #长上影线
        '''
        #ax=plt.gca()
        #xx = self.action.p_DJR.index
        c = self.stk.ohlc.close[self.subset] if self.subset else self.stk.ohlc.close
        self.timing = timing[self.subset] if self.subset  else timing
        ptn_dt = c[self.timing].index # True 逻辑选择 选出长上影线的时机(日期索引)
        note = self.note = self.timing.name[:3]
        ax = self.ax1
        xx = map(lambda dt: c.index.get_loc(dt), ptn_dt)
        yy = c * 1.1
        #strings = self.action['value'].values.astype(str)
        #strings = self.action['bonus'].values.astype(str)
        #strings = map(lambda x: u'派'+str(x), strings)
        for i,x in enumerate(xx):
            #ax.text(x, yy[i], strings[i])
            print i, c.index[x], x, yy[x], c[x]
            ax.annotate(note, xy=(x, yy[x]*1.05/1.1), xytext=(x, yy[x]+0.0),
                        arrowprops=dict(
                                facecolor='black',
                                color='red',
                                #shrink=0.05,
                                arrowstyle='->',
                                ),)


    def custom_yaxis(self):
        u'''
        #   设定 Y 轴上的刻度
        #==================================================================================================================================================
        python - Matplotlib log scale tick label number formatting - Stack Overflow
        https://stackoverflow.com/questions/21920233/matplotlib-log-scale-tick-label-number-formatting
        每个坐标轴都有7大属性:
            ax1.set_yscale, ylim, ylabel, yticks, yticklabels, ybound, ymargin
        '''
        #use_expo=True;
        expbase=1.1  # 2 e 10
        yaxis= self.ax1.get_yaxis()
        isinstance(yaxis, matplotlib.axis.YAxis)
        self.ax1.set_yscale(value='log', basey=expbase)
        pass

    def custom_figure(self):
        u'''  '''
        # 依据绘图数据的长度和时间轴的比例尺(比如1:16)确定图表的长度:
        #fig = plt.gcf()
        #fig.set_size_inches(18.5, 10.5)
        self.fig.set_size_inches(self.length/16.0, 6) # /18 /20 /16 diff time-scales

        title = u'%s(%s)%s周期蜡烛图'%(self.context.name, self.context.symbol, self.ptype_dict[self.context.ptype])
        self.ax1.set_title(title)
        pass

    def custom_xaxis(self, ax):
        u'''

        '''
        subset = self.subset
        ohlc = self.stk.ohlc[subset] if subset else self.stk.ohlc
        close = ohlc.close
        length = self.length  # len(close)

        ax.set_xlim(-2, length+10)
        xaxis= ax.get_xaxis()
        yaxis= ax.get_yaxis()
        #   设定 X 轴上的主刻度/次刻度位置
        #==================================================================================================================================================
        mdindex, wdindex, sdindex= self.ohlc_find_idx_fdim(close)
        xMajorLocator= FixedLocator(np.array(mdindex)) # 针对主刻度,实例化一个"固定式刻度定位"
        xMinorLocator= FixedLocator(np.array(wdindex)) # 确定 X 轴的 MinorLocator

        # 确定 X 轴的 MajorFormatter 和 MinorFormatter
        # 自定义的刻度格式(应该是一个function)
        datelist = close.index.date.tolist()
        def x_major_formatter_1(idx, pos=None):
            u'''
            格式函数的功能: idx 是位置location, 依据位置, 返回对应的日期刻度标签
            '''
            #return datelist[idx].strftime('%Y-%m-%d')
            return datelist[idx].strftime('%m
%Y')
        def x_major_formatter_2(idx, pos=None):
            return datelist[idx].strftime('

%m
%Y')

        def x_minor_formatter_1(idx, pos=None):
            #return datelist[idx].strftime(u'一
%d') # 周一
            return datelist[idx].strftime(u'M
%d') # 周一
        def x_minor_formatter_2(idx, pos=None):
            return datelist[idx].strftime('%m-%d')

        xMajorFormatter_1 = FuncFormatter(x_major_formatter_1)
        xMajorFormatter_2 = FuncFormatter(x_major_formatter_2)
        xMinorFormatter_1 = FuncFormatter(x_minor_formatter_1)

        # 设定 X 轴的 Locator 和 Formatter
        xaxis.set_major_locator(xMajorLocator)
        xaxis.set_minor_locator(xMinorLocator)

        xaxis.set_major_formatter(xMajorFormatter_1)
        if self.ax2 is None:
            xaxis.set_major_formatter(xMajorFormatter_2)
        xaxis.set_minor_formatter(xMinorFormatter_1)

        if self.ax2 is None: # 仅绘制主图
            # 设定不显示的刻度标签:
            if ax==self.ax1:
                plt.setp(ax.get_xticklabels(minor=False), visible=True) #主刻度标签 可见
                plt.setp(ax.get_xticklabels(minor=True), visible=True)  #次刻度标签 可见
        elif ((self.ax1 != None) and (self.ax2 != None)): # case of 主图+成交量图
            if ax==self.ax2:
                plt.setp(ax.get_xticklabels(minor=True), visible=False) #次刻度标签 隐藏
            elif ax==self.ax1:
                plt.setp(ax.get_xticklabels(minor=False), visible=False) #主刻度标签 隐藏

        # 设定 X 轴主刻度和次刻度标签的样式(字体大小)
        for malabel in ax.get_xticklabels(minor=False):
            malabel.set_fontsize(12) # 6号也太小了
            #malabel.set_horizontalalignment('right')
            #malabel.set_rotation('45')

        # if ax == ax1 or ax2:
        for milabel in ax.get_xticklabels(minor=True):
            milabel.set_fontsize(12) # 5 太小了
            #milabel.set_horizontalalignment('right')
            #milabel.set_rotation('45')
            #milabel.set_fontdict=myfont
            #milabel.set_fontproperties=myfont
            #milabel.set_prop=myfont


        #   设置两个坐标轴上的 grid
        #==================================================================================================================================================
        #xaxis_2.grid(True, 'major', color='0.3', linestyle='solid', linewidth=0.2)
        xaxis.grid(True, 'major', color='0.3', linestyle='dotted', linewidth=0.3)
        xaxis.grid(True, 'minor', color='0.3', linestyle='dotted', linewidth=0.1)

        #yaxis_2.grid(True, 'major', color='0.3', linestyle='dashed', linewidth=0.2)
        yaxis.grid(True, 'major', color='0.3', linestyle='dotted', linewidth=0.1)
        yaxis.grid(True, 'minor', color='0.3', linestyle='dotted', linewidth=0.1)

        yaxis.get_major_ticks()[2].label =
                Text(0,28.1024,u'28.10 $\mathdefault{1.1^{35}}$')


    def ohlc_find_idx_fdim(self, ohlc):
        u'''
        功能: index of  first trading-day in month
        ------
        - 获取每个月的第一个交易日的下标(又称0轴索引).
          从数据框的时间索引里提取对应的日期, 然后检索出下标.
        - 另外, 也获取每个交易周的第一个交易日的下标

        输入:
        - ohlc: pandas数据框

        返回:
        - list

        例子:
        -------
        >>>  mdindex, wdindex, sdindex= ohlc_find_idx_fdim(ohlc_last60)

        '''
        #datelist= [ datetime.date(int(ys), int(ms), int(ds)) for ys, ms, ds in [ dstr.split('-') for dstr in pdata[u'日期'] ] ]
        #last60 = ohlc[-250:]
        last60 = ohlc
        datelist = last60.index.date.tolist()
        # 确定 X 轴的 MajorLocator
        mdindex= [] # 每个月第一个交易日在所有日期列表中的 index, 月日期索引
        years= set([d.year for d in datelist])  # 所有的交易年份

        for y in sorted(years):
            months= set([d.month for d in datelist if d.year == y])     # 当年所有的交易月份
            for m in sorted(months):
                monthday= min([dt for dt in datelist if dt.year==y and dt.month==m])    # 当月的第一个交易日
                mdindex.append(datelist.index(monthday))

        wdindex =[] # weekday index, 每周的第一个交易日的索引
        for y in sorted(years):
            weeknum= set([int(d.strftime('%U')) for d in datelist if d.year==y])
            for w in sorted(weeknum):
                wd= min([dt for dt in datelist if dt.year==y and int(dt.strftime('%U'))==w])
                wdindex.append(datelist.index(wd))

        #==============================================================================
        # wdindex= [] # 每周第一个交易日在所有日期列表中的 index, 每周的第一个交易日的索引
        # for d in datelist:
        #     if d.weekday() == 0: wdindex.append(datelist.index(d))
        #
        #==============================================================================

        # ===  检索每个季末交易日的下标: sdindex:  end of season day index   ===
        # 对ndarray or list  进行逻辑运输时, 需要用np.logical_or()方法才是正确的方法:
        #filter1=  (months==3) or (months==6)
        #filter1=  (months==3).tolist() or (months==6).tolist()
        #ValueError: The truth value of an array with more than one element is ambiguous. Use a.any() or a.all()
        dt= last60.index.date # 得到ndarray of date,
        # dti= last60.index     # 得到pd.ts.index.DtetimeIndex of date,
        months= last60.index.month #得到ndarray of month, 取值范围为: 1~12
        # nextbar_m= last60.index.shift(1, freq='D').month # 当移动时间下标时, 数据的频率不能为空
        #  这样做还是有问题的, pd的做法是: 引用未来1 Day的日期, 也就是当前的日期+1day的日期
        #   比如: 当前的日期是        2016-12-30, 2017-01-03
        #         .shift(1)的日期是: 2016-12-31, 2017-01-04
        # ==> 误判了4季末的日期变更线坐标位置
        # 解决办法: 应该让freq= 'per index bar', 查询一下pd的doc吧...
        # 变通办法: .drop first element value or .delete(0) the first location
        #        and then .insert one value at end, to make the same length
        # 变通办法之: 用 freq='BQ', 来生成一个dtindex:
        # pd.date_range(start=mi[0], end=mi[-1], freq='BQ') # BQ	business quarter endfrequency
        # Time Series / Date functionality — pandas 0.19.2 documentation
        # http://pandas.pydata.org/pandas-docs/stable/timeseries.html#offset-aliases
        #
        # === 还有更简洁的办法: 就是dti.quarter属性直接提供了第几个季节   ===
        i_index= last60.index.delete(0)
        i_index= i_index.insert(-1, last60.index[-1])     # -1 表示最后一个下标位置
        nextbar_m= i_index.month #
        endMar= np.logical_and(months==3, nextbar_m==4)
        endJun= np.logical_and(months==6, nextbar_m==7)
        endSep= np.logical_and(months==9, nextbar_m==10)
        endDec= np.logical_and(months==12, nextbar_m==1)

        tmp1= np.logical_or(endMar, endJun)
        tmp2= np.logical_or(endSep, endDec)
        mask= np.logical_or(tmp1, tmp2)
        sdindex= [dt.tolist().index(i) for i in dt[mask] ]

        #print u'
==> 季节变更坐标线:'
        #print u'    每个季末的x轴的位置下标: %r' % sdindex
        #print u'    每个季末的x轴的位置时间: %r' % last60.index[sdindex]

        return mdindex, wdindex, sdindex


    def savfig(self, savefig=False):
        if savefig:
            now = datetime.datetime.now()
            now_s = now.strftime('%Y%m%d_%H%M%S_')
            microsec = str(now.microsecond)
            #fn= '%s_%s_%s.pdf' %(context.name, now_s, microsec )
            #fig.savefig(fn, dpi=300)
            #print u'
==> 该pdf文件被创建: %s' %fn
            fn= '%s_%s_%s.png' %(self.context.name, now_s, microsec )
            self.fig.savefig(fn, dpi=300)
            print u'
==> 该png文件被创建: %s' %fn
        pass


if __name__ == '__main__':
    pass
代码(2017.11)
- 主块代码
- 绘图模块的代码
- 结果展示
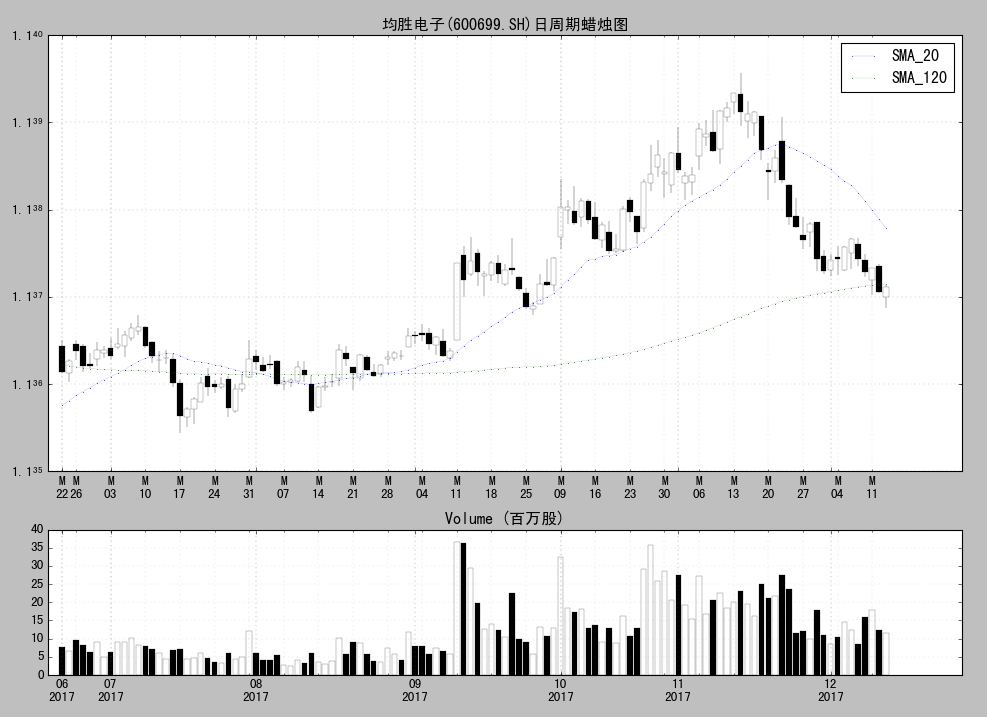
结果展示1:
结果展示2:
主块代码: test1_load.py
# -*- coding: utf-8 -*-

import  pandas as pd

import amipy as ami
reload(ami)
import do_plot as dp
reload(dp)

#context = ami.Context('600699.SH')
context = ami.Context('000911.SZ')
stk = ami.Stock(context) #None,None)
stk.grab_data_tdxlday(context, num_days=None)
stk.ohlc = stk.ohlc_raw

stk.ma20 = ami.TTR.sma(stk.ohlc.close, 20)
stk.cyc61 = ami.TTR.sma(stk.ohlc.close, 120)
subset = slice(-120,None) # '2017-07'  '2017'
subset = '2017' #slice(-120,None) # '2017-07'  '2017'

datas = (context, stk, subset)

# 仅绘制主图
#dp.plot_candle_only(datas)

# 主图+成交量图
dp.plot_candle_vol(datas)
绘图模块代码 do_plot.py
# -*- coding: utf-8 -*-

#import sys

import numpy as np
import pandas as pd

import matplotlib
import matplotlib.pyplot as plt
from matplotlib.ticker import (
        FixedLocator,
        #MultipleLocator,
        #LogLocator,

        #NullFormatter,
        FuncFormatter,
        #LogFormatter
        )
from matplotlib.font_manager import FontProperties
myfont = FontProperties(fname=r"c:windowsfontsmsyh.ttf")  #size可不用指定
matplotlib.rcParams['axes.unicode_minus'] = False

#import amipy as ami


#==============================================================================
# Python中的作用域及global用法 - Summer_cool - 博客园
# https://www.cnblogs.com/summer-cool/p/3884595.html
#
# 函数定义了本地作用域,而模块定义的是全局作用域。
# 如果想要在函数内定义全局作用域,需要加上global修饰符。
#
# 变量名解析:LEGB原则
# 当在函数中使用未认证的变量名时,Python搜索4个作用域:
#     [本地作用域(L-local)(函数内部声明但没有使用global的变量),
#      之后是上一层结构def或者lambda的本地作用域(E-enclosure),
#      之后是全局作用域(G-global)(函数中使用global声明的变量或在模块层声明的变量),
#      最后是内置作用域(B)(即python的内置类和函数等)]
#      并且在第一处能够找到这个变量名的地方停下来。
#      如果变量名在整个的搜索过程中都没有找到,Python就会报错。
#
# 补:上面的变量规则只适用于简单对象,当出现引用对象的属性时,则有另一套搜索规则:
#     属性引用搜索一个或多个对象,而不是作用域,并且有可能涉及到所谓的"继承"
# 补2:global修饰符在python里的一个独特现象:
#     在模块层面定义的变量(无需global修饰),
#     如果在函数中没有再定义同名变量,可以在函数中当做全局变量使用.
#     如果在函数中要对它重新赋值的话, 则必须在本函数中事先声明为全局变量, 否则会抛出异常.
#
#     #先声明全局本函数里用到的全局变量: 图表, 上下文, 股票对象
#     #使用global语句可以清楚地表明变量是在外面的块定义的, 而且在本函数内
#     #可以使用或者修改这些变量(前提是必须先声明为全局变量, 以便告诉python
#     #解释器这些变量是全局的(主块和函数块共有的)已经是在外部--主代码块里--定义好了的,
#     # 或者是本代码块要传递到主代码块里的变量).
#==============================================================================
global fig, ax1, ax2, ax3 # 模块级变量名, 分别代表: 整个图表, 子图1/2/3
global context, stk, subset # 模块级变量名
global candle_colors, length
ax2=ax3=None #初始化 ax2/ax3 子图实例为None,
             #fig和ax1可以不用初始化, 因为调用layout()后总是要返回fig和ax1的
ptype_dict={
        'lday':u'日',
        'lc5':u'五分钟'} # 这里声明的变量, 不用加global修饰符, 也是全局变量

def layout(volume_bars=True):
    u'''

    '''
    global fig, ax1, ax2, ax3
    if volume_bars:
        fig, (ax1, ax2) = plt.subplots(2, 1, sharex=True, gridspec_kw={'height_ratios': [3,1]} )
        res = fig, (ax1,ax2)
    else:
        fig,ax1 = plt.subplots(1,1)
        res = fig, ax1
    return res

def candles(
            #subset=None,
            col_func=None):
    u'''

    subset:
        slice object, slice(start,stop,step)
        that is:
            slice(100)
            slice(-100,None)
            slice(100,200)
            slice(-200,-100,2)
            '2011-09'
            '2017'
    '''
    global context, stk, subset
    global candle_colors # 可能会被以后的函数所用到(比如画成交量柱子)
    global length

    def default_col_func(index, open1, close, low, high):
        return 'black' if open1[index] > close[index] else 'white' # r g b  cyan black white

    col_func= col_func or default_col_func
    ohlc = stk.ohlc[subset] if subset else stk.ohlc
    open1,high,low,close = ohlc.open, ohlc.high, ohlc.low, ohlc.close
    length = len(close)
    x = np.arange(length)
    candle_colors = [col_func(i, open1, close, low, high) for i in x]
    # 计算出 每日的开盘价/收盘价里的最大值和最小值
    oc_min = pd.concat([open1, close], axis=1).min(axis=1)
    oc_max = pd.concat([open1, close], axis=1).max(axis=1)

    #candles = ax1.bar(x, oc_max-oc_min, bottom=oc_min, color=candle_colors, linewidth=0)
    #lines = ax1.vlines(x + 0.4, low, high, color=candle_colors, linewidth=1)
    candles = ax1.bar(x-0.4, oc_max-oc_min, bottom=oc_min, color=candle_colors, linewidth=0.2, edgecolor='black')
    shadlines_up = ax1.vlines(x,    oc_max, high, color=['black']* length, linewidth=0.3)
    shadlines_dn = ax1.vlines(x,    low, oc_min,  color=['black']* length, linewidth=0.3)
    #print candles.__class__, shadlines_up.__class__, shadlines_dn.__class__
    isinstance(candles,      matplotlib.container.BarContainer) == True
    isinstance(shadlines_dn, matplotlib.collections.LineCollection)
    isinstance(shadlines_up, matplotlib.collections.LineCollection)

    custom_figure()
    custom_yaxis()
    pass

def primary_curves(): #subset=None):
    #ohlc = stk.ohlc[subset] if subset else stk.ohlc
    #close = ohlc.close
    if (isinstance(stk.ma20, pd.Series) and isinstance(stk.cyc61, pd.Series)):
        ma20 = stk.ma20[subset] if subset else stk.ma20
        cyc61 = stk.cyc61[subset] if subset else stk.cyc61
        length = len(ma20)
        x = np.arange(length)
        indicators = [ma20, cyc61]
        for ind in indicators:
            ax1.plot(x, ind, 'o-', lw=0.1, markersize=0.7, markeredgewidth=0.1, label=ind.name) #带圆圈标记的实线
        ax1.legend()

    custom_xaxis(ax=ax1)


def secondary_curves(ax,subset=None):
#    ohlc = stk.ohlc[subset] if subset else stk.ohlc
    pass

def vol_bars():
    u'''

    '''
    global stk, subset
    ohlc = stk.ohlc[subset] if subset else stk.ohlc
    volume = ohlc['volume']
    #open1,high,low,close = ohlc.open, ohlc.high, ohlc.low, ohlc.close
    x = np.arange(length)

    volume_scale = None
    scaled_volume = volume
    if volume.max() > 1000*1000:
        volume_scale = u'百万股' #'M'
        scaled_volume = volume / 1000.0/1000.0
    elif volume.max() > 1000:
        volume_scale = u'千股'
        scaled_volume = volume / 1000.0
    ax2.bar(x-0.4, scaled_volume, color=candle_colors, linewidth=0.2, edgecolor='black')
    volume_title = 'Volume'
    if volume_scale:
        volume_title = 'Volume (%s)' % volume_scale
    ax2.set_title(volume_title)
    ax2.xaxis.grid(False)
    #plt.setp(ax.get_xticklabels(minor=False), fontsize=6)

    custom_xaxis(ax2)

    pass

def custom_yaxis():
    u'''
    #   设定 Y 轴上的刻度
    #==================================================================================================================================================
    python - Matplotlib log scale tick label number formatting - Stack Overflow
    https://stackoverflow.com/questions/21920233/matplotlib-log-scale-tick-label-number-formatting
    '''
    #use_expo=True;
    expbase=1.1  # 2 e 10
    yaxis= ax1.get_yaxis()
    isinstance(yaxis, matplotlib.axis.YAxis)
    ax1.set_yscale(value='log', basey=expbase)
    pass

def custom_figure():
    u'''  '''
    # 依据绘图数据的长度和时间轴的比例尺(比如1:16)确定图表的长度:
    #fig = plt.gcf()
    #fig.set_size_inches(18.5, 10.5)
    fig.set_size_inches(length/16.0, 6) # /18 /20 /16 diff time-scales

    title = u'%s(%s)%s周期蜡烛图'%(context.name, context.symbol, ptype_dict[context.ptype])
    ax1.set_title(title)
    pass

def custom_xaxis(ax):
    u'''

    '''
    global ax1, ax2, ax3
    ohlc = stk.ohlc[subset] if subset else stk.ohlc
    close = ohlc.close
    #length = len(close)

    ax.set_xlim(-2, length+10)
    xaxis= ax.get_xaxis()
    yaxis= ax.get_yaxis()
    #   设定 X 轴上的主刻度/次刻度位置
    #==================================================================================================================================================
    mdindex, wdindex, sdindex= ohlc_find_idx_fdim(close)
    xMajorLocator= FixedLocator(np.array(mdindex)) # 针对主刻度,实例化一个"固定式刻度定位"
    xMinorLocator= FixedLocator(np.array(wdindex)) # 确定 X 轴的 MinorLocator

    # 确定 X 轴的 MajorFormatter 和 MinorFormatter
    # 自定义的刻度格式(应该是一个function)
    datelist = close.index.date.tolist()
    def x_major_formatter_1(idx, pos=None):
        u'''
        格式函数的功能: idx 是位置location, 依据位置, 返回对应的日期刻度标签
        '''
        #return datelist[idx].strftime('%Y-%m-%d')
        return datelist[idx].strftime('%m
%Y')
    def x_major_formatter_2(idx, pos=None):
        return datelist[idx].strftime('

%m
%Y')

    def x_minor_formatter_1(idx, pos=None):
        #return datelist[idx].strftime(u'一
%d') # 周一
        return datelist[idx].strftime(u'M
%d') # 周一
    def x_minor_formatter_2(idx, pos=None):
        return datelist[idx].strftime('%m-%d')

    xMajorFormatter_1 = FuncFormatter(x_major_formatter_1)
    xMajorFormatter_2 = FuncFormatter(x_major_formatter_2)
    xMinorFormatter_1 = FuncFormatter(x_minor_formatter_1)

    # 设定 X 轴的 Locator 和 Formatter
    xaxis.set_major_locator(xMajorLocator)
    xaxis.set_minor_locator(xMinorLocator)

    xaxis.set_major_formatter(xMajorFormatter_1)
    if ax2 is None:
        xaxis.set_major_formatter(xMajorFormatter_2)
    xaxis.set_minor_formatter(xMinorFormatter_1)

    if ax2 is None: # 仅绘制主图
        # 设定不显示的刻度标签:
        if ax==ax1:
            plt.setp(ax.get_xticklabels(minor=False), visible=True) #主刻度标签 可见
            plt.setp(ax.get_xticklabels(minor=True), visible=True)  #次刻度标签 可见
    elif ((ax1 != None) and (ax2 != None)): # case of 主图+成交量图
        if ax==ax2:
            plt.setp(ax.get_xticklabels(minor=True), visible=False) #次刻度标签 隐藏
        elif ax==ax1:
            plt.setp(ax.get_xticklabels(minor=False), visible=False) #主刻度标签 隐藏

    # 设定 X 轴主刻度和次刻度标签的样式(字体大小)
    for malabel in ax.get_xticklabels(minor=False):
        malabel.set_fontsize(12) # 6号也太小了
        #malabel.set_horizontalalignment('right')
        #malabel.set_rotation('45')

    # if ax == ax1 or ax2:
    for milabel in ax.get_xticklabels(minor=True):
        milabel.set_fontsize(12) # 5 太小了
        #milabel.set_horizontalalignment('right')
        #milabel.set_rotation('45')
        #milabel.set_fontdict=myfont
        #milabel.set_fontproperties=myfont
        #milabel.set_prop=myfont


    #   设置两个坐标轴上的 grid
    #==================================================================================================================================================
    #xaxis_2.grid(True, 'major', color='0.3', linestyle='solid', linewidth=0.2)
    xaxis.grid(True, 'major', color='0.3', linestyle='dotted', linewidth=0.3)
    xaxis.grid(True, 'minor', color='0.3', linestyle='dotted', linewidth=0.1)

    #yaxis_2.grid(True, 'major', color='0.3', linestyle='dashed', linewidth=0.2)
    yaxis.grid(True, 'major', color='0.3', linestyle='dotted', linewidth=0.1)
    yaxis.grid(True, 'minor', color='0.3', linestyle='dotted', linewidth=0.1)


def ohlc_find_idx_fdim(ohlc):
    u'''
    功能: index of  first trading-day in month
    ------
    - 获取每个月的第一个交易日的下标(又称0轴索引).
      从数据框的时间索引里提取对应的日期, 然后检索出下标.
    - 另外, 也获取每个交易周的第一个交易日的下标

    输入:
    - ohlc: pandas数据框

    返回:
    - list

    例子:
    -------
    >>>  mdindex, wdindex, sdindex= ohlc_find_idx_fdim(ohlc_last60)

    '''
    #datelist= [ datetime.date(int(ys), int(ms), int(ds)) for ys, ms, ds in [ dstr.split('-') for dstr in pdata[u'日期'] ] ]
    last60 = ohlc[-250:]
    datelist = last60.index.date.tolist()
    # 确定 X 轴的 MajorLocator
    mdindex= [] # 每个月第一个交易日在所有日期列表中的 index, 月日期索引
    years= set([d.year for d in datelist])  # 所有的交易年份

    for y in sorted(years):
        months= set([d.month for d in datelist if d.year == y])     # 当年所有的交易月份
        for m in sorted(months):
            monthday= min([dt for dt in datelist if dt.year==y and dt.month==m])    # 当月的第一个交易日
            mdindex.append(datelist.index(monthday))

    wdindex =[] # weekday index, 每周的第一个交易日的索引
    for y in sorted(years):
        weeknum= set([int(d.strftime('%U')) for d in datelist if d.year==y])
        for w in sorted(weeknum):
            wd= min([dt for dt in datelist if dt.year==y and int(dt.strftime('%U'))==w])
            wdindex.append(datelist.index(wd))

    #==============================================================================
    # wdindex= [] # 每周第一个交易日在所有日期列表中的 index, 每周的第一个交易日的索引
    # for d in datelist:
    #     if d.weekday() == 0: wdindex.append(datelist.index(d))
    #
    #==============================================================================

    # ===  检索每个季末交易日的下标: sdindex:  end of season day index   ===
    # 对ndarray or list  进行逻辑运输时, 需要用np.logical_or()方法才是正确的方法:
    #filter1=  (months==3) or (months==6)
    #filter1=  (months==3).tolist() or (months==6).tolist()
    #ValueError: The truth value of an array with more than one element is ambiguous. Use a.any() or a.all()
    dt= last60.index.date # 得到ndarray of date,
    # dti= last60.index     # 得到pd.ts.index.DtetimeIndex of date,
    months= last60.index.month #得到ndarray of month, 取值范围为: 1~12
    # nextbar_m= last60.index.shift(1, freq='D').month # 当移动时间下标时, 数据的频率不能为空
    #  这样做还是有问题的, pd的做法是: 引用未来1 Day的日期, 也就是当前的日期+1day的日期
    #   比如: 当前的日期是        2016-12-30, 2017-01-03
    #         .shift(1)的日期是: 2016-12-31, 2017-01-04
    # ==> 误判了4季末的日期变更线坐标位置
    # 解决办法: 应该让freq= 'per index bar', 查询一下pd的doc吧...
    # 变通办法: .drop first element value or .delete(0) the first location
    #        and then .insert one value at end, to make the same length
    # 变通办法之: 用 freq='BQ', 来生成一个dtindex:
    # pd.date_range(start=mi[0], end=mi[-1], freq='BQ') # BQ	business quarter endfrequency
    # Time Series / Date functionality — pandas 0.19.2 documentation
    # http://pandas.pydata.org/pandas-docs/stable/timeseries.html#offset-aliases
    #
    # === 还有更简洁的办法: 就是dti.quarter属性直接提供了第几个季节   ===
    i_index= last60.index.delete(0)
    i_index= i_index.insert(-1, last60.index[-1])     # -1 表示最后一个下标位置
    nextbar_m= i_index.month #
    endMar= np.logical_and(months==3, nextbar_m==4)
    endJun= np.logical_and(months==6, nextbar_m==7)
    endSep= np.logical_and(months==9, nextbar_m==10)
    endDec= np.logical_and(months==12, nextbar_m==1)

    tmp1= np.logical_or(endMar, endJun)
    tmp2= np.logical_or(endSep, endDec)
    mask= np.logical_or(tmp1, tmp2)
    sdindex= [dt.tolist().index(i) for i in dt[mask] ]

    #print u'
==> 季节变更坐标线:'
    #print u'    每个季末的x轴的位置下标: %r' % sdindex
    #print u'    每个季末的x轴的位置时间: %r' % last60.index[sdindex]


    return mdindex, wdindex, sdindex

def plot_candle_only(datas):
    u'''仅绘制主图
    '''
    global context, stk, subset
    global fig, ax1, ax2, ax3
    global candle_colors, length
    context, stk, subset = datas

    layout(volume_bars=False)
    candles()
    primary_curves()
    #fig #在ipython console里显示整个图表

def plot_candle_vol(datas):
    u'''主图+成交量图
    '''
    global context, stk, subset
    global fig, ax1, ax2, ax3
    global candle_colors, length
    context, stk, subset = datas

    layout(volume_bars=True)
    candles()
    primary_curves()
    vol_bars()
    pass


if __name__ == '__main__':
    pass