1.提取2010世界人口数据
先查看json文件数据:

这个文件实际上就是一个很长的Python列表,其中每个元素都是一个包含四个键的字典:国家名、国别吗、年份以及表示人口数量的值。
我们尝试打印每个国家2010年的人口数量:
import json

filename="population_data.json"
with open(filename) as f:
    pop_data=json.load(f)

for pop_dict in pop_data:
    if pop_dict['Year']=='2010':
        country_name=pop_dict['Country Name']
        population=pop_dict['Value']
        print(country_name+': '+population)

接下来,我们要将数据转化为Pygal能够处理的格式。
2.将字符串转化为数字值
Python不能直接将包含小数点的字符串转化为整数,为消除这种错误我们可以先将字符串转换为浮点数,再讲浮点数转换为小数:
population=int(float(pop_dict['Value']))
print(country_name+': '+str(population))

可以发现High income的小数被丢弃了。
3.获取两个字母的国别码
Pygal中的地图制作工具要求数据为特定的格式:用国别码表示国家,以及用数字表示人口数量。
因为Pygal使用两个字母的国别码,所以我们需要想办法根据国家名获取两个字母的国别码。
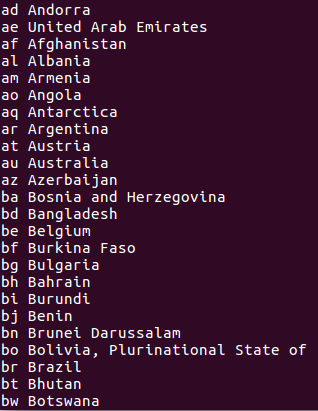
字典COUNTRIES包含的键值分别为两个字母的国别码和国家名,我们可以从模块i18n中导入这个字典,并打印其键和值:
from pygal_maps_world.i18n import COUNTRIES

for country_code in sorted(COUNTRIES.keys()):
    print(country_code,COUNTRIES[country_code])

编写一个获取国别码的函数放在名为country_codes的模块中:
from pygal_maps_world.i18n import COUNTRIES

def get_country_code(country_name):
    for code,name in COUNTRIES.items():
        if name==country_name:
            return code
    return None
修改打印人口数量的代码:
import json

from country_codes import get_country_code

filename="population_data.json"
with open(filename) as f:
    pop_data=json.load(f)

for pop_dict in pop_data:
    if pop_dict['Year']=='2010':
        country_name=pop_dict['Country Name']
        population=int(float(pop_dict['Value']))
        code=get_country_code(country_name)
        if code:
            print(code + ': '+str(population))
        else:
            print('ERROR - ' + country_name)

导致显示错误消息的原因有两个。首先并非所有人口数量对应的都是国家,有些人口数量对应的是地区(阿拉伯世界)和经济类群(所有收入水平),其次有些统计数据使用了不同的完整国家名。
4.制作世界地图
import pygal.maps.world

wm = pygal.maps.world.World()
wm.title = 'North, Central, and South America'

wm.add('North America', ['ca', 'mx', 'us'])
wm.add('Central America', ['bz', 'cr', 'gt', 'hn', 'ni', 'pa', 'sv'])
wm.add('South America', ['ar', 'bo', 'br', 'cl', 'co', 'ec', 'gf',
    'gy', 'pe', 'py', 'sr', 'uy', 've'])

wm.render_to_file('americas.svg')
方法add()接受一个标签和一个列表,其中后者包含我们要突出的国家的国别码。
每次调用用add()都将为指定的国家选择一种新颜色,并在图表左边显示该颜色和指定的标签。

5.绘制完整的世界人口地图
import json

import pygal.maps.world

from country_codes import get_country_code

filename="population_data.json"
with open(filename) as f:
    pop_data=json.load(f)

cc_populations={}
for pop_dict in pop_data:
    if pop_dict['Year']=='2010':
        country_name=pop_dict['Country Name']
        population=int(float(pop_dict['Value']))
        code=get_country_code(country_name)
        if code:
            cc_populations[code]=population

wm=pygal.maps.world.World()
wm.title="World Population in 2010,by Country"
wm.add('2010',cc_populations)

wm.render_to_file('World_population.svg')

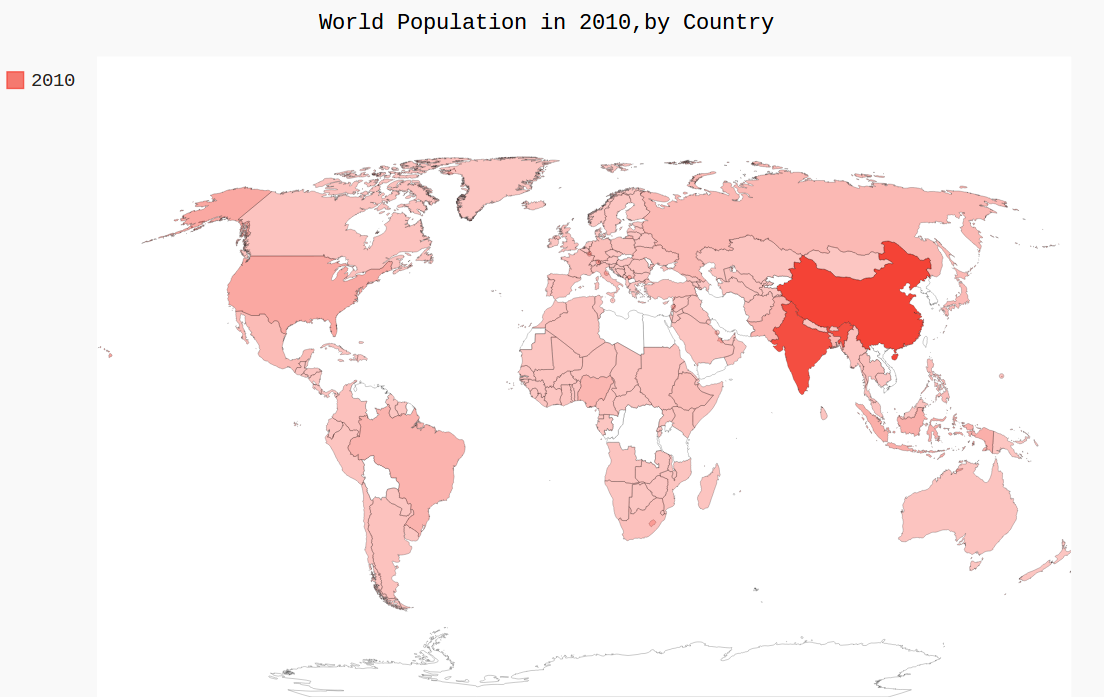
有几个国家没有相关数据,我们将其显示为白色,但对于大多数国家,都根据其人口数量进行了着色。
当前地图中,很多国家都是浅色的,只有两个国家是深色的。对大多数国家而言,颜色深浅差别不足以反映其人口数量的差别。
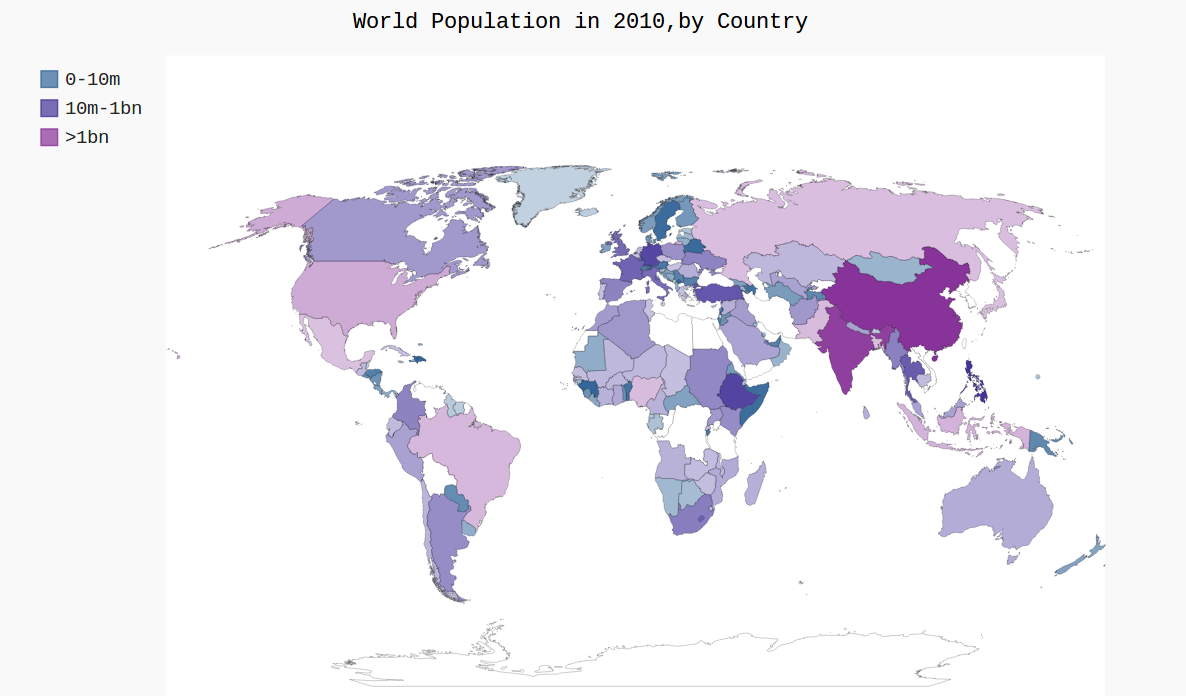
为修复这种问题,我们将根据人口数量将国家分组,再分别对每个组着色:
cc_pops_1,cc_pops_2,cc_pops_3={},{},{}
for cc,pop in cc_populations.items():
    if pop<10000000:
        cc_pops_1[cc]=pop
    elif pop<100000000:
        cc_pops_2[cc]=pop
    else:
        cc_pops_3[cc]=pop
6.使用Pygal设置世界地图的样式
我们从模块中导入了样式RotateStyle,创建这个实例时,需要提供一个参数--十六进制的RGB颜色。
十六进制格式的RGB颜色是一个以井号(#)打头的字符串,后面跟着6个字符,其中前两个表示红色分量,接下来是绿色和蓝色。
这里使用的颜色值(#336699)混合了少量的红色(33)、多一些的绿色(66)和更多一些的蓝色(99),它为RotateStyle提供了一种淡蓝色基色。
加亮颜色主题
Pygal通常默认使用较暗的颜色主题,为方便印刷,我们使用LightColorizedStyle加亮了地图颜色。
这个类修改整个图表的主题,包括背景色、标签以及各个国家的颜色:
from pygal.style import LightColorizedStyle

wm_style=LightColorizedStyle
使用这个类时,不能直接控制使用的颜色,Pygal将选择默认的基色,要设置颜色,可使用RotateStyle,并将LightColorizedStyle作为基本样式。
完整代码:
import json

import pygal.maps.world
from pygal.style import RotateStyle,LightColorizedStyle

from country_codes import get_country_code

filename="population_data.json"
with open(filename) as f:
    pop_data=json.load(f)

cc_populations={}
for pop_dict in pop_data:
    if pop_dict['Year']=='2010':
        country_name=pop_dict['Country Name']
        population=int(float(pop_dict['Value']))
        code=get_country_code(country_name)
        if code:
            cc_populations[code]=population

cc_pops_1,cc_pops_2,cc_pops_3={},{},{}
for cc,pop in cc_populations.items():
    if pop<10000000:
        cc_pops_1[cc]=pop
    elif pop<100000000:
        cc_pops_2[cc]=pop
    else:
        cc_pops_3[cc]=pop

print(len(cc_pops_1),len(cc_pops_2),len(cc_pops_3))

wm_style=RotateStyle('#336699',base_style=LightColorizedStyle)
wm=pygal.maps.world.World(style=wm_style)
wm.title="World Population in 2010,by Country"
wm.add('0-10m',cc_pops_1)
wm.add('10m-1bn',cc_pops_2)
wm.add('>1bn',cc_pops_3)

wm.render_to_file('World_population.svg')
