import numpy as np
import matplotlib.pyplot as plt
#产生测试数据
# x,y为数组
N = 50
x = np.random.rand(N)
y=np.random.randn(len(x))

fig = plt.figure()
ax1 = fig.add_subplot(111)
#设置标题
ax1.set_title('Scatter Plot')
#设置X轴标签
plt.xlabel('X')
#设置Y轴标签
plt.ylabel('Y')
#画散点图
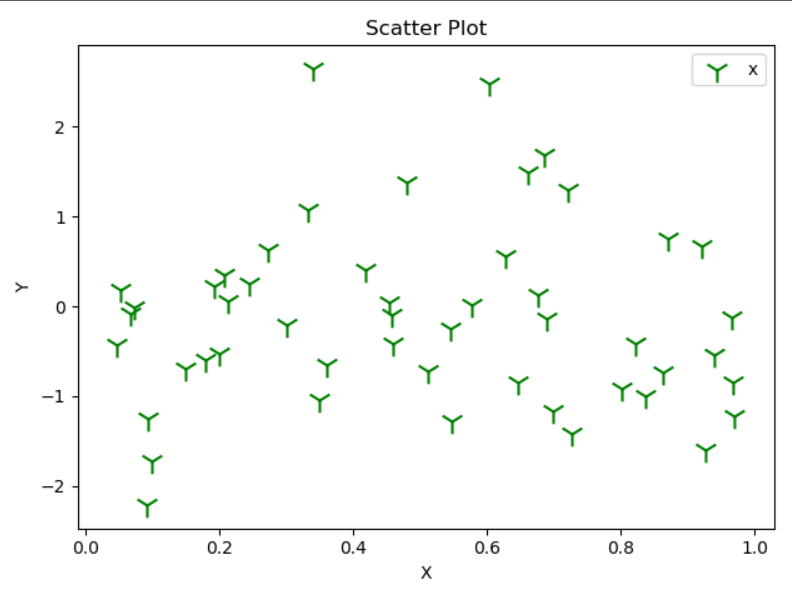
ax1.scatter(x,y,c = 'g',marker = '1',s=200)
#设置图标
plt.legend('x')
#显示所画的图
plt.show()
效果:

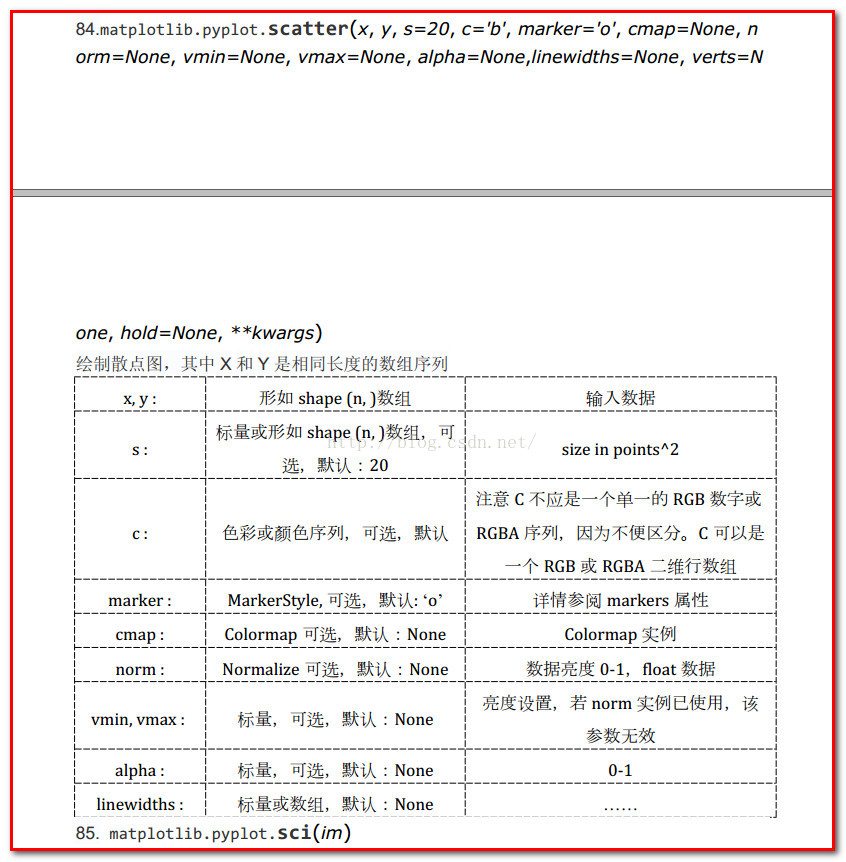
scatter参数汇总:


颜色:
