JDK 提供了一系列用于监控、诊断 Java 进程的工具,它们在 JDK 安装目录的 bin 目录下,有 jps、jcmd、jstack、jinfo、jmap 等。其中jmc、jconsole、jvisualvm 是 GUI 工具,其他大部分都是命令行工具。
cd $JAVA_HOME/bin
ls

本篇只是个入门介绍,不涉及深入分析。每一个工具都有它专门的作用,掌握使用方法只是很简单的入门阶段,更重要的是根据工具得到的信息去分析系统存在的问题以及性能瓶颈,每一个工具的使用和分析都可以单独成文。
jps
如果你用过 Linux,那肯定熟悉 ps 命令,用来查看进程列表的。jps 就好比是 ps 命令的子集,它查询的是当前用户下已经启动的 Java 进程。这是进行线上问题排查的大门钥匙,有了它才能下手后面的动作。
下面是 jps 的帮助文档
usage: jps [-help]
       jps [-q] [-mlvV] [<hostid>]

Definitions:
    <hostid>:      <hostname>[:<port>]
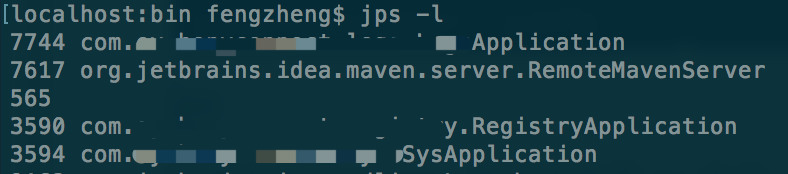
一般的用法是 jps -l,前面一列显示 pid,后面一列显示进程名称。
还可以用下列参数查看更具体的 Java 进程信息,用法为 jps -lv

jstack
查看 Java 进程内当前时刻的线程快照,也就是每条线程正在执行的方法栈情况,用于定位线程停顿、死锁等长时间等待的问题。
以下是 jstack 的帮助文档。
Usage:
    jstack [-l] <pid>
        (to connect to running process)
    jstack -F [-m] [-l] <pid>
        (to connect to a hung process)
    jstack [-m] [-l] <executable> <core>
        (to connect to a core file)
    jstack [-m] [-l] [server_id@]<remote server IP or hostname>
        (to connect to a remote debug server)

Options:
    -F  to force a thread dump. Use when jstack <pid> does not respond (process is hung)
    -m  to print both java and native frames (mixed mode)
    -l  long listing. Prints additional information about locks
    -h or -help to print this help message
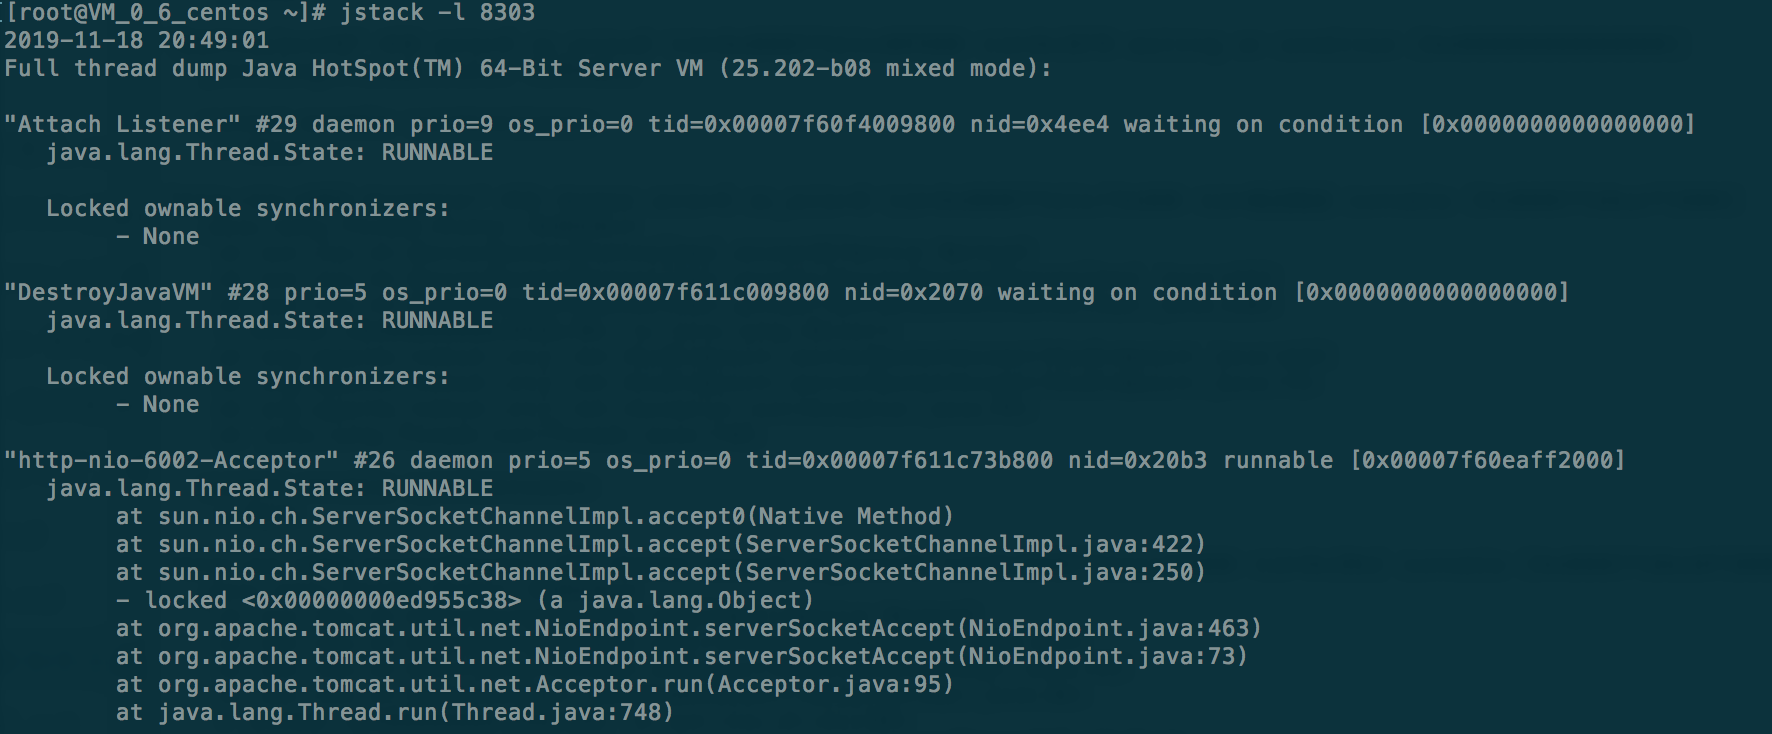
最常用的就是 jstack -pid 或者 jstack -l pid,打印线程状态、栈使用情况。
如果是线上查看不方便的话,可以用命令 jstack -l pid > stack.log,输出到文件中下载到本地查看。
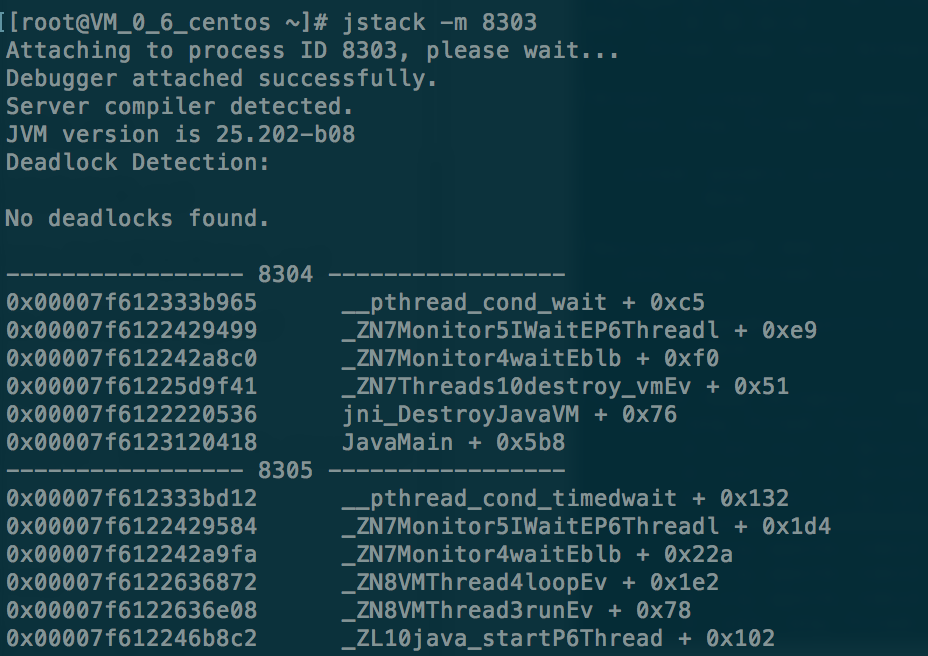
jstack -m pid,打印 Java 和 Native 栈信息
如果 -l 和 -m 都不起作用的时候,可以使用 java -F pid 强制 dump。
jinfo
它的主要作用是查看 JVM 配置参数,还可以动态设置部分参数值。jinfo 使用时需要 attach 到目标 JVM 上。关于 attach jvm 可以点击查看 「Java 调试工具、热部署、JVM 监控工具都用到了它」
使用 jinfo -h查看帮助文档
Usage:
    jinfo [option] <pid>
        (to connect to running process)
    jinfo [option] <executable <core>
        (to connect to a core file)
    jinfo [option] [server_id@]<remote server IP or hostname>
        (to connect to remote debug server)

where <option> is one of:
    -flag <name>         to print the value of the named VM flag
    -flag [+|-]<name>    to enable or disable the named VM flag
    -flag <name>=<value> to set the named VM flag to the given value
    -flags               to print VM flags
    -sysprops            to print Java system properties
    <no option>          to print both of the above
    -h | -help           to print this help message
jinfo -flags pid
查看 JVM 参数,其中 Non-default VM flags 是虚拟机默认设置的参数,Command line 是用户指定的参数,比如命令行启动 jar 包的时候加上的参数。
jinfo -flag 参数名 pid
可以查看指定参数的值,比如查看堆的最大值(-XX:MaxHeapSize 也就是 -Xmx ):
jinfo -flag MaxHeapSize 92041

-XX:MaxHeapSize=20971520
jinfo -sysprops pid
查看系统参数
jinfo pid
查看 jvm 参数和系统参数
以上信息,如果我们用过 visualVM 等监控工具,一定非常熟悉。另外,我之前做过一个 web 版的 JVM 监控器,也实现了这个功能。

另外,还可以修改部分参数值。
jinfo -flag [+|-]
jinfo -flag
可以修改部分 JVM 参数。
前者可以修改布尔值参数,比如开启简单 GC 日志
jinfo -flag +PrintGC 92041
后者是设置非布尔值参数的,比如设置 HeapDumpPath
jinfo -flag HeapDumpPath=/users/fengzheng/jvmlog
哪些参数是允许动态修改的呢,用下面这个命令可以查看
#Linux 和 Mac
java -XX:+PrintFlagsInitial | grep manageable

#windows
java -XX:+PrintFlagsInitial | findstr manageable

jmap
jmap 查看给定进程、核心文件、远程调试服务器的共享对象内存映射和堆内存细节的工具,可查看堆使用情况、堆内对象直方图、加载类、生成堆快照等。
Usage:
    jmap [option] <pid>
        (to connect to running process)
    jmap [option] <executable <core>
        (to connect to a core file)
    jmap [option] [server_id@]<remote server IP or hostname>
        (to connect to remote debug server)

where <option> is one of:
    <none>               to print same info as Solaris pmap
    -heap                to print java heap summary
    -histo[:live]        to print histogram of java object heap; if the "live"
                         suboption is specified, only count live objects
    -clstats             to print class loader statistics
    -finalizerinfo       to print information on objects awaiting finalization
    -dump:<dump-options> to dump java heap in hprof binary format
                         dump-options:
                           live         dump only live objects; if not specified,
                                        all objects in the heap are dumped.
                           format=b     binary format
                           file=<file>  dump heap to <file>
                         Example: jmap -dump:live,format=b,file=heap.bin <pid>
    -F                   force. Use with -dump:<dump-options> <pid> or -histo
                         to force a heap dump or histogram when <pid> does not
                         respond. The "live" suboption is not supported
                         in this mode.
    -h | -help           to print this help message
    -J<flag>             to pass <flag> directly to the runtime system
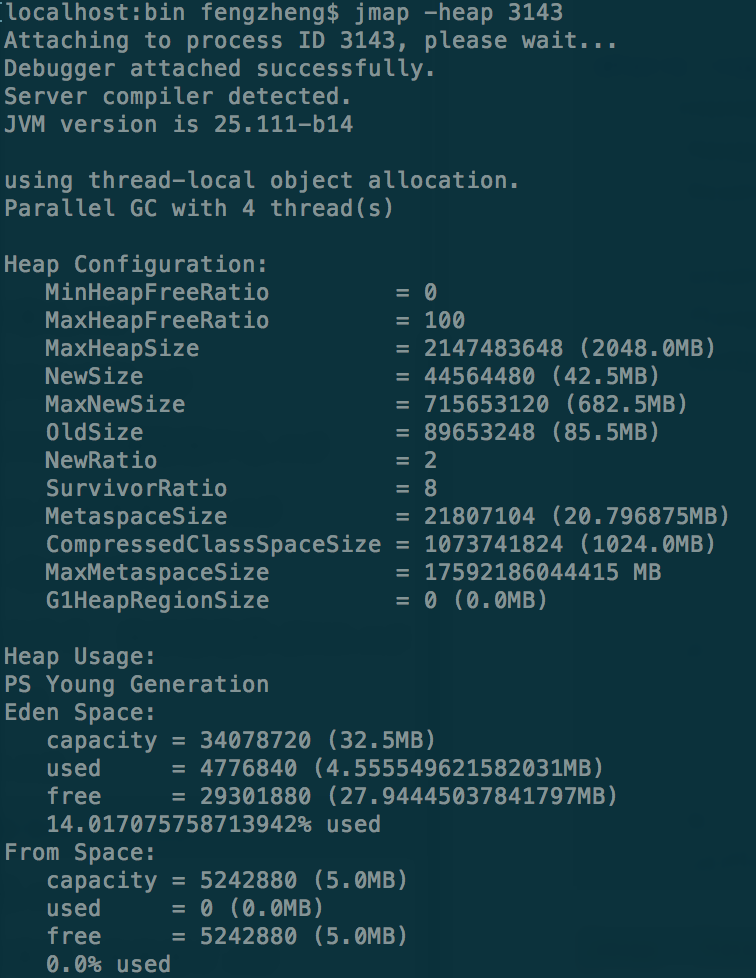
jmap -heap pid
打印 JVM 堆概要信息,包括堆配置、新生代、老生代信息
jmap -histo pid
打印类的直方图,也就是各个类实例的个数和空间占用情况。
如果加 :live,jamp -histo:live pid 则只打印活动类的信息。这个命令会出发 GC 动作,会导致 JVM 停顿,所以在线上环境要慎用。
jmap -dump
dump 当前 JVM 堆,一般用法如下:
#dump 所有对象在堆中的分布情况
jmap -dump:format=b,file=/Users/fengzheng/jvmlog/jamp_dump.hprof 95463

#加:live 参数 dump 存活对象在队中的分布情况
jmap -dump:live,format=b,file=/Users/fengzheng/jvmlog/jamp_dump.hprof 95463
之后再用堆分析工具,比如 visualVM、JProfile、MAT 等进行分析。和我们设置
-XX:+HeapDumpOnOutOfMemoryError 参数后,在发生 OOM 的时候 dump 的堆信息是一样的。
注意,dump 的过程会比较慢,在这个过程中会发生 JVM 停顿,而且在使用 :live 参数后,会触发 GC 操作。
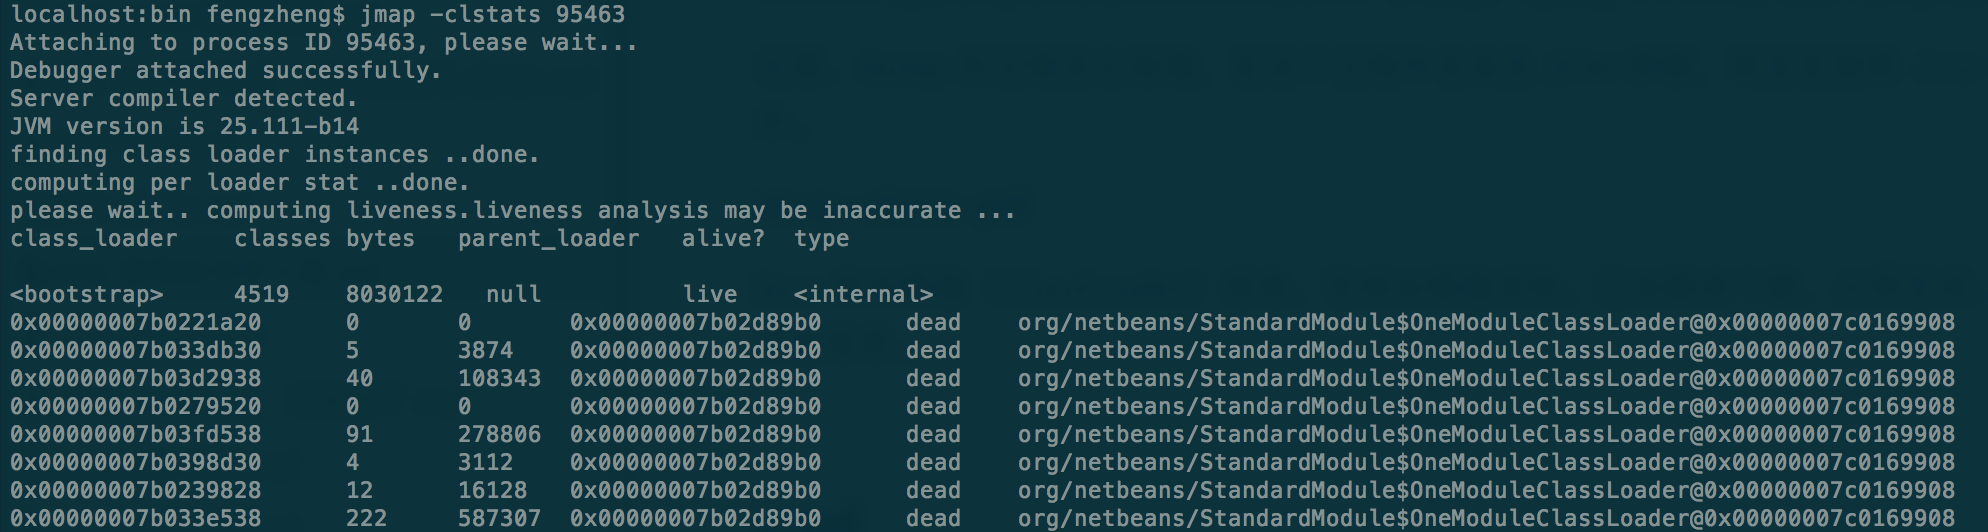
jmap -clstats pid
Java 类加载器(ClassLoader)信息,包括加载器名称、已加载类个数、占用空间、父加载器、是否存活、类型信息。
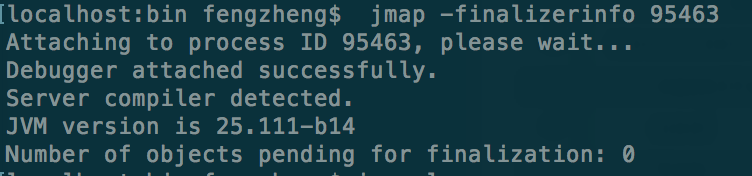
jmap -finalizerinfo pid
查看等待被回收的对象。
jstat
jstat 主要用来通过垃圾回收相关信息来判断 JVM 性能问题,也可以查看类加载、编译的情况,主要的用法是通过持续的固定时间间隔的输出来观察。比如每 3 秒打印一次 GC 回收次数,连续打印 10 次,通过动态的变化来观察 GC 是否过于密集。
下面是 jstat 的帮助手册。
Usage: jstat -help|-options
       jstat -<option> [-t] [-h<lines>] <vmid> [<interval> [<count>]]

Definitions:
  <option>      An option reported by the -options option
  <vmid>        Virtual Machine Identifier. A vmid takes the following form:
                     <lvmid>[@<hostname>[:<port>]]
                Where <lvmid> is the local vm identifier for the target
                Java virtual machine, typically a process id; <hostname> is
                the name of the host running the target Java virtual machine;
                and <port> is the port number for the rmiregistry on the
                target host. See the jvmstat documentation for a more complete
                description of the Virtual Machine Identifier.
  <lines>       Number of samples between header lines.
  <interval>    Sampling interval. The following forms are allowed:
                    <n>["ms"|"s"]
                Where <n> is an integer and the suffix specifies the units as
                milliseconds("ms") or seconds("s"). The default units are "ms".
  <count>       Number of samples to take before terminating.
  -J<flag>      Pass <flag> directly to the runtime system.
通过 jstat -options 可以看到 jstat 支持查看哪些信息。
$ jstat -options
-class  #类加载情况 加载个数和空间使用
-compiler #即时编译器信息
-gc  # GC情况 包括 young gc、full gc 次数、时间等
-gccapacity #年轻代、老年代的使用情况
-gccause #GC 统计信息和回收原因
-gcmetacapacity #显示有关metaspace大小的统计信息
-gcnew #新生代 GC 统计
-gcnewcapacity #新生代内存统计
-gcold #老年代 GC 统计
-gcoldcapacity #老年代内存使用情况
-gcutil #GC 汇总信息
-printcompilation #编译方法统计
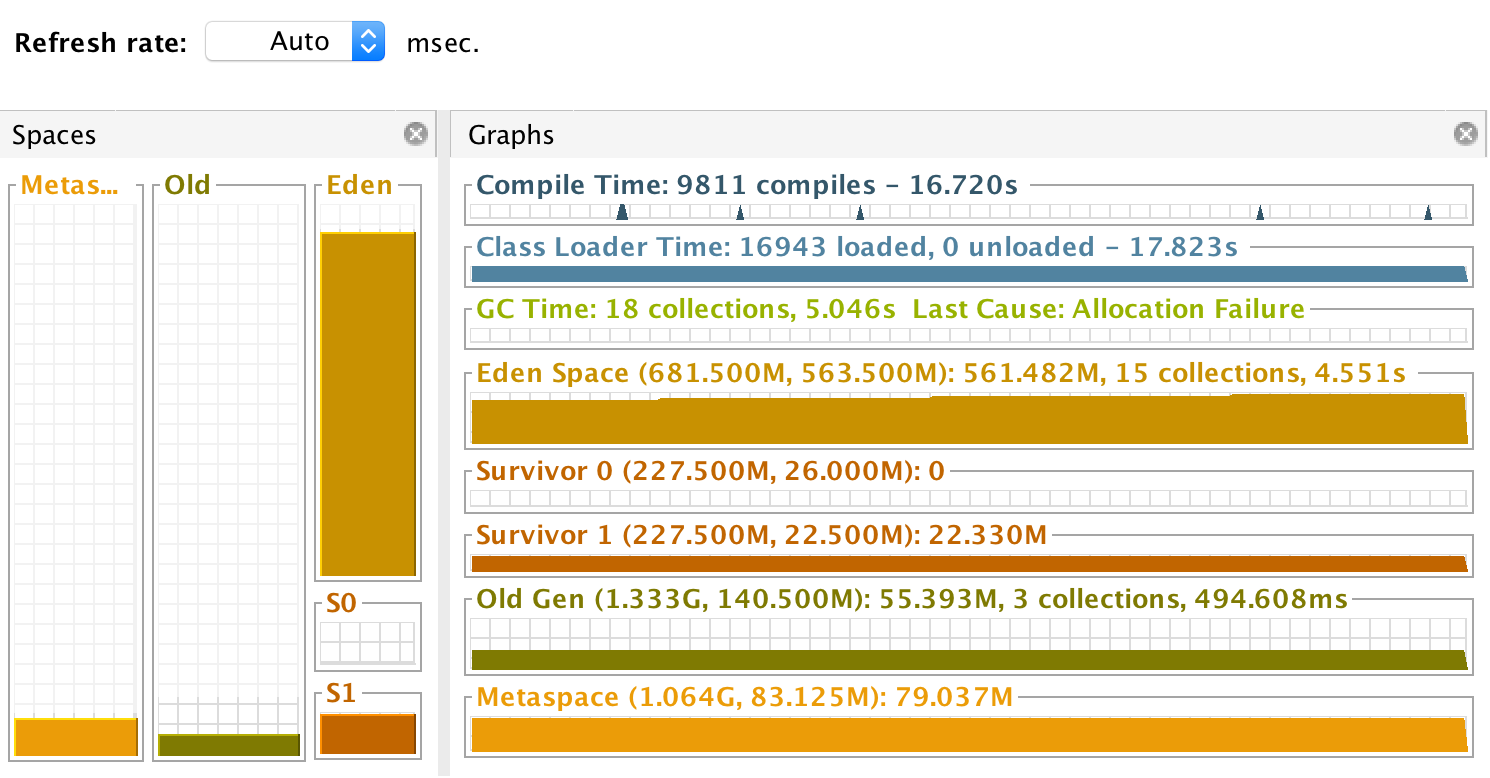
上述这些大多数可以对应到 visualVM 的这一部分显示
示例用法,如下是打印 5301 进程下的垃圾回收情况,-h 3 表示每 3 行输出一次标题信息,3s 5 表示每 3s 输出一次,一共输出 5 次
jstat -gcutil -h 3 5301 3s 5
最后输出的内容如下:
jstat -gcutil -h 3 5301 3s 5
  S0     S1     E      O      M     CCS    YGC     YGCT    FGC    FGCT     GCT
 99.92   0.00  11.90  35.29  94.96  94.08     34   12.675     3    1.946   14.621
 99.92   0.00  11.90  35.29  94.96  94.08     34   12.675     3    1.946   14.621
 99.92   0.00  11.90  35.29  94.96  94.08     34   12.675     3    1.946   14.621
  S0     S1     E      O      M     CCS    YGC     YGCT    FGC    FGCT     GCT
 99.92   0.00  11.94  35.29  94.96  94.08     34   12.675     3    1.946   14.621
 99.92   0.00  11.94  35.29  94.96  94.08     34   12.675     3    1.946   14.621
jcmd
jcmd 会将命令发送给 JVM。这些命令包括用于控制 Java Flight Recording(飞行记录)、诊断命令等。 必须运行在 JVM 本地,不能远程使用,并且必须用 JVM 启动用户执行。
通过 jps 命令找到一个 JVM 进程,然后使用下面的代码可以看到 jcmd 支持的命令
#进程 5173
jcmd 5173 help

5173:
The following commands are available:
JFR.stop
JFR.start
JFR.dump
JFR.check
VM.native_memory
VM.check_commercial_features
VM.unlock_commercial_features
ManagementAgent.stop
ManagementAgent.start_local
ManagementAgent.start
GC.rotate_log
Thread.print
GC.class_stats
GC.class_histogram
GC.heap_dump
GC.run_finalization
GC.run
VM.uptime
VM.flags
VM.system_properties
VM.command_line
VM.version
help
基本包含了问题排查的常用命令,并且和上面介绍的几个工具有部分重合。
通过命令 jcmd 5173 help GC.heap_dump 可以查询到 GC.heap_dump 命令的使用方法,其他命令都可以通过这个方法找到使用说明
jcmd 5173 help GC.heap_dump
5173:
GC.heap_dump
Generate a HPROF format dump of the Java heap.

Impact: High: Depends on Java heap size and content. Request a full GC unless the '-all' option is specified.

Permission: java.lang.management.ManagementPermission(monitor)

Syntax : GC.heap_dump [options] <filename>

Arguments:
	filename :  Name of the dump file (STRING, no default value)

Options: (options must be specified using the <key> or <key>=<value> syntax)
	-all : [optional] Dump all objects, including unreachable objects (BOOLEAN, false)
然后通过如下代码就可以 dump 堆信息下来了,和 jmap -dump 的作用一样
jcmd 5173 GC.heap_dump /Users/fengzheng/jvmlog/jcmd_heap_dump.hprof
抛砖引玉就到此了,之后会对 jinfo、jmap、jstack、jstat、jcmd 做详细说明,记得关注啊。
相关阅读:
欢迎关注,不定期更新本系列和其他文章
古时的风筝 ,进入公众号可以加入交流群