$(function () {
var chart;
$(document).ready(function () {
// Build the chart
$('#container').highcharts({
chart: {
plotBackgroundColor: null,
plotBorderWidth: null,
plotShadow: false
},
title: {
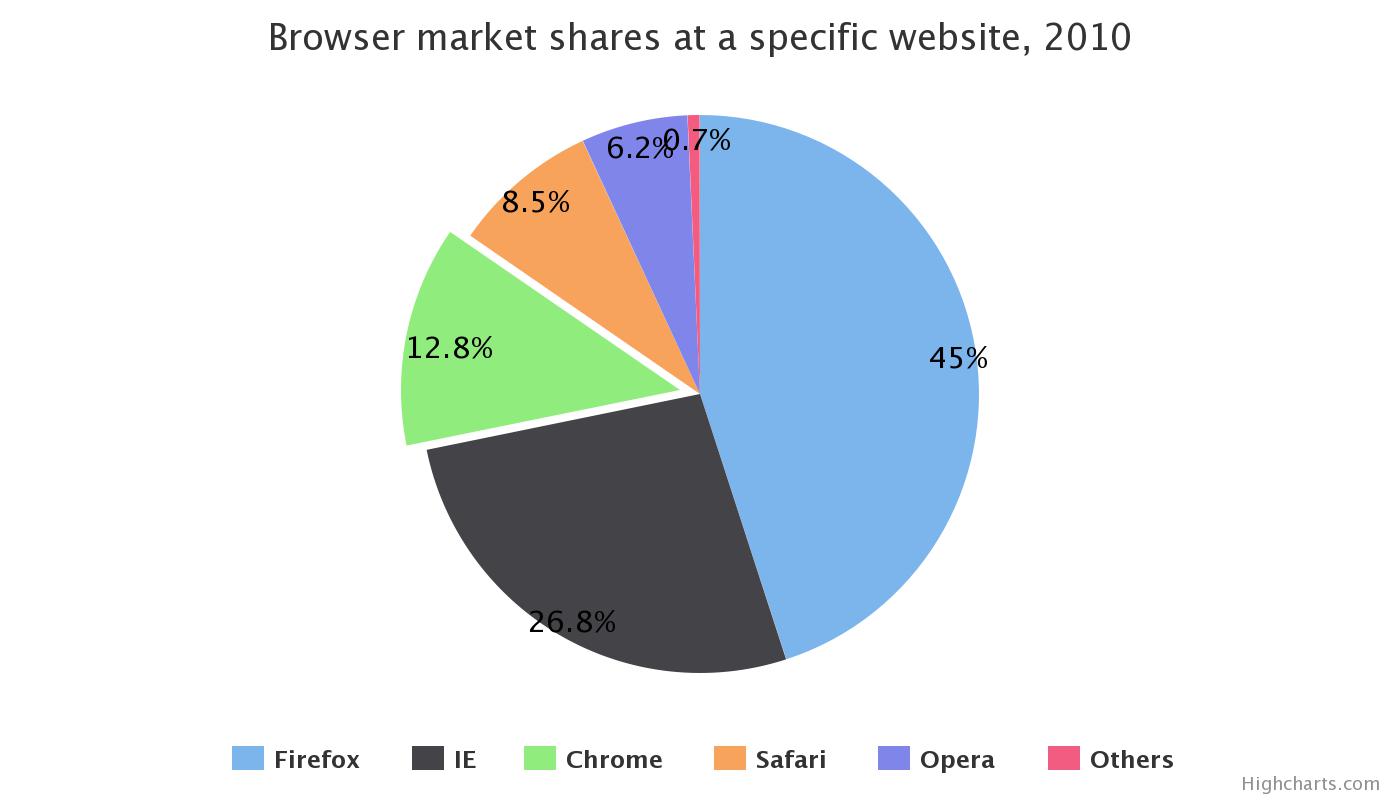
text: 'Browser market shares at a specific website, 2010'
},
tooltip: {
pointFormat: '{series.name}: <b>{point.percentage:.1f}%</b>'
},
plotOptions: {
pie: {
borderWidth: 0,
allowPointSelect: true,
cursor: 'pointer',
dataLabels: {
enabled: true,
color: '#000',
distance: -10,//通过设置这个属性,将每个小饼图的显示名称和每个饼图重叠
style: {
fontSize: '15px',
lineHeight: '15px'
},
formatter: function(index) {
return this.point.percentage +'%';
}
},
showInLegend: true
}
},
series: [{
type: 'pie',
name: 'Browser share',
data: [
['Firefox', 45.0],
['IE', 26.8],
{
name: 'Chrome',
y: 12.8,
sliced: true,
selected: true
},
['Safari', 8.5],
['Opera', 6.2],
['Others', 0.7],
]
}]
});
});
});