大家都熟悉的『Jack and Rose』的故事,豪华游艇倒了,大家都惊恐逃生,可是救生艇的数量有限,无法人人都有,副船长发话了『lady and kid first!』,所以是否获救其实并非随机,而是基于一些背景有rank先后的。
训练和测试数据是一些乘客的个人信息以及存活状况,要尝试根据它生成合适的模型并预测其他人的存活状况。
对,这是一个二分类问题,很多分类算法都可以解决。
看看数据长啥样
1 import pandas as pd
2 import numpy as np
3 from pandas import Series,DataFrame
4
5 data_train = pd.read_csv("Train.csv")
6 print(data_train.columns)
结果
Index([u'PassengerId', u'Survived', u'Pclass', u'Name', u'Sex', u'Age',u'SibSp', u'Parch', u'Ticket', u'Fare', u'Cabin', u'Embarked'],
      dtype='object')
我们看大概有以下这些字段
PassengerId => 乘客ID
Pclass => 乘客等级(1/2/3等舱位)
Name => 乘客姓名
Sex => 性别
Age => 年龄
SibSp => 堂兄弟/妹个数
Parch => 父母与小孩个数
Ticket => 船票信息
Fare => 票价
Cabin => 客舱
Embarked => 登船港口
看一下数据的详细信息
print(data_train.info())
<class 'pandas.core.frame.DataFrame'>
RangeIndex: 891 entries, 0 to 890
Data columns (total 12 columns):
PassengerId 891 non-null int64
Survived 891 non-null int64
Pclass 891 non-null int64
Name 891 non-null object
Sex 891 non-null object
Age 714 non-null float64
SibSp 891 non-null int64
Parch 891 non-null int64
Ticket 891 non-null object
Fare 891 non-null float64
Cabin 204 non-null object
Embarked 889 non-null object
dtypes: float64(2), int64(5), object(5)
memory usage: 83.6+ KB
上面的数据说啥了?它告诉我们,训练数据中总共有891名乘客,但是很不幸,我们有些属性的数据不全,比如说:
- Age(年龄)属性只有714名乘客有记录
- Cabin(客舱)更是只有204名乘客是已知的
似乎信息略少啊,想再瞄一眼具体数据数值情况呢?恩,我们用下列的方法,得到数值型数据的一些分布(因为有些属性,比如姓名,是文本型;而另外一些属性,比如登船港口,是类目型。这些我们用下面的函数是看不到的)
下面再看看每个/多个 属性和最后的Survived之间有着什么样的关系
 1 # -*- coding:utf-8 -*-
 2 import pandas as pd
 3 import numpy as np
 4 from pandas import Series,DataFrame
 5 import matplotlib.pyplot as plt
 6 from matplotlib.font_manager import FontManager, FontProperties
 7 def getChineseFont():
 8     return FontProperties(fname='/System/Library/Fonts/PingFang.ttc')
 9
10
11 data_train = pd.read_csv("train.csv")
12 #print(data_train.info())
13 #print(data_train.describe())
14
15 fig = plt.figure()
16 fig.set(alpha=0.2)#设定图表颜色alpha参数
17
18 plt.subplot2grid((2,3),(0,0)) #在一张大图里分列几个小图
19 data_train.Survived.value_counts().plot(kind='bar') #存活和不存活的条形图
20 plt.title(u"获救情况(1为获救)",fontproperties=getChineseFont())
21 plt.ylabel(u"人数",fontproperties=getChineseFont())
22
23 plt.subplot2grid((2,3),(0,1))
24 data_train.Pclass.value_counts().plot(kind='bar')
25 plt.title(u"乘客等级分布",fontproperties=getChineseFont())
26 plt.ylabel(u"人数",fontproperties=getChineseFont())
27
28 plt.subplot2grid((2,3),(0,2))
29 plt.scatter(data_train.Survived,data_train.Age)
30 plt.title(u"按年龄看获救分布(1为获救)",fontproperties=getChineseFont())
31 plt.ylabel(u"年龄",fontproperties=getChineseFont())
32 plt.grid(b=True,which='major',axis='y') #格式化图表的网格线样式
33
34 plt.subplot2grid((2,3),(1,0),colspan=2)
35 data_train.Age[data_train.Pclass == 1].plot(kind='kde')
36 data_train.Age[data_train.Pclass == 2].plot(kind='kde')
37 data_train.Age[data_train.Pclass == 3].plot(kind='kde')
38 plt.title(u"各等级乘客年龄分布",fontproperties=getChineseFont())
39 plt.xlabel(u"年龄",fontproperties=getChineseFont())
40 plt.ylabel(u"密度",fontproperties=getChineseFont())
41 plt.legend(("level1","level2","level3"),loc='best')
42
43 plt.subplot2grid((2,3),(1,2))
44 data_train.Embarked.value_counts().plot(kind='bar')
45 plt.title(u"各登船口岸上船人数",fontproperties=getChineseFont())
46 plt.ylabel(u"人数",fontproperties=getChineseFont())
47
48 plt.show()
得到了像下面这样一张图:
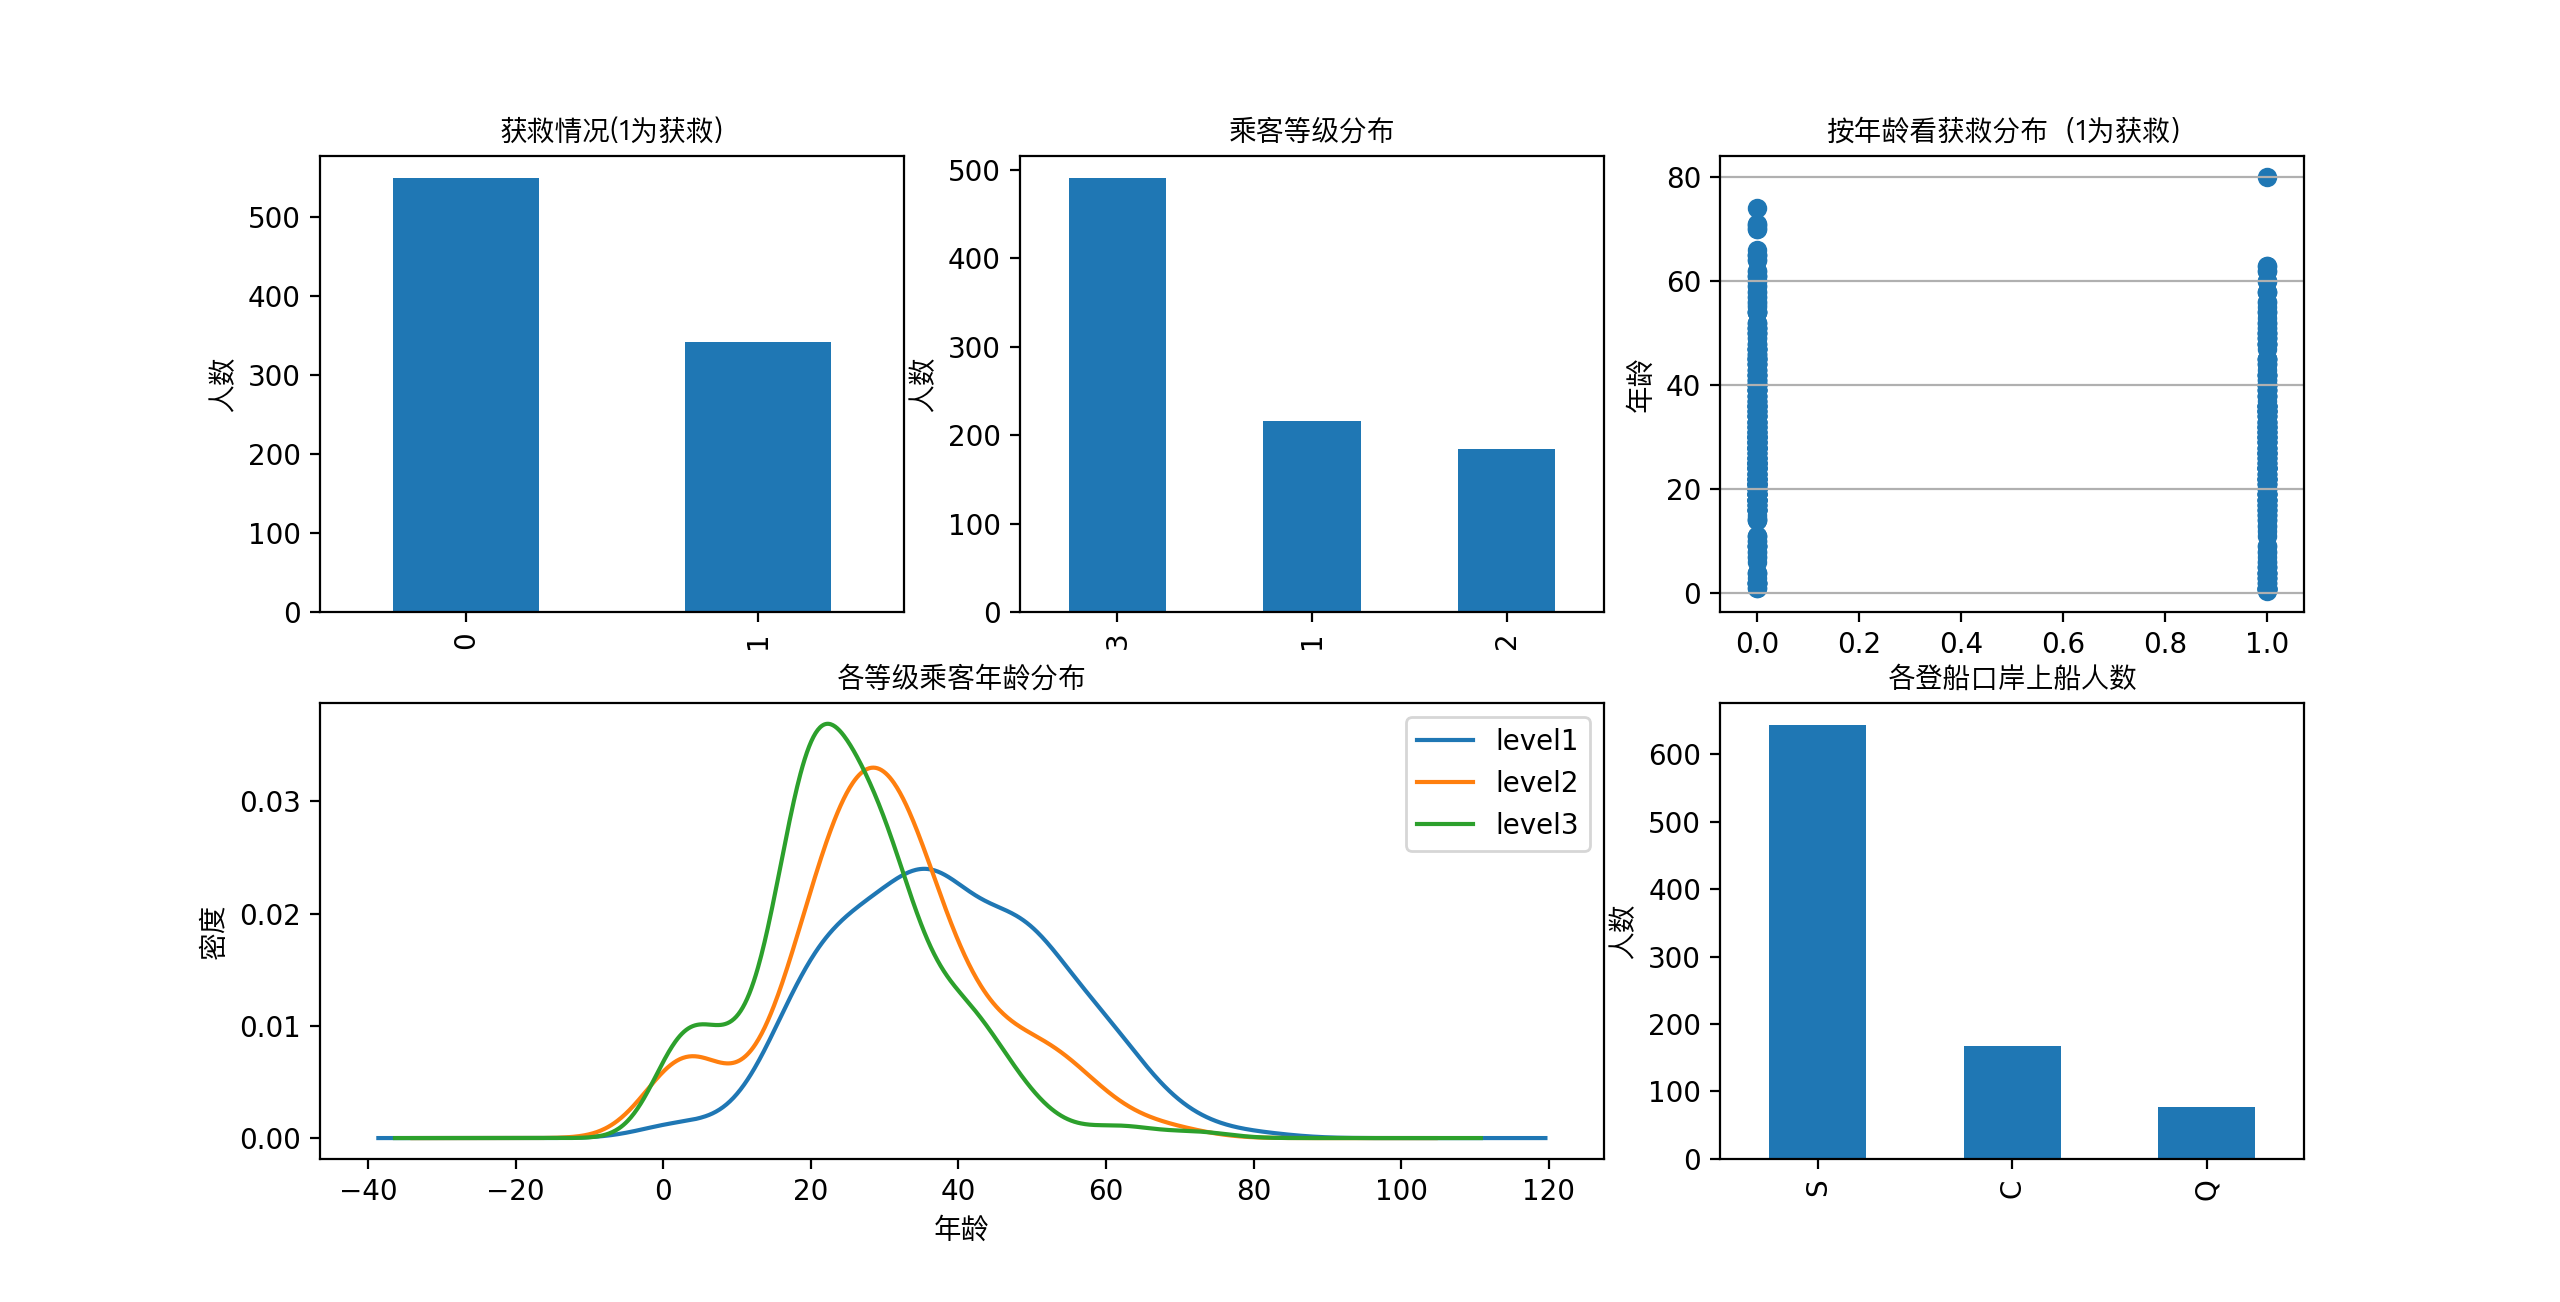
在图上可以看出来:
- 被救的人300多点,不到半数;
- 3等舱乘客灰常多;遇难和获救的人年龄似乎跨度都很广;
- 3个不同的舱年龄总体趋势似乎也一致,2、3等舱乘客20岁多点的人最多,1等舱40岁左右的最多(→_→似乎符合财富和年龄的分配哈);
- 登船港口人数按照S、C、Q递减,而且S远多于另外俩港口。
这个时候我们可能会有一些想法了:
- 不同舱位/乘客等级可能和财富/地位有关系,最后获救概率可能会不一样
- 年龄对获救概率也一定是有影响的,毕竟前面说了,副船长还说『小孩和女士先走』呢
- 和登船港口是不是有关系呢?也许登船港口不同,人的出身地位不同?
下面我们再来统计统计,看看这些属性值的统计分布吧。
 1 #看看各乘客等级的获救情况
 2 fig = plt.figure()
 3 fig.set(alpha=0.2)
 4
 5 Survived_0 = data_train.Pclass[data_train.Survived == 0].value_counts()
 6 Survived_1 = data_train.Pclass[data_train.Survived == 1].value_counts()
 7 df = pd.DataFrame({'survived':Survived_1,'unsurvived':Survived_0})
 8 df.plot(kind='bar',stacked=True)
 9 plt.title(u"各乘客等级的获救情况",fontproperties=getChineseFont())
10 plt.xlabel(u"乘客等级",fontproperties=getChineseFont())
11 plt.ylabel(u"人数",fontproperties=getChineseFont())
12
13 plt.show()
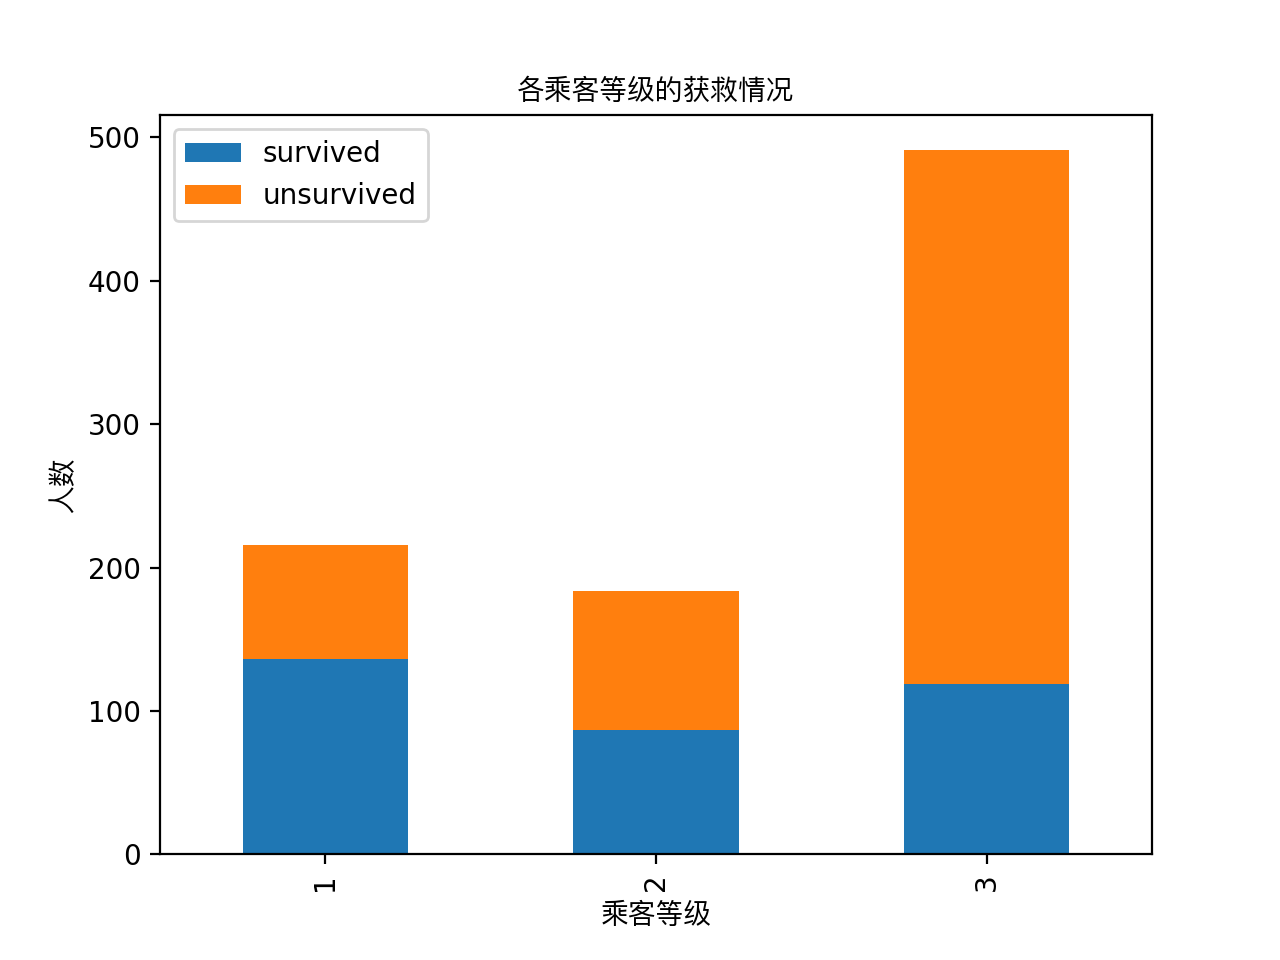
显然等级为1 的乘客获救概率更高,这一定是影响最后获救的一个特征。
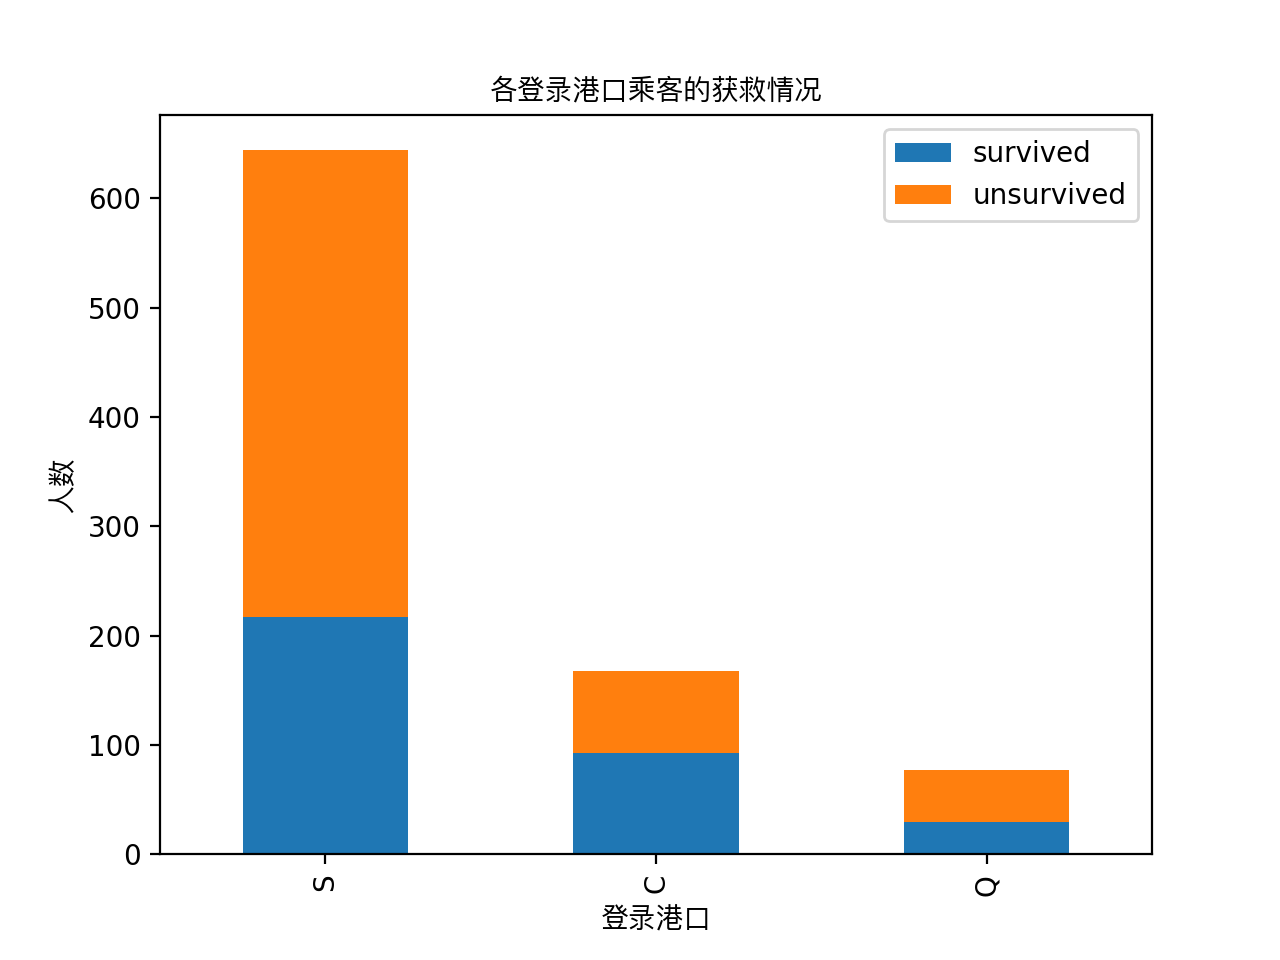
 1 #看看各登录港口的获救情况
 2 fig = plt.figure()
 3 fig.set(alpha=0.2)  # 设定图表颜色alpha参数
 4
 5 Survived_0 = data_train.Embarked[data_train.Survived == 0].value_counts()
 6 Survived_1 = data_train.Embarked[data_train.Survived == 1].value_counts()
 7 df=pd.DataFrame({'survived':Survived_1, 'unsurvived':Survived_0})
 8 df.plot(kind='bar', stacked=True)
 9 plt.title(u"各登录港口乘客的获救情况",fontproperties=getChineseFont())
10 plt.xlabel(u"登录港口",fontproperties=getChineseFont())
11 plt.ylabel(u"人数",fontproperties=getChineseFont())
12
13 plt.show()
 1 #看看各性别的获救情况
 2 fig = plt.figure()
 3 fig.set(alpha=0.2)  # 设定图表颜色alpha参数
 4
 5 Survived_m = data_train.Survived[data_train.Sex == 'male'].value_counts()
 6 Survived_f = data_train.Survived[data_train.Sex == 'female'].value_counts()
 7 df=pd.DataFrame({'male':Survived_m, 'female':Survived_f})
 8 df.plot(kind='bar', stacked=True)
 9 plt.title(u"按性别看获救情况",fontproperties=getChineseFont())
10 plt.xlabel(u"性别",fontproperties=getChineseFont())
11 plt.ylabel(u"人数",fontproperties=getChineseFont())
12 plt.show()

歪果盆友果然很尊重lady,lady first践行得不错。性别无疑也要作为重要特征加入最后的模型之中