判断storm的一个topology性能如何,主要关注capacity指标。官方对此有一段描述:
The "capacity" metric is very useful and tells you what % of the time in the last 10 minutes the bolt spent executing tuples. If this value is close to 1, then the bolt is "at capacity" and is a bottleneck in your topology. The solution to at-capacity bolts is to increase the parallelism of that bolt.
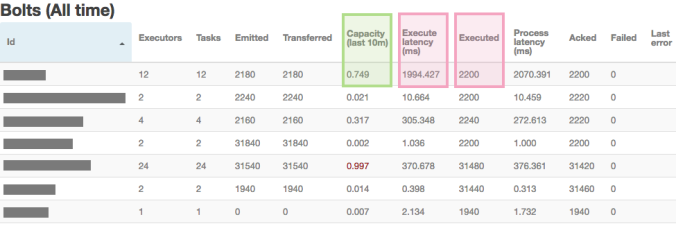
以下是对这些指标的描述以及计算方式:
Capacity = Execute latency * Executed over a window / Window size
To calculate the capacity for the first executor (Id: 10-10), Capacity = 1916.9 * 200 / 595000 = 0.644

To calculate the overall measurements for all the executors in one type of bolt, use the metrics as:
Capacity = Max(executor Capacity) Execute latency = Average(executor Execute latency) Executed = Sum(executor Executed)