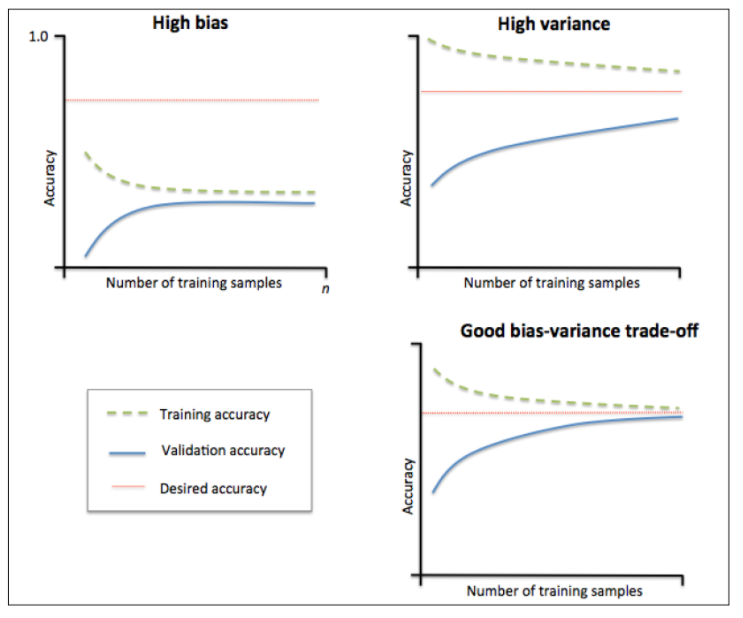
学习曲线是一种有用的诊断图形,它描述了机器学习算法相对可用观测量数量的表现。它的主要思想是将算法的训练性能与交叉验证结果进行比较,训练性能主要是指样本内误差获准确率,交叉验证通常采用十折交叉验证方法。
就训练集而言,训练结果的期待开始时应该高,然后会下降。然而,根据假设的偏差和方差水平不同,有不同的表现。
1)高偏差的机器学习算法倾向于从平均性能开始,当遇到更多复杂数据时性能迅速降低,然后,无论增加多少实例都保持在相同的水平。低偏差的机器学习算法在样本多时能够更好地泛化,但是只适用于相似的复杂数据结构,因此也限制了算法的性能。
2)高方差的假设往往开始时性能很好,然后随着增加更多的实例,性能慢慢降低,原因在于它记录了大量的训练样本特征。
对于验证集而言,表现如下:
1)高偏差的假设往往从低性能开始,但它的增长非常迅速,直到达到了几乎与训练数据相同的性能。然后,它的性能不再提高。
2)高方差的假设往往从非常低的性能开始。然后,平稳又缓慢地提高性能,这是因为更多的实例有助于提高泛化能力。它很难达到训练集上的性能,在它们之间总有一段差距。
理想的学习曲线
模型的最终目标是,误差小并能很好地泛化到未知数据。如果测试曲线和训练曲线均收敛,并且误差极低,这是理想中的模型。这种模型能根据未见过的数据非常准确地进行预测

画学习曲线
构建模型(lightGBM)
def eval_ks(preds, lgb_test):
    labels = lgb_test.get_label()
    fpr, tpr, thresholds = roc_curve(labels, preds)
    ks = 0
    for i in range(len(thresholds)):
        if tpr[i] - fpr[i] > ks:
            ks = tpr[i] - fpr[i]
    return ('KS', ks,True)


def get_learn_curve_info(x,y):
    #处理特征
    feature=[f for f in x.columns]
    cate_feature=[]
    for dty in x.columns:
        if x[dty].dtype=='object':
            cate_feature.append(dty)

    train_score=[]
    valid_score=[]
    #train_loss=[]
    #valid_loss=[]

    train_sizes=(np.linspace(.05, 1., 20)*len(x)).astype(int)
    for num in train_sizes:
        valid_num=np.int(num*0.2)
        valid_x=x[:num][:valid_num]
        valid_y=y[:num][:valid_num]
        train_x=x[:num][valid_num:]
        train_y=y[:num][valid_num:]


        lgb_train = lgb.Dataset(train_x.values,train_y.values)
        lgb_valid = lgb.Dataset(valid_x.values,valid_y.values)


        params = {'boosting_type': 'gbdt','objective': 'binary','metric': 'binary_logloss','num_leaves': 8,'learning_rate': 0.05,'feature_fraction': 0.3,
        'bagging_fraction': 0.7,'bagging_freq': 3,'min_data_in_leaf':130,'num_threads':3, 'verbose': 0}
        evals_result = {}
        gbm = lgb.train(params,lgb_train,num_boost_round=10000, valid_sets=[lgb_train,lgb_valid],valid_names=['train','valid'],feval=eval_ks,evals_result=evals_result,
                                        feature_name=feature,categorical_feature=cate_feature,early_stopping_rounds=100)
        train_score.append(evals_result['train']['KS'][gbm.best_iteration])
        valid_score.append(evals_result['valid']['KS'][gbm.best_iteration])
        #train_loss.append(evals_result['train']['binary_logloss'][gbm.best_iteration])
        #valid_loss.append(evals_result['valid']['binary_logloss'][gbm.best_iteration])

    return train_sizes,train_score,valid_score
模型跑出分数
x = df_new.drop('label',axis=1)
y = df_new['label']
train_size,train_scores,valid_scores=get_learn_curve_info(x,y)
画出ks对应的学习曲线
f, ax = plt.subplots(figsize=(10, 7))
plt.plot(train_size,train_scores,'ro-',label='Training')
plt.plot(train_size,valid_scores,'bo-',label='Cross-validation')
plt.grid(linestyle='--',color='skyblue')
plt.xlabel('sample size')
plt.ylabel('KS')
plt.legend(loc='best',numpoints=1)
plt.show()

利用sklearn画学习曲线
1)自定义评分标准
from sklearn.metrics import roc_curve
from sklearn.metrics import make_scorer
def ks_score(ground_truth, predictions):
    fpr, tpr, thresholds = roc_curve(ground_truth, predictions)
    ks = 0
    for i in range(len(thresholds)):
        if tpr[i] - fpr[i] > ks:
            ks = tpr[i] - fpr[i]
    return  ks
score = make_scorer(ks_score, greater_is_better=True)
from my_score import score
from sklearn.model_selection import learning_curve
#hypothesis=SGDClassifier(loss='log',shuffle=True,n_iter=5,penalty='l2',alpha=0.0001,random_state=3)
hypothesis=lgb.LGBMModel(boosting_type='gbdt', num_leaves=8, learning_rate=0.05,max_bin=100,
              n_estimators=1000, objective='binary',min_child_samples=130,subsample=0.7, subsample_freq=3, colsample_bytree=0.3,n_jobs=3, silent=True)

train_size,train_scores,test_scores=learning_curve(hypothesis,train_x.values,train_y.values,train_sizes=np.linspace(.05, 1., 20),cv=10,scoring=score,exploit_incremental_learning=False,n_jobs=3)
train_scores=train_scores
test_scores=test_scores
mean_train=np.mean(train_scores,axis=1)
upper_train=np.clip(mean_train+np.std(train_scores,axis=1),0,1)
lower_train=np.clip(mean_train-np.std(train_scores,axis=1),0,1)

mean_test=np.mean(test_scores,axis=1)
upper_test=np.clip(mean_test+np.std(test_scores,axis=1),0,1)
lower_test=np.clip(mean_test-np.std(test_scores,axis=1),0,1)

plt.plot(train_size,mean_train,'ro-',label='Training')
plt.fill_between(train_size,upper_train,lower_train,alpha=0.1,color='r')

plt.plot(train_size,mean_test,'bo-',label='Cross-validation')
plt.fill_between(train_size,upper_test,lower_test,alpha=0.1,color='b')

plt.grid()
plt.xlabel('train sample size')
plt.ylabel('KS')
plt.legend(loc='upper right',numpoints=1)
plt.show()
注意:利用sklearn画学习曲线,需要根据sklearn接口构建lightGBM模型或者xgboost模型,与上述构建模型方式不大一样,可能会存在偏差,建议用第一种方式自己直接画学习曲线更。