因为在项目开发过程中,使用的arcgis js api版本是4.7,并不能支持客户端渲染热力图,想到arcgis js api 4.x的渲染是基于canvas,故琢磨着是否能借助类似于mapV、echart、heatmap.js等同样基于canvas的优秀可视化库来操作,本篇主要讲述拓展支持mapV图层的过程,我们可以参看mapV的相关说明,它的渲染是基于我们的屏幕坐标,而在arcgis api js 4.x中便有屏幕坐标和地理坐标的互相转换,所以这便是拓展的关键点,好了,我们来上手吧。
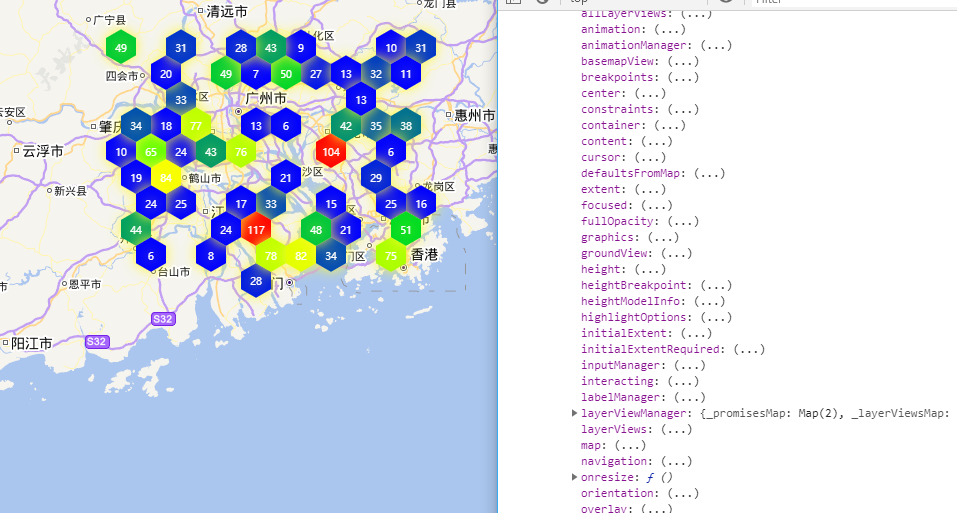
效果图:
安装mapV
-
npm install mapv
引用mapV对象(DataSet、图层对象)
-
import { DataSet, canvasDrawHeatmap, canvasDrawHoneycomb } from 'mapv' ;
初始化mapV图层参数
constructor(view, option) {
this.view = null;
this.box = null;
this.mapvOption = {};
this.mapv_ctx = null;
this.map_ExtentChange_Listener = null;
this.map_RotateView_Listener = null;
this._init(view, option);
}
_init(view, option) {
this._setBaseMap(view);
this._setMapvOption(option);//设置mapv图层参数
this.createLayer(view);//创建图层
}sv
创建mapV图层对象,并加入到地图容器
createLayer(view) {
if (this.mapvOption.geoData) {
if (!document.querySelector('#mapv')) {
let box = this.box = document.createElement("canvas");
box.setAttribute("id", "mapv")
box.setAttribute("name", "mapv")
box.style.width = view.width + 'px';
box.style.height = view.height + 'px';
box.style.position = "absolute";
box.style.top = 0;
box.style.left = 0;
let parent = document.getElementsByClassName("esri-view-surface")[0];
parent.appendChild(box);
}
this.getCanvas();//获取canvas图层
this.renderLayer();//渲染图层
this.startMapEventListeners();//开启地图的监听事件
}
else {
document.querySelector('#mapv') && this.removeCanavs();
}
}
getCanvas() {
let canvas = document.querySelector('#mapv');
canvas.width = document.body.offsetWidth;
canvas.height = document.body.offsetHeight;
this.mapv_ctx = canvas.getContext('2d');
}
渲染mapV图层到地图上
renderLayer() {
let { type, visualMap } = this.mapvOption, renderLyr;
let dataset = this.createDataSet();//构建图层数据及转换
switch (type) {
case "heatmap"://热力图
renderLyr = canvasDrawHeatmap.draw(this.mapv_ctx, dataset, visualMap);
break;
case "honeycomb"://蜂窝图
renderLyr = canvasDrawHoneycomb.draw(this.mapv_ctx, dataset, visualMap);
break;
default:
renderLyr = null;
break;
}
}
构建图层数据及坐标转换
createDataSet() {
let { geoData } = this.mapvOption;
let data = this.geo2Screen(geoData);
data = new DataSet(data);
return data;
}
geo2Screen(geoData) {
let { view } = this;
return geoData.map((item, index) => {
let temp = {};
let mapPoint = {
……
更多的详情见:GIS之家小专栏
文章尾部提供源代码下载,对本专栏感兴趣的话,可以关注一波