前言
之前写过一篇 openlayers4 版本的地图属性查询文章,但是由于是封装一层 js 代码写的,很多初学者看起来比较有点吃力,所以本篇文章重新写一篇地图属性查询文章,直接基于最新版本 openlayers6 写的,纯粹 html + js + css形式,没有任何封装。
内容概览
1.基于 openlayers6 实现地图属性查询
2.源代码 demo 下载
效果图如下: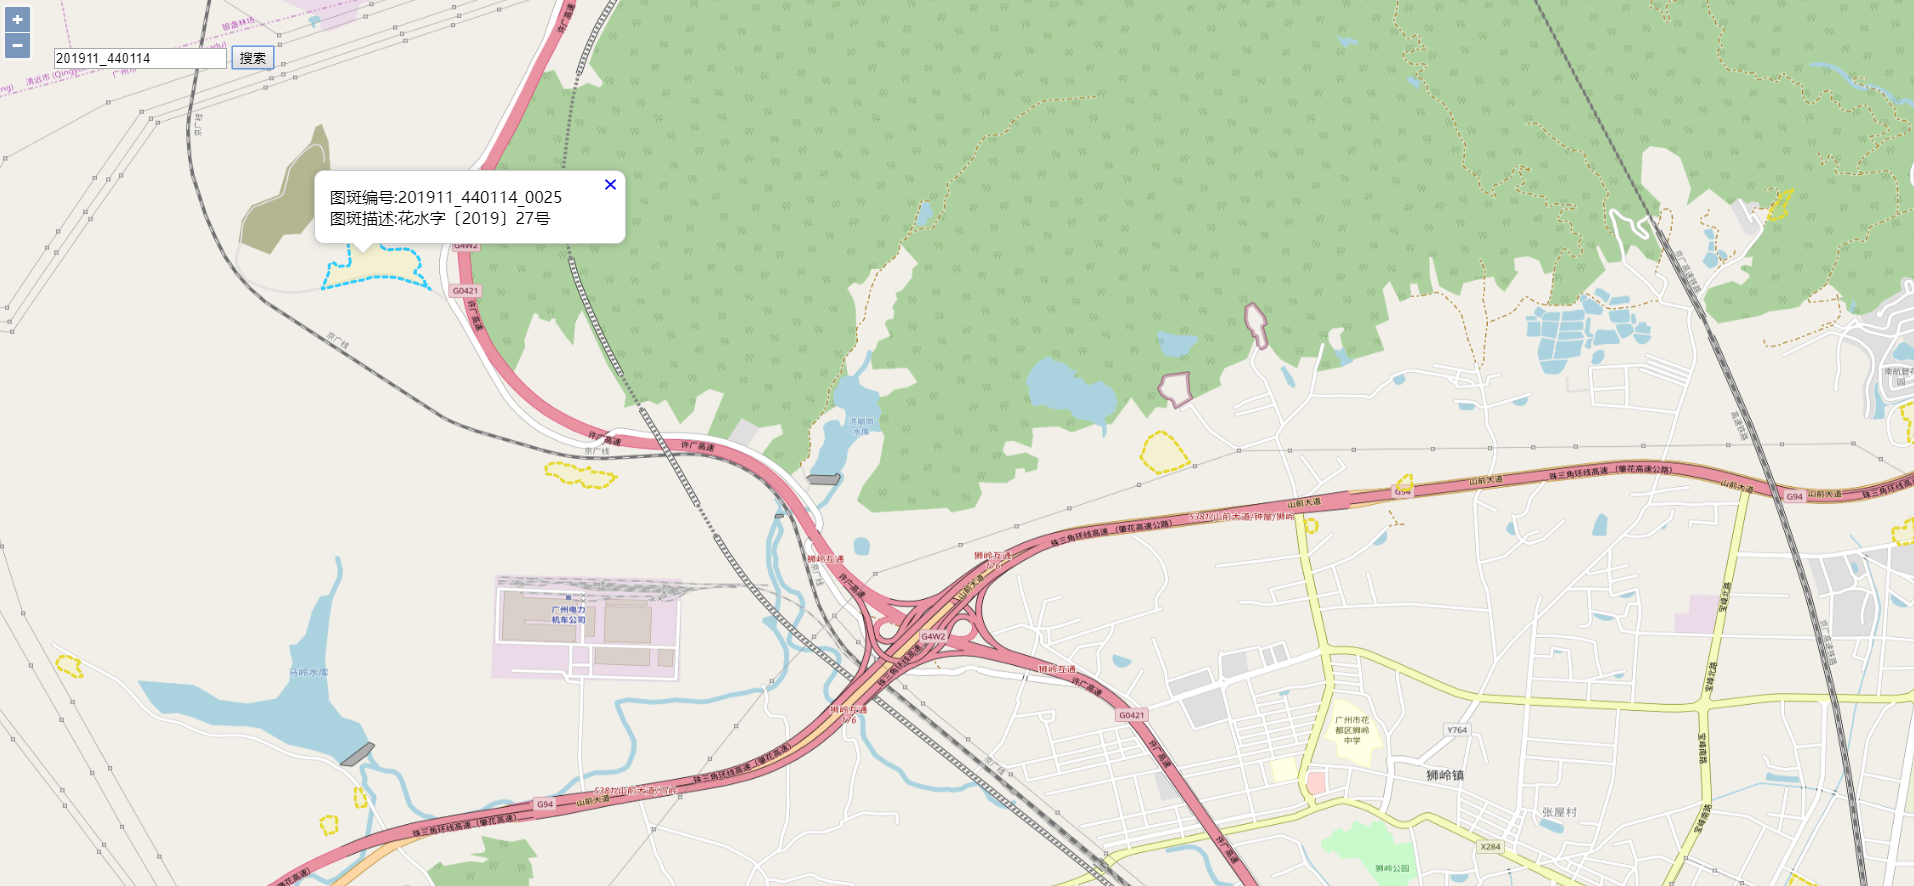
具体实现过程
- html 样式
html, body, #map {
height: 100%;
padding: 0;
margin: 0;
}
.ol-popup {
position: absolute;
background-color: white;
-webkit-filter: drop-shadow(0 1px 4px rgba(0,0,0,0.2));
filter: drop-shadow(0 1px 4px rgba(0,0,0,0.2));
padding: 15px;
border-radius: 10px;
border: 1px solid #cccccc;
bottom: 12px;
left: -50px;
min- 280px;
}
.ol-popup:after, .ol-popup:before {
top: 100%;
border: solid transparent;
content: " ";
height: 0;
 0;
position: absolute;
pointer-events: none;
}
.ol-popup:after {
border-top-color: white;
border- 10px;
left: 48px;
margin-left: -10px;
}
.ol-popup:before {
border-top-color: #cccccc;
border- 11px;
left: 48px;
margin-left: -11px;
}
.ol-popup-closer {
text-decoration: none;
position: absolute;
top: 2px;
right: 8px;
}
.ol-popup-closer:after {
content: "✖";
}
- 矢量图层默认样式以及高亮样式
//绘制geojson矢量图层样式
var geoJsonStyle = new ol.style.Style({
stroke: new ol.style.Stroke({
color: '#e6d933',
lineDash: [4],
 3
}),
fill: new ol.style.Fill({
color: 'rgba(255, 255, 0, 0.1)'
})
});
//绘制geojson矢量图层高亮样式
var geoJsonHLightStyle = new ol.style.Style({
stroke: new ol.style.Stroke({
color: '#33CCFF',
lineDash: [4],
 3
}),
fill: new ol.style.Fill({
color: 'rgba(255, 255, 0, 0.1)'
})
});
- 创建矢量图层以及地图底图
var geojsonLayer = new ol.layer.Vector({
source: new ol.source.Vector(),
style: geoJsonStyle
});
var layers = [
new ol.layer.Tile({
source: new ol.source.OSM()
}),
/*new ol.layer.Tile({
source: new ol.source.TileArcGISRest({
url: 'https://server.arcgisonline.com/arcgis/rest/services/World_Imagery/MapServer'
})
}),*/
geojsonLayer
];
- 创建地图
var map = new ol.Map({
layers: layers,
overlays: [overlay],
target: 'map',
view: new ol.View({
projection: 'EPSG:4326',
center: [104.114129, 37.550339],
zoom: 4
})
});
- 监听地图鼠标移动事件,设置选择矢量图层要素高亮以及弹出气泡窗口效果
//监听地图鼠标移动事件
map.on('pointermove',function(e) {
if (e.dragging) {
return;
}
var feature =map.forEachFeatureAtPixel(e.pixel,
function(feature) {
return feature;
});
//console.log('feature',feature);
if(feature==undefined){//捕捉不到矢量数据,设置矢量图层默认样式
geojsonLayer.getSource().forEachFeature(function(feature) {
feature.setStyle(geoJsonStyle);
});
//隐藏气泡窗口
overlay.setPosition(undefined);
closer.blur();
}else{//捕捉到矢量数据,设置矢量图层高亮样式
feature.setStyle(geoJsonHLightStyle);
//弹出气泡窗口
var coordinate = e.coordinate;
content.innerHTML = '图斑编号:'+feature.values_.map_num+'</br>图斑描述:'+feature.values_.description;
overlay.setPosition(coordinate);
}
})
- 属性查询核心函数
var geoserverUrl = 'http://localhost:8080/geoserver/GIS';
/*属性查询图层
*@method queryByProperty
*@param propertyValue 属性值
*@param propertyName 属性名称
*@param typeName 图层名称
*@return null
*/
function queryByProperty(propertyValue, propertyName, typeName, callback){
var filter =
'<Filter xmlns="http://www.opengis.net/ogc" xmlns:gml="http://www.opengis.net/gml">';
……
完整demo源码见小专栏文章尾部:GIS之家openlayers小专栏
文章尾部提供源代码下载,对本专栏感兴趣的话,可以关注一波