11. arcgis_tile_layer
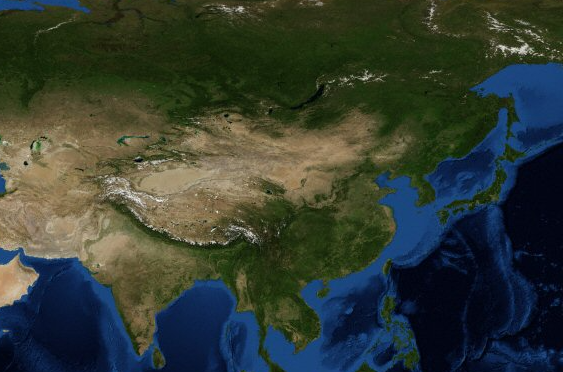

1 var arcUrl = 'https://services.arcgisonline.com/arcgis/rest/services/ESRI_Imagery_World_2D/MapServer';
2
3 maptalks.SpatialReference.loadArcgis(arcUrl + '?f=pjson', function (err, conf) {
4 if (err) {
5 throw new Error(err);
6 }
7 var ref = conf.spatialReference;
8 ref.projection = 'EPSG:4326';
9
10 var map = new maptalks.Map('map', {
11 center: [121, 0],
12 zoom: 1,
13 minZoom: 1,
14 maxZoom : 16,
15 spatialReference : ref,
16 baseLayer: new maptalks.TileLayer('base', {
17 'tileSystem' : conf.tileSystem,
18 'tileSize' : conf.tileSize, // [512, 512]
19 'urlTemplate' : arcUrl + '/tile/{z}/{y}/{x}',
20 'attribution' : '© <a target="_blank" href="' + arcUrl + '"">ArcGIS</a>'
21 })
22 });
23 });
12. layer-mask
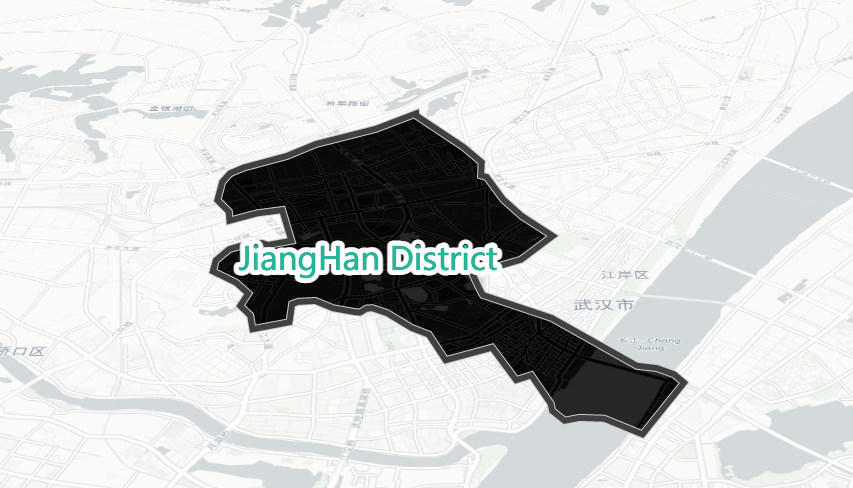
 1 var mask = new maptalks.Polygon(boundary, {
 2     'symbol' : [
 3       {
 4         'lineColor' : '#ccc',
 5         'lineWidth' : 8,
 6         'polygonFillOpacity' : 0
 7       },
 8       {
 9         'lineColor' : '#404040',
10         'lineWidth' : 6,
11         'polygonFillOpacity' : 0
12       }
13     ]
14   });
15
16   //Copy the mask to add as mask's outline
17   var outline = mask.copy();
18
19   var maskedLayer = new maptalks.TileLayer('masked', {
20     'urlTemplate' : 'https://{s}.basemaps.cartocdn.com/dark_all/{z}/{x}/{y}.png',
21     'subdomains'  : ['a','b','c','d']
22   })
23     .setMask(mask) // set boundary as the mask to the tilelayer
24     .addTo(map);
13. 百度 Projection
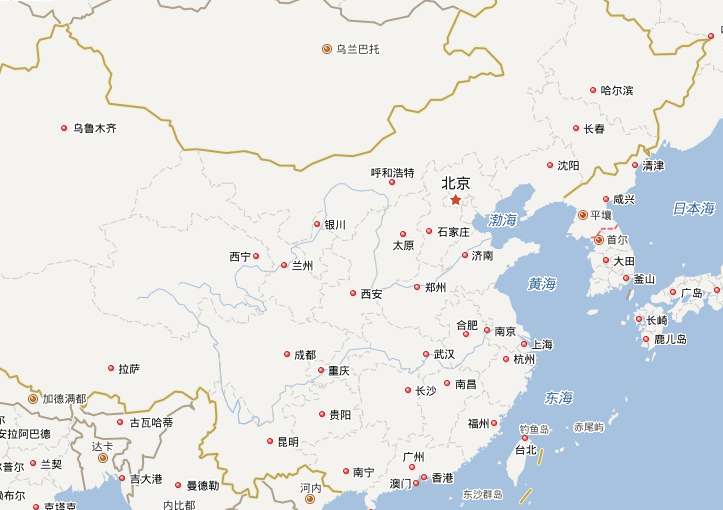
1 var map = new maptalks.Map('map', {
2 center: [105.08052356963802, 36.04231948670001],
3 zoom: 5,
4 minZoom:1,
5 maxZoom:19,
6 spatialReference:{
7 projection : 'baidu'
8 },
9 baseLayer: new maptalks.TileLayer('base', {
10 'urlTemplate' : 'http://online{s}.map.bdimg.com/onlinelabel/?qt=tile&x={x}&y={y}&z={z}&styles=pl&scaler=1&p=1',
11 'subdomains' : [0,1,2,3,4,5,6,7,8,9],
12 'attribution' : '© <a target="_blank" href="http://map.baidu.com">Baidu</a>'
13 })
14 });
14. css-filter

1 var map = new maptalks.Map('map', {
2 center: [105.08052356963802, 36.04231948670001],
3 zoom: 5,
4 minZoom:1,
5 maxZoom:19,
6 baseLayer: new maptalks.TileLayer('base', {
7 urlTemplate: 'https://{s}.basemaps.cartocdn.com/light_all/{z}/{x}/{y}.png',
8 subdomains: ['a','b','c','d'],
9 attribution: '© <a href="http://osm.org">OpenStreetMap</a> contributors, © <a href="https://carto.com/">CARTO</a>',
10
11 // css filter
12 cssFilter : 'sepia(100%) invert(90%)'
13 })
14 });
15. marker
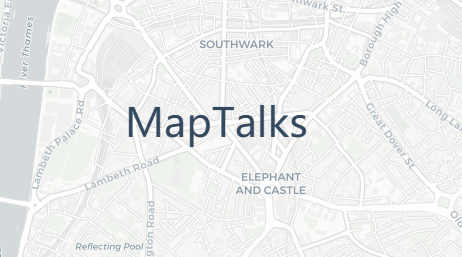
 1  var point = new maptalks.Marker(
 2     [-0.113049, 51.498568],
 3     {
 4       visible : true,
 5       editable : true,
 6       cursor : 'pointer',
 7       shadowBlur : 0,
 8       shadowColor : 'black',
 9       draggable : false,
10       dragShadow : false, // display a shadow during dragging
11       drawOnAxis : null,  // force dragging stick on a axis, can be: x, y
12       symbol : {
13         'textFaceName' : 'sans-serif',
14         'textName' : 'MapTalks',
15         'textFill' : '#34495e',
16         'textHorizontalAlignment' : 'right',
17         'textSize' : 40
18       }
19     }
20   );
21
22   new maptalks.VectorLayer('vector', point).addTo(map);
16. multiMarker
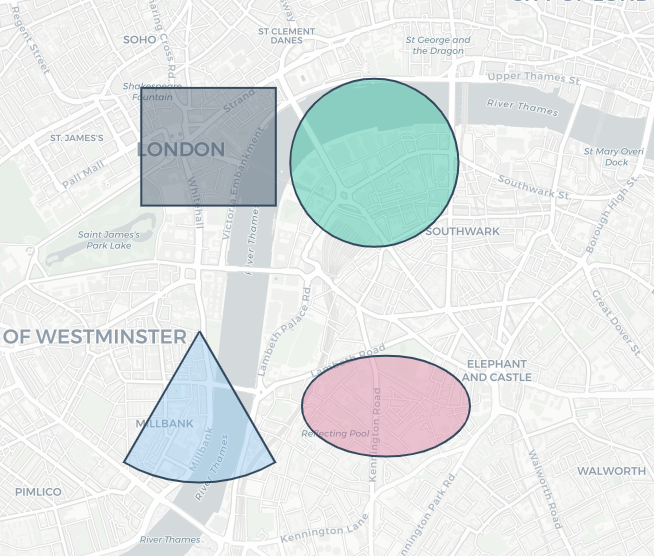
 1   var rectangle = new maptalks.Rectangle(center.add(-0.018,0.012), 800, 700, {
 2     symbol: {
 3       lineColor: '#34495e',
 4       lineWidth: 2,
 5       polygonFill: '#34495e',
 6       polygonOpacity: 0.4
 7     }
 8   });
 9   var circle = new maptalks.Circle(center.add(0.002,0.008), 500,{
10     symbol: {
11       lineColor: '#34495e',
12       lineWidth: 2,
13       polygonFill: '#1bbc9b',
14       polygonOpacity: 0.4
15     }
16   });
17   var sector = new maptalks.Sector(center.add(-0.013,-0.001), 900, 240, 300, {
18     symbol: {
19       lineColor: '#34495e',
20       lineWidth: 2,
21       polygonFill: 'rgb(135,196,240)',
22       polygonOpacity: 0.4
23     }
24   });
25
26   var ellipse = new maptalks.Ellipse(center.add(0.003,-0.005), 1000, 600, {
27     symbol: {
28       lineColor: '#34495e',
29       lineWidth: 2,
30       polygonFill: 'rgb(216,115,149)',
31       polygonOpacity: 0.4
32     }
33   });
34
35   new maptalks.VectorLayer('vector')
36     .addGeometry([rectangle, circle, sector, ellipse])
37     .addTo(map);
17. label

 1  var label = new maptalks.Label('label without box',
 2     [-0.126049, 51.496568],
 3     {
 4       'draggable' : true,
 5       'textSymbol': {
 6         'textFaceName' : 'monospace',
 7         'textFill' : '#34495e',
 8         'textHaloFill' : '#fff',
 9         'textHaloRadius' : 4,
10         'textSize' : 18,
11         'textWeight' : 'bold',
12         'textVerticalAlignment' : 'top'
13       }
14     });
15
16   var labelBox = new maptalks.Label('label with box',
17     [-0.109049, 51.496568],
18     {
19       'draggable' : true,
20       'boxStyle' : {
21         'padding' : [12, 8],
22         'verticalAlignment' : 'top',
23         'horizontalAlignment' : 'left',
24         'minWidth' : 200,
25         'minHeight' : 30,
26         'symbol' : {
27           'markerType' : 'square',
28           'markerFill' : 'rgb(135,196,240)',
29           'markerFillOpacity' : 0.9,
30           'markerLineColor' : '#34495e',
31           'markerLineWidth' : 1
32         }
33       },
34       'textSymbol': {
35         'textFaceName' : 'monospace',
36         'textFill' : '#34495e',
37         'textHaloFill' : '#fff',
38         'textHaloRadius' : 4,
39         'textSize' : 18,
40         'textWeight' : 'bold',
41         'textVerticalAlignment' : 'top'
42       }
43     });
44
45   new maptalks.VectorLayer('vector', [labelBox, label]).addTo(map);
18. text-box
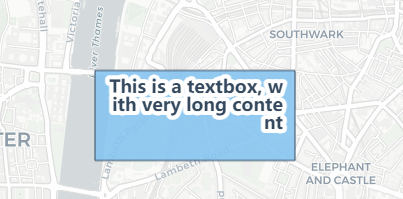
 var textbox = new maptalks.TextBox(
    'This is a textbox, with very long content', // content
    [-0.113049, 51.498568],  // coordinate
    200,                 // width
    90,                  // height
    {
      'draggable' : true,
      'textStyle' : {
        'wrap' : true,          // auto wrap text
        'padding' : [12, 8],    // padding of textbox
        'verticalAlignment' : 'top',
        'horizontalAlignment' : 'right',
        'symbol' : {
          'textFaceName' : 'monospace',
          'textFill' : '#34495e',
          'textHaloFill' : '#fff',
          'textHaloRadius' : 4,
          'textSize' : 18,
          'textWeight' : 'bold'
        }
      },
      'boxSymbol': {
        // box's symbol
        'markerType' : 'square',
        'markerFill' : 'rgb(135,196,240)',
        'markerFillOpacity' : 0.9,
        'markerLineColor' : '#34495e',
        'markerLineWidth' : 1
      }
    });

  new maptalks.VectorLayer('vector', textbox).addTo(map);
19. connected-line
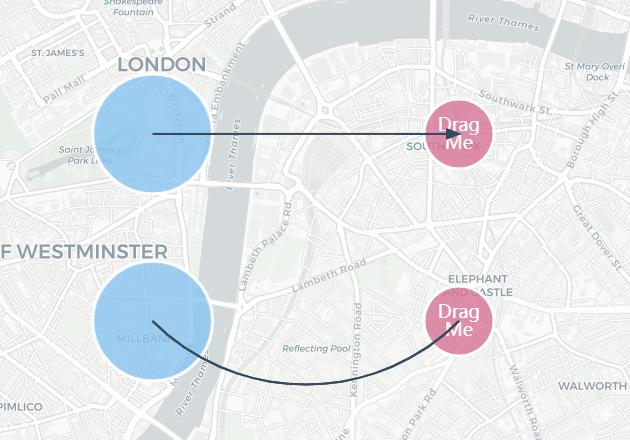
 1   // connector line
 2   var line = new maptalks.ConnectorLine(src, dst, {
 3     showOn : 'always', //'moving', 'click', 'mouseover', 'always'
 4     arrowStyle : 'classic',
 5     arrowPlacement : 'vertex-last',// 'vertex-last', //vertex-first, vertex-last, vertex-firstlast, point
 6     symbol: {
 7       lineColor: '#34495e',
 8       lineWidth: 2
 9     }
10   });
11
12   layer.addGeometry(src, dst, line);
13
14   var src2 = src.copy().translate(0, -0.01);
15   var dst2 = dst.copy().translate(0, -0.01);
16   // Arc Connector Line
17   var line2 = new maptalks.ArcConnectorLine(src2, dst2, {
18     arcDegree : 90,
19     showOn : 'always',
20     symbol: {
21       lineColor: '#34495e',
22       lineWidth: 2
23     }
24   });
25
26   layer.addGeometry(src2, dst2, line2);
20. listen-events
 1 function addListen() {
 2     //mousemove and touchmove is annoying, so not listening to it.
 3     marker.on('mousedown mouseup click dblclick contextmenu touchstart touchend', onEvent);
 4   }
 5   function removeListen() {
 6     //mousemove and touchmove is annoying, so not listening to it.
 7     marker.off('mousedown mouseup click dblclick contextmenu touchstart touchend', onEvent);
 8   }
 9
10   var events = [];
11
12   function onEvent(param) {
13     events.push(param);
14     var content = '';
15     for (var i = events.length - 1; i >= 0; i--) {
16       content += events[i].type + ' on ' +
17         events[i].coordinate.toArray().map(function (c) { return c.toFixed(5); }).join() +
18         '<br>';
19     }
20     document.getElementById('events').innerHTML = '<div>' + content + '</div>';
21     //return false to stop event propagation
22     return false;
23   }