前提:已搭建好kubernetes集群、安装完dashboard
默认安装的dashboard无法展示集群的度量指标信息,此时就需要安装heapster插件
Heapster 插件使用包含三部分内容:
- Heapster:显示各 Nodes、Pods 的 CPU、内存、负载等利用率曲线图。
- InfluxDB:存储 Pod 信息相关的数据库, Heapster 获取数据之后, 可以指定存储在 InfluxDB。
- Grafana:这个主要是用于显示 InfluxDB 里面的数据情况, 可以让我们很直观看到数据变化。
1:InfluxDB安装
1.1:下载
##离线安装
wget https://repos.influxdata.com/rhel/6Server/x86_64/stable/influxdb-1.2.0.x86_64.rpm
rpm -ivh influxdb-1.2.0.x86_64.rpm
1.2:修改配置
InfluxDB 1.1开始WEB管理默认是禁用的,所以装完并没有启用8083端口了,需要到配置文件里启用。
进入到influxDB的配置文件目录
cd /etc/influxdb/
修改influxdb.conf(红色字体为改动部分)
[root@MyCentos7 influxdb]# vim influxdb.conf
##主要开放8086和8083端口
[admin]
  # Determines whether the admin service is enabled.
   enabled = true

  # The default bind address used by the admin service.
   bind-address = ":8083"


[http]
  # Determines whether HTTP endpoint is enabled.
   enabled = true

  # The bind address used by the HTTP service.
   bind-address = ":8086"
1.3:启动influxDB
systemctl start influxdb
1.4:验证
1.4.1:输入influx,检测influxDB是否正常运行
[root@MyCentos7 influxdb]# influx
Connected to http://localhost:8086 version 1.2.0
InfluxDB shell version: 1.2.0
>
1.4.2:查看web界面是否可用
在浏览器输入网址之后如果web页面能够正常显示就可以
http://192.168.126.130:8083
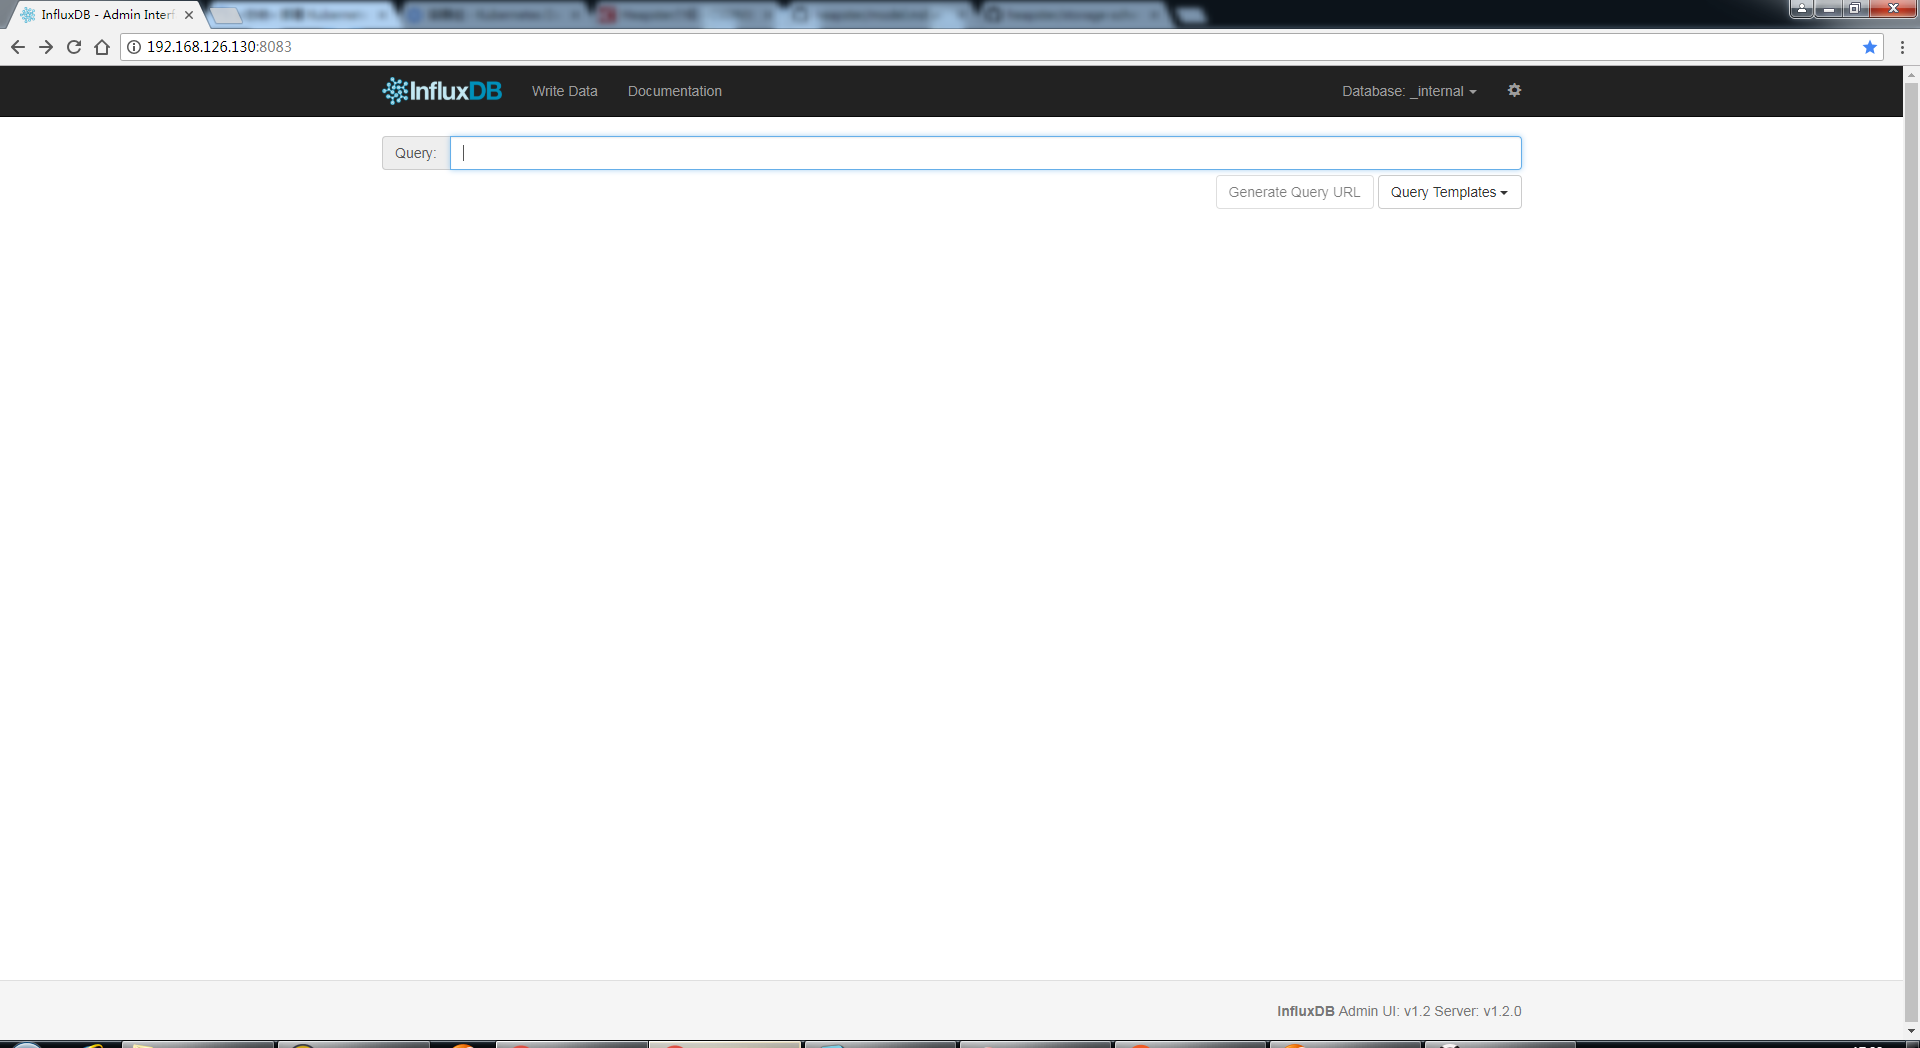
成功
2:Heapster安装
2.1:下载
到 heapster release 页面(https://github.com/kubernetes/heapster/releases)下载最新版本的 heapster【使用yaml文件安装heapster】
wget -P /service/docker/k8s https://github.com/kubernetes/heapster/archive/v1.5.3.zip
unzip v1.5.3.zip
cd heapster-1.5.3/deploy/kube-config/influxdb
2.2:修改配置
修改heapster.yaml(红色字体为改动部分)
apiVersion: v1
kind: ServiceAccount
metadata:
  name: heapster
  namespace: kube-system
---
apiVersion: extensions/v1beta1
kind: Deployment
metadata:
  name: heapster
  namespace: kube-system
spec:
  replicas: 1
  template:
    metadata:
      labels:
        task: monitoring
        k8s-app: heapster
    spec:
      serviceAccountName: heapster
      containers:
      - name: heapster
        image: daocloud.io/liukuan73/heapster-amd64:v1.5.2       ##国外镜像访问不了,改成daocloud的镜像
        imagePullPolicy: IfNotPresent
        command:
        - /heapster
        - --source=kubernetes:http://192.168.126.130:8080?inClusterConfig=false      ##注意是http,下文会解释改动原因
        - --sink=influxdb:http://192.168.126.130:8086      ##此处为influxdb所在服务器的地址,默认8086端口
---
apiVersion: v1
kind: Service
metadata:
  labels:
    task: monitoring
    # For use as a Cluster add-on (https://github.com/kubernetes/kubernetes/tree/master/cluster/addons)
    # If you are NOT using this as an addon, you should comment out this line.
    kubernetes.io/cluster-service: 'true'
    kubernetes.io/name: Heapster
  name: heapster
  namespace: kube-system
spec:
  ports:
  - port: 80
    targetPort: 8082
  selector:
    k8s-app: heapster
2.3:安装
[root@MyCentos7 heapster]# kubectl create -f heapster.yaml
serviceaccount "heapster" created
deployment "heapster" created
service "heapster" created
2.4:验证
检测pods状态
[root@MyCentos7 heapster]# kubectl get pods -n kube-system
NAME                                    READY     STATUS    RESTARTS   AGE
heapster-3287734661-q2vdh               1/1       Running   0          3h
kubernetes-dashboard-2094756401-k09kb   1/1       Running   4          2d
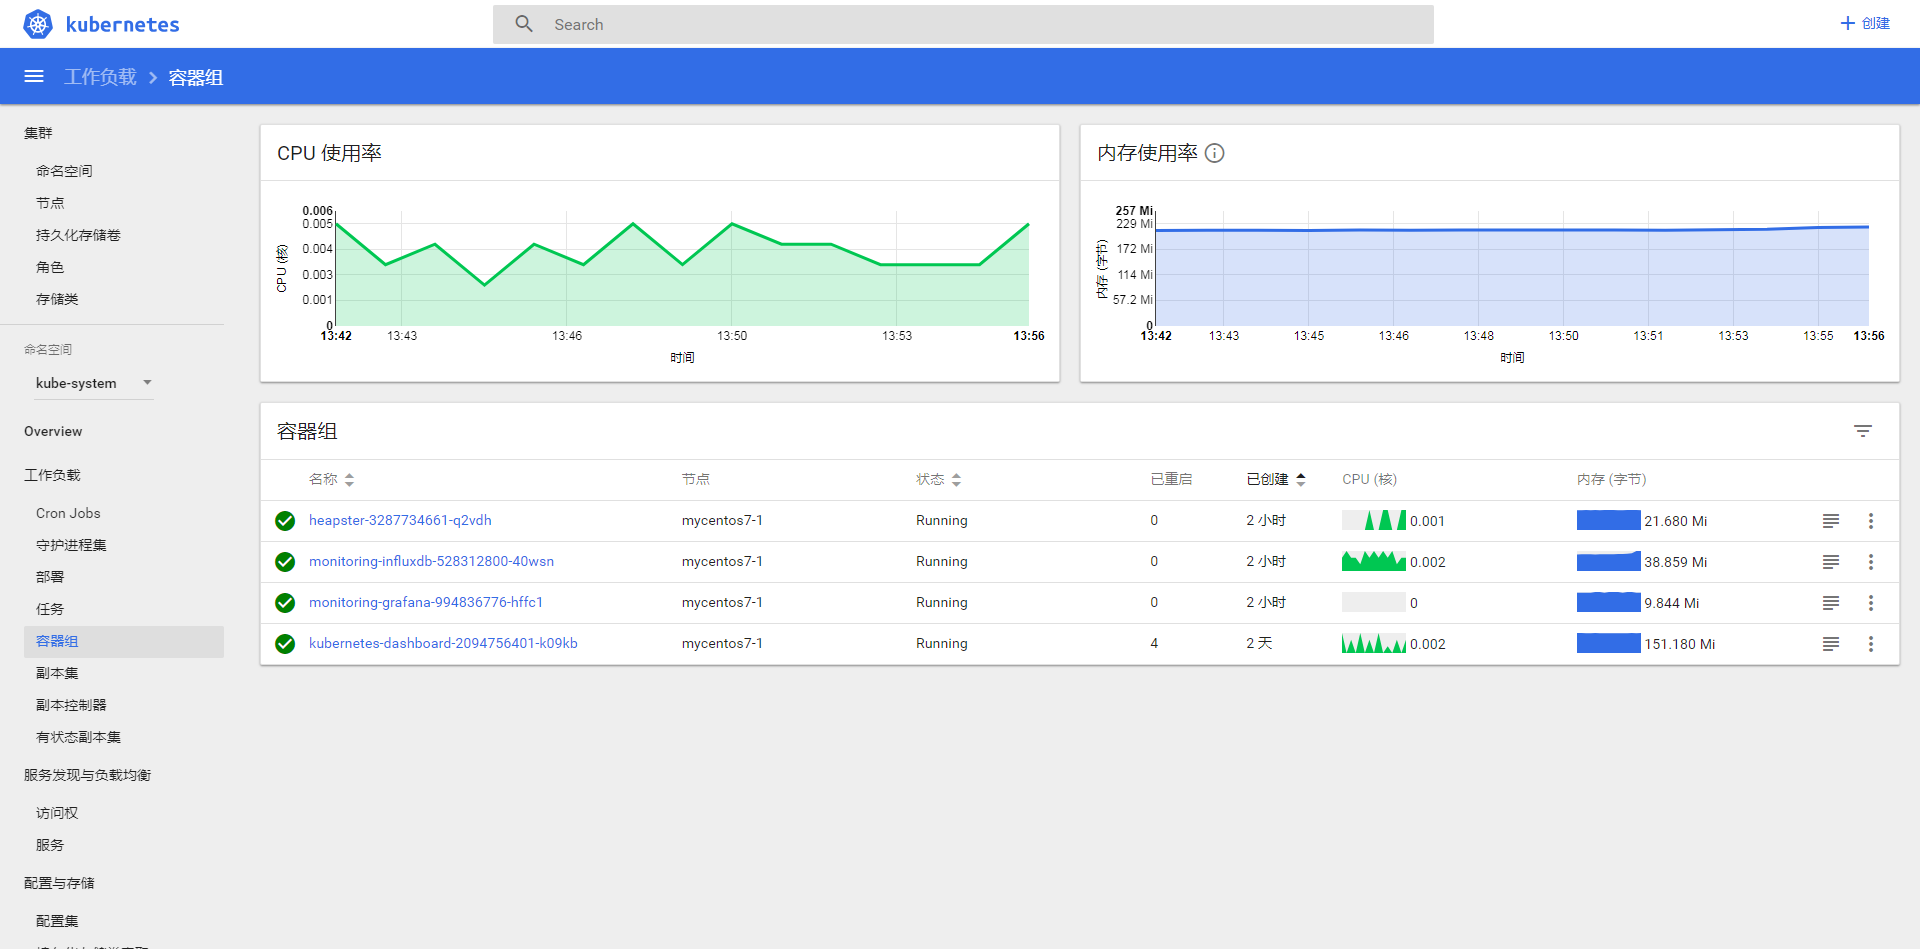
检查 kubernets dashboard 界面,看是显示各 Nodes、Pods 的 CPU、内存、负载等利用率曲线图;
2.5:说明
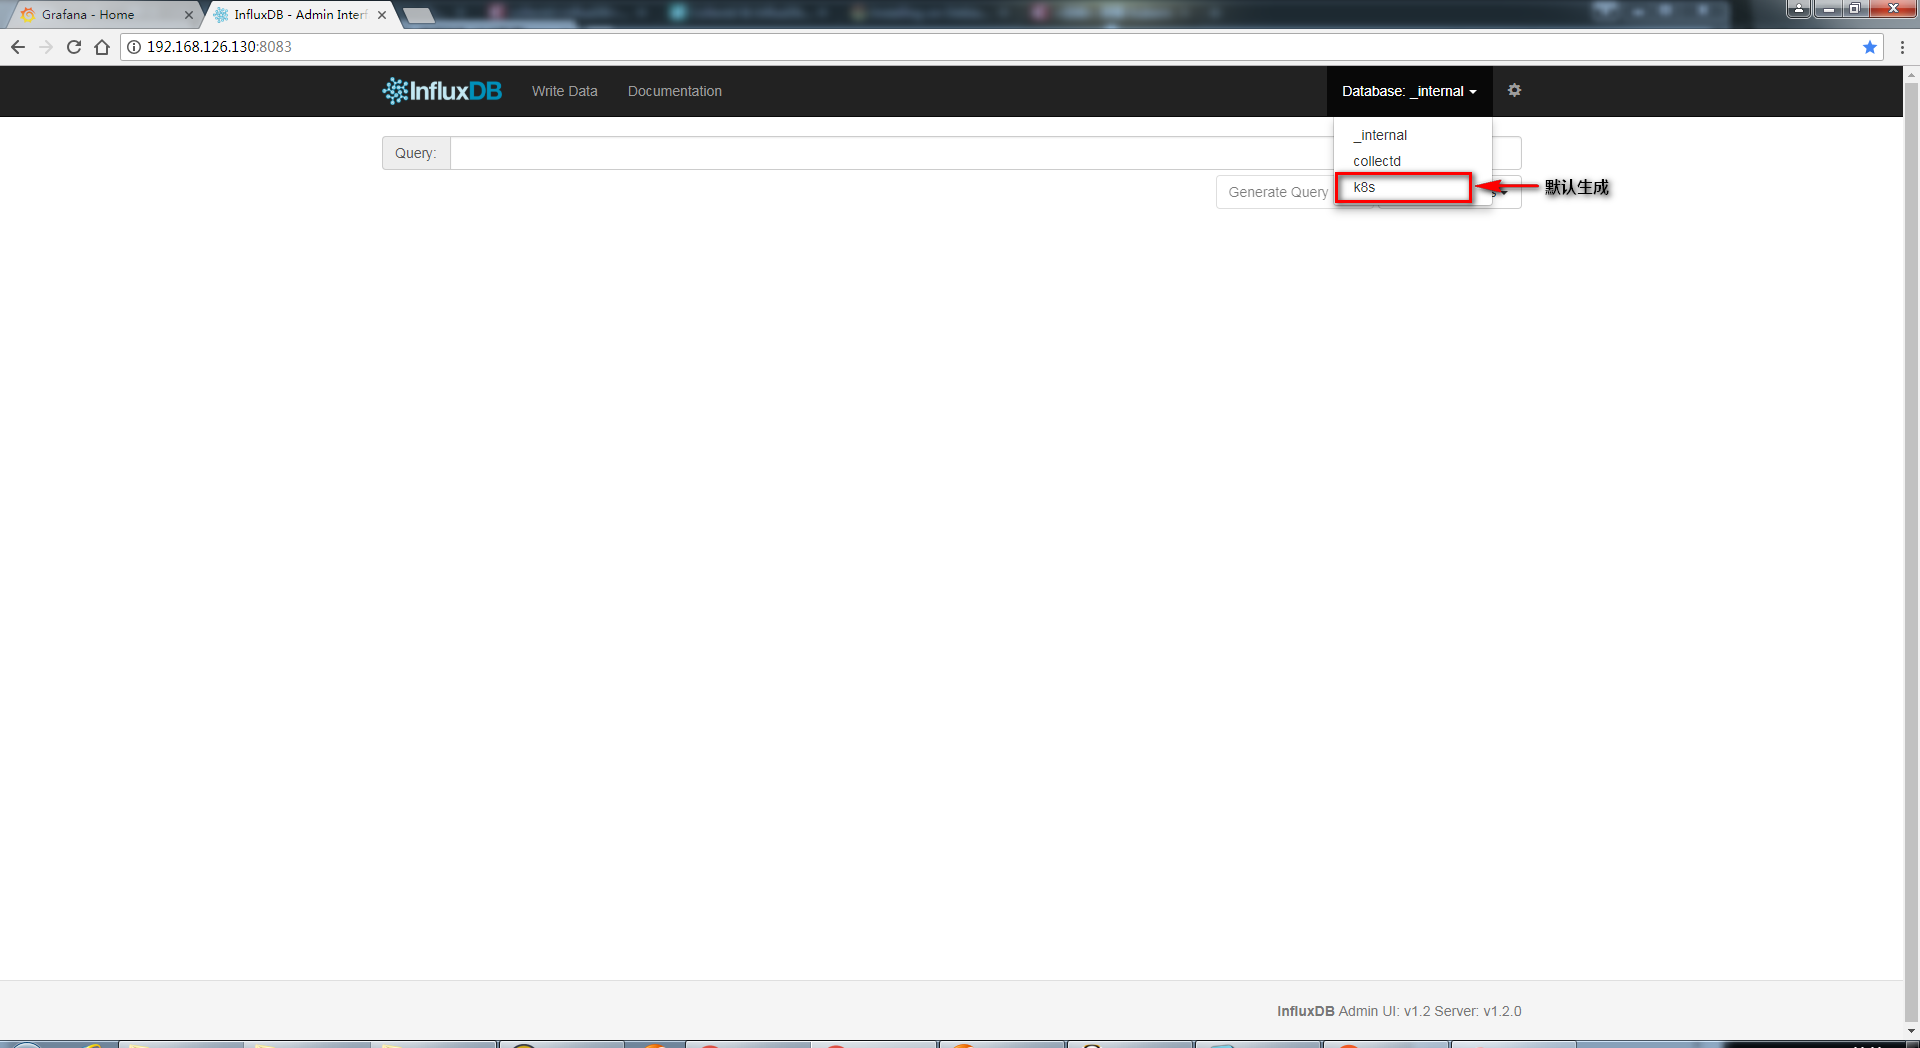
heapster与influxdb相互配置之后,Heapster容器单独启动时,会连接influxdb,并创建名为k8s的数据库!!!!!
3:Grafana安装
3.1:下载安装
wget https://s3-us-west-2.amazonaws.com/grafana-releases/release/grafana-5.1.3-1.x86_64.rpm
sudo yum localinstall grafana-5.1.3-1.x86_64.rpm
grafana目录结构:
/usr/sbin/grafana-server
/etc/init.d/grafana-server          ##上述命令的拷贝,启动脚本
/etc/sysconfig/grafana-server       ##环境变量
/etc/grafana/grafana.ini            ##配置文件
/var/log/grafana/grafana.log        ##日志文件
/var/lib/grafana/grafana.db         ##sqlite3数据库
3.2:启动
[root@MyCentos7 grafana]# systemctl start grafana-server.service       ##启动
[root@MyCentos7 grafana]# systemctl enable grafana-server.service      ##开机自启动
[root@MyCentos7 grafana]# systemctl status grafana-server.service      ##查看状态
● grafana-server.service - Grafana instance
   Loaded: loaded (/usr/lib/systemd/system/grafana-server.service; enabled; vendor preset: disabled)
   Active: active (running) since 二 2018-06-19 09:29:10 CST; 1h 25min ago
     Docs: http://docs.grafana.org
 Main PID: 1133 (grafana-server)
   Memory: 41.1M
   CGroup: /system.slice/grafana-server.service
           └─1133 /usr/sbin/grafana-server --config=/etc/grafana/grafana.ini --pidfile=/var/run/grafana/grafana-serv...

6月 19 09:29:09 MyCentos7 grafana-server[1133]: t=2018-06-19T09:29:09+0800 lvl=info msg="Executing migration" l...ser"
6月 19 09:29:09 MyCentos7 grafana-server[1133]: t=2018-06-19T09:29:09+0800 lvl=info msg="Skipping migration con...ser"
6月 19 09:29:09 MyCentos7 grafana-server[1133]: t=2018-06-19T09:29:09+0800 lvl=info msg="Starting plugin search...gins
6月 19 09:29:10 MyCentos7 grafana-server[1133]: t=2018-06-19T09:29:10+0800 lvl=info msg="Initializing Alerting"...gine
6月 19 09:29:10 MyCentos7 grafana-server[1133]: t=2018-06-19T09:29:10+0800 lvl=info msg="Initializing CleanUpSe...anup
6月 19 09:29:10 MyCentos7 systemd[1]: Started Grafana instance.
6月 19 09:29:11 MyCentos7 grafana-server[1133]: t=2018-06-19T09:29:11+0800 lvl=info msg="Initializing Stream Manager"
6月 19 09:29:11 MyCentos7 grafana-server[1133]: t=2018-06-19T09:29:11+0800 lvl=info msg="Initializing HTTP Serv...ket=
6月 19 09:31:11 MyCentos7 grafana-server[1133]: t=2018-06-19T09:31:11+0800 lvl=info msg="Request Completed" log...rer=
6月 19 09:31:11 MyCentos7 grafana-server[1133]: t=2018-06-19T09:31:11+0800 lvl=info msg="Request Completed" log...rer=
Hint: Some lines were ellipsized, use -l to show in full.
3.3:查看端口(默认3000)
[root@MyCentos7 grafana]# netstat -tnlp
Active Internet connections (only servers)
Proto Recv-Q Send-Q Local Address           Foreign Address         State       PID/Program name
tcp        0      0 0.0.0.0:111             0.0.0.0:*               LISTEN      1/systemd
tcp        0      0 192.168.122.1:53        0.0.0.0:*               LISTEN      1588/dnsmasq
tcp        0      0 0.0.0.0:22              0.0.0.0:*               LISTEN      1125/sshd
tcp        0      0 127.0.0.1:631           0.0.0.0:*               LISTEN      1126/cupsd
tcp        0      0 127.0.0.1:25            0.0.0.0:*               LISTEN      1366/master
tcp        0      0 127.0.0.1:6010          0.0.0.0:*               LISTEN      2124/sshd: root@pts
tcp6       0      0 :::6443                 :::*                    LISTEN      1577/kube-apiserver
tcp6       0      0 :::2379                 :::*                    LISTEN      1138/etcd
tcp6       0      0 :::10251                :::*                    LISTEN      718/kube-scheduler
tcp6       0      0 :::2380                 :::*                    LISTEN      1138/etcd
tcp6       0      0 :::10252                :::*                    LISTEN      804/kube-controller
tcp6       0      0 :::111                  :::*                    LISTEN      1/systemd
tcp6       0      0 :::8080                 :::*                    LISTEN      1577/kube-apiserver
tcp6       0      0 :::8083                 :::*                    LISTEN      1132/influxd
tcp6       0      0 :::8086                 :::*                    LISTEN      1132/influxd
tcp6       0      0 :::22                   :::*                    LISTEN      1125/sshd
tcp6       0      0 ::1:631                 :::*                    LISTEN      1126/cupsd
tcp6       0      0 :::3000                 :::*                    LISTEN      1133/grafana-server
tcp6       0      0 :::8088                 :::*                    LISTEN      1132/influxd
tcp6       0      0 ::1:25                  :::*                    LISTEN      1366/master
tcp6       0      0 ::1:6010                :::*                    LISTEN      2124/sshd: root@pts
tcp6       0      0 :::4001                 :::*                    LISTEN      1138/etcd
tcp6       0      0 :::9994                 :::*                    LISTEN      1816/docker-proxy-c
[root@MyCentos7 grafana]#
3.4:访问
浏览器打开,http://192.168.126.130:3000
默认用户名密码,admin/admin

4:grafana配置influxdb+heapster
4.1:配置influxdb数据源(heapster在influxdb中已生成名为k8s的数据库)
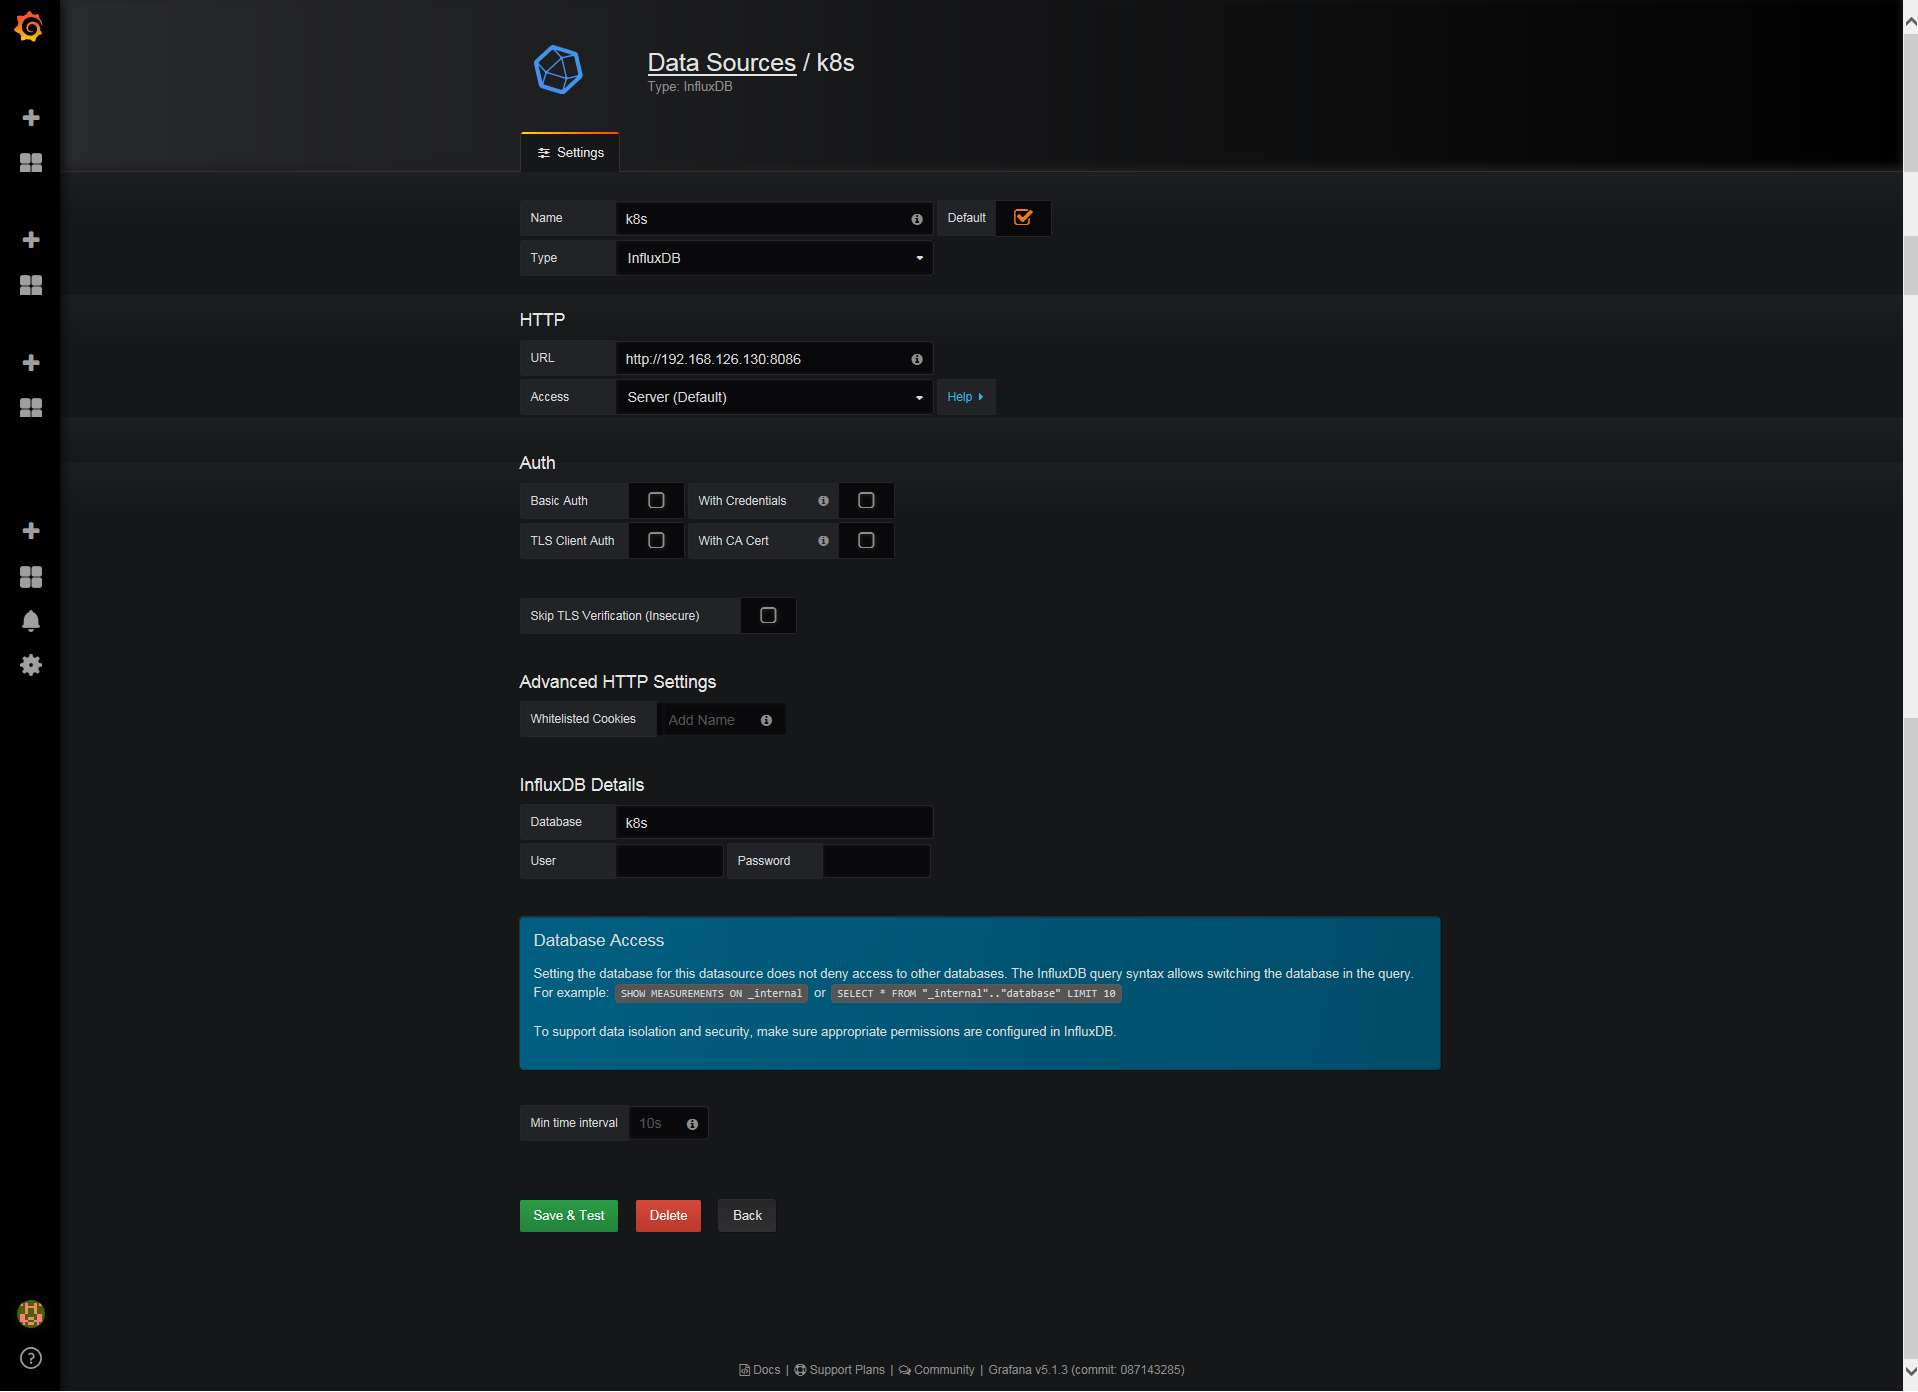
保存。
有可能出现的报错:
1、保存并测试时报错:Network Error: Bad Gateway(502)是数据库http的ip配置问题几个都设置成127.0.0.1
2、提示不是私密链接不让保存
4.2导入配置模板
4.2.1:导入步骤
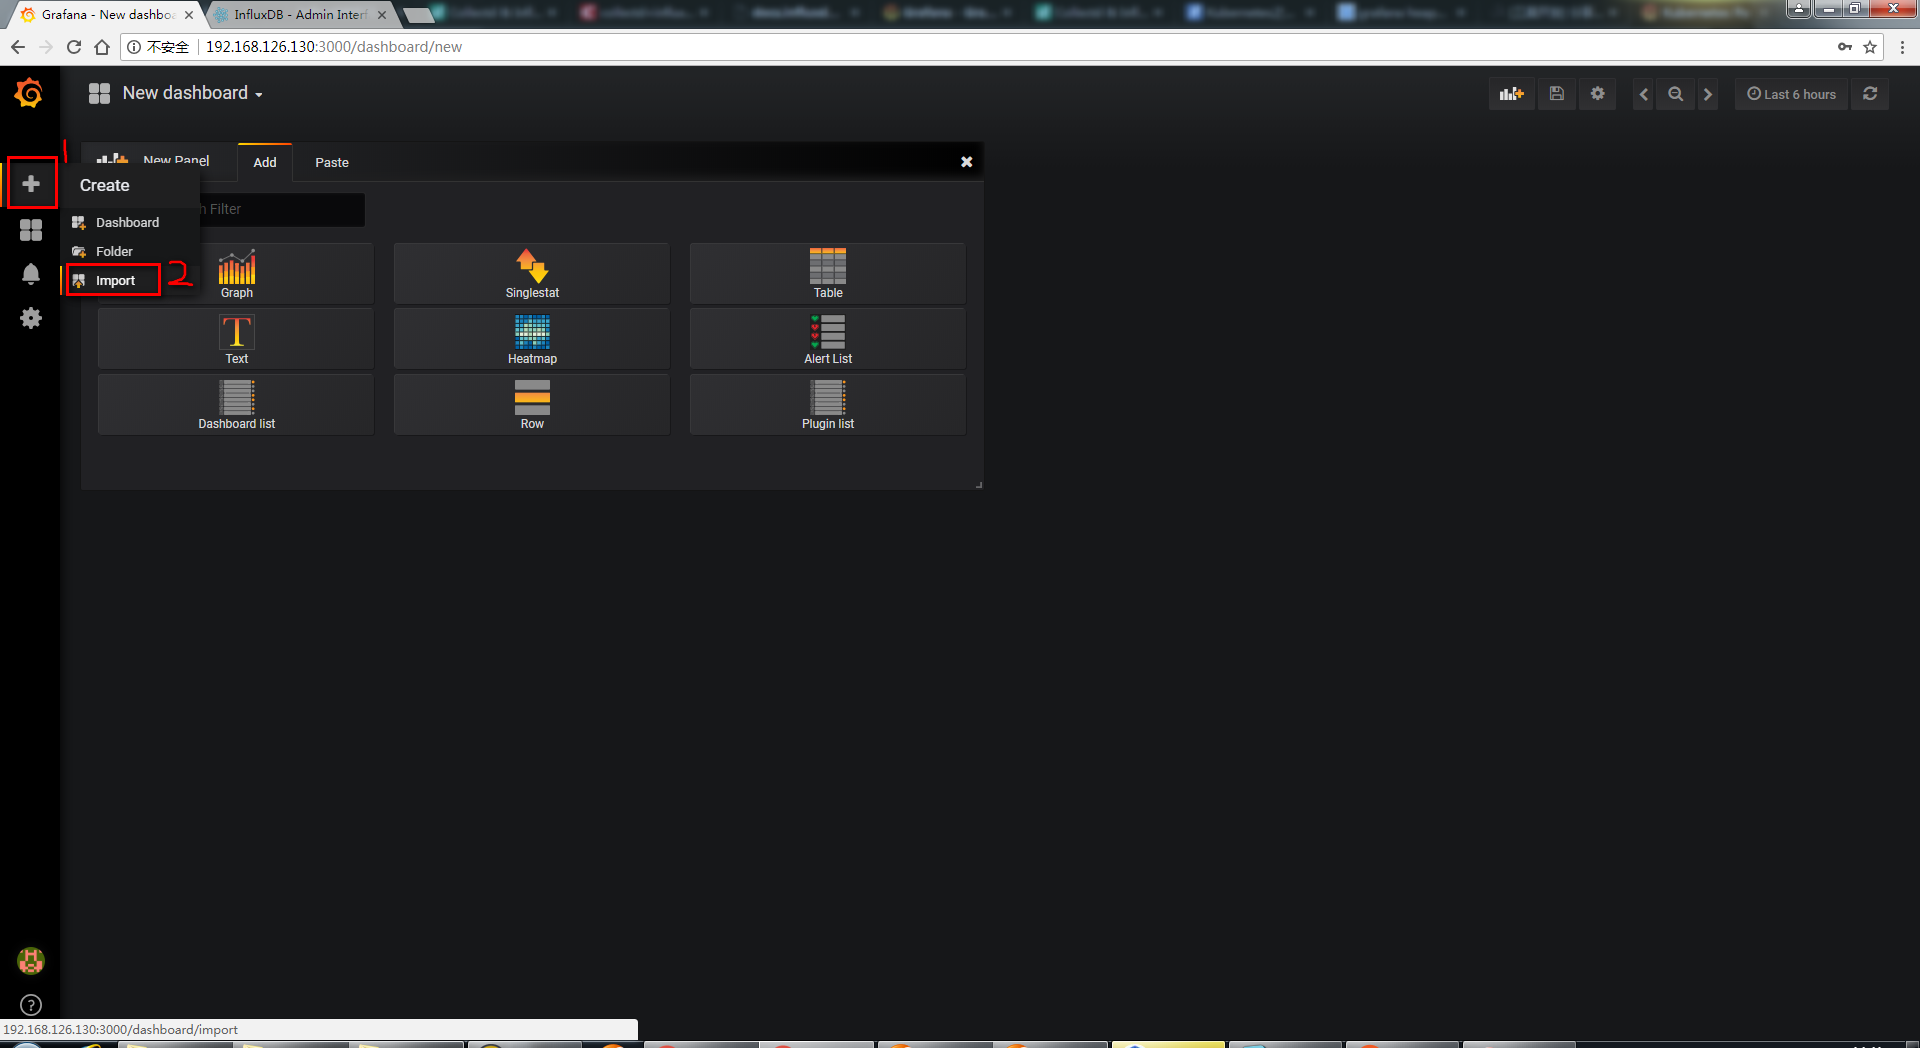

参见:http://docs.grafana.org/reference/export_import/
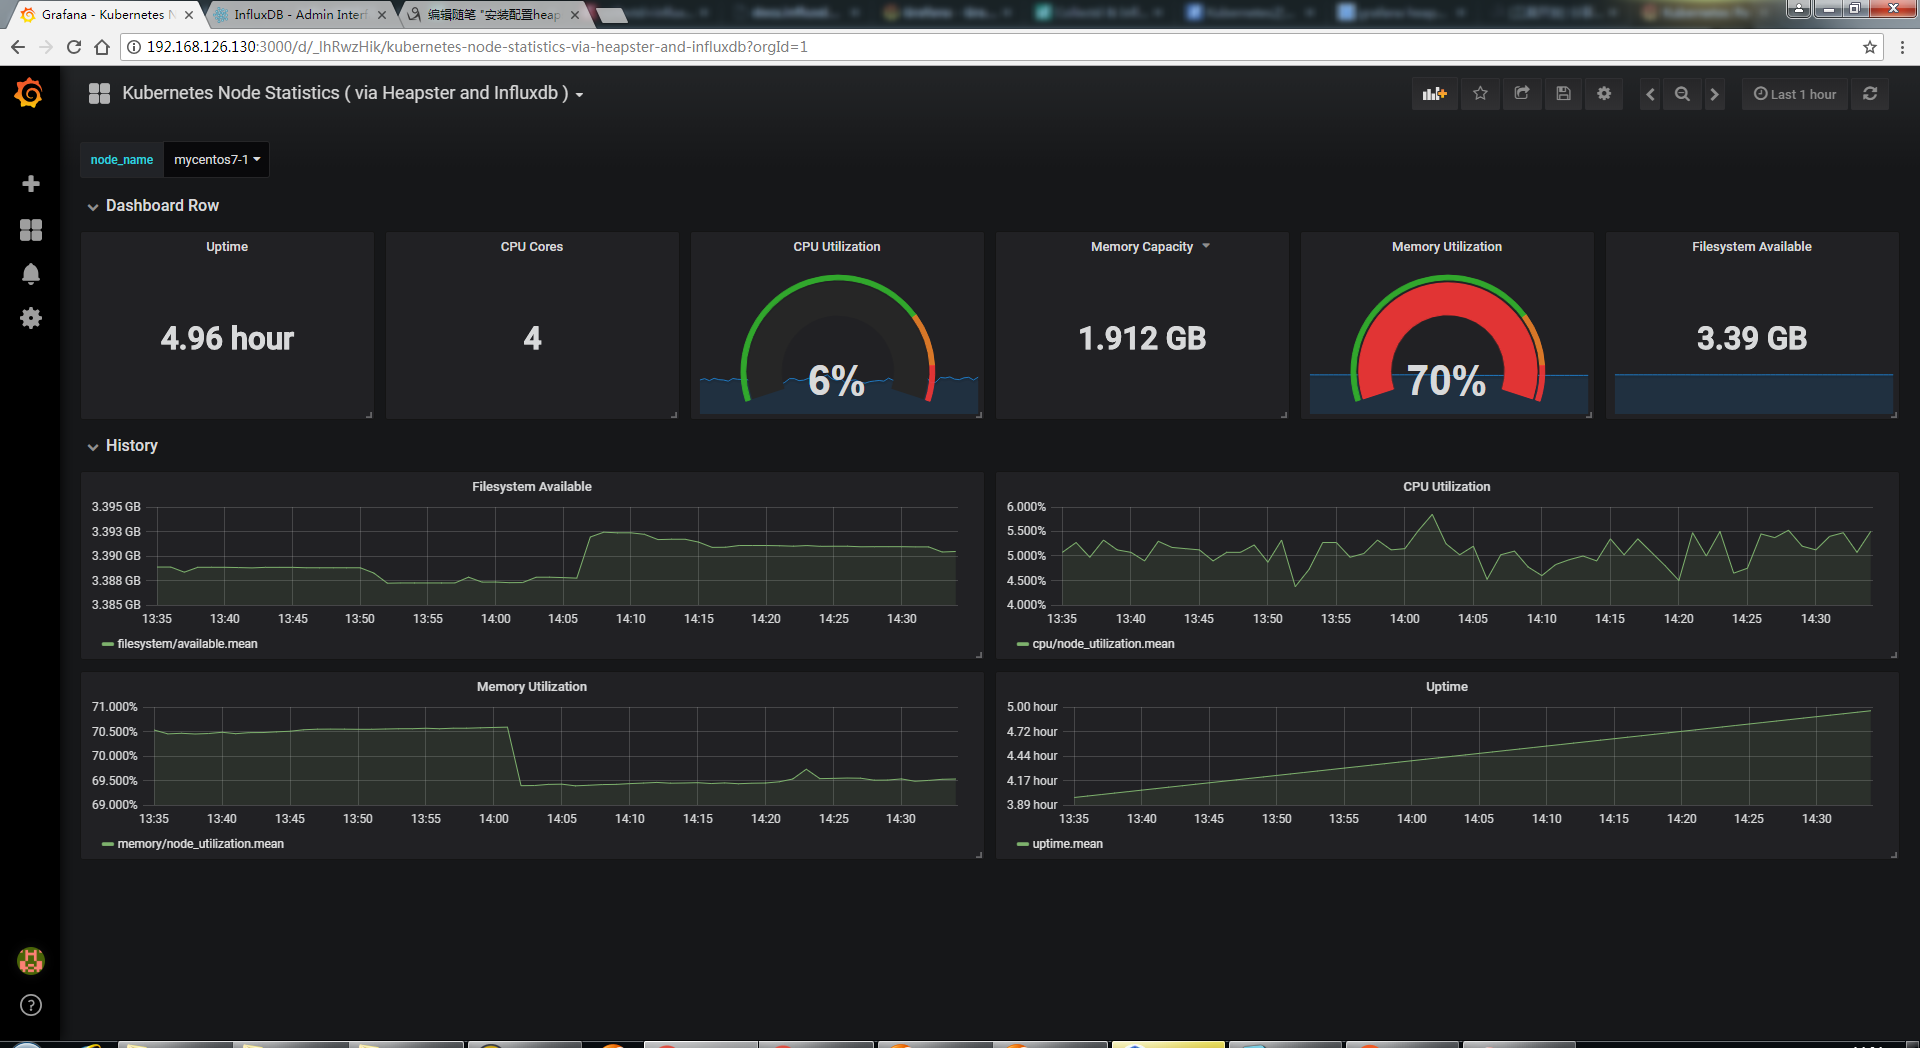
4.2.2 官方集成heapster和influxdb的模板
模板1:Kubernetes Node Statistics ( via Heapster and Influxdb )
下载地址:https://grafana.com/dashboards/3646
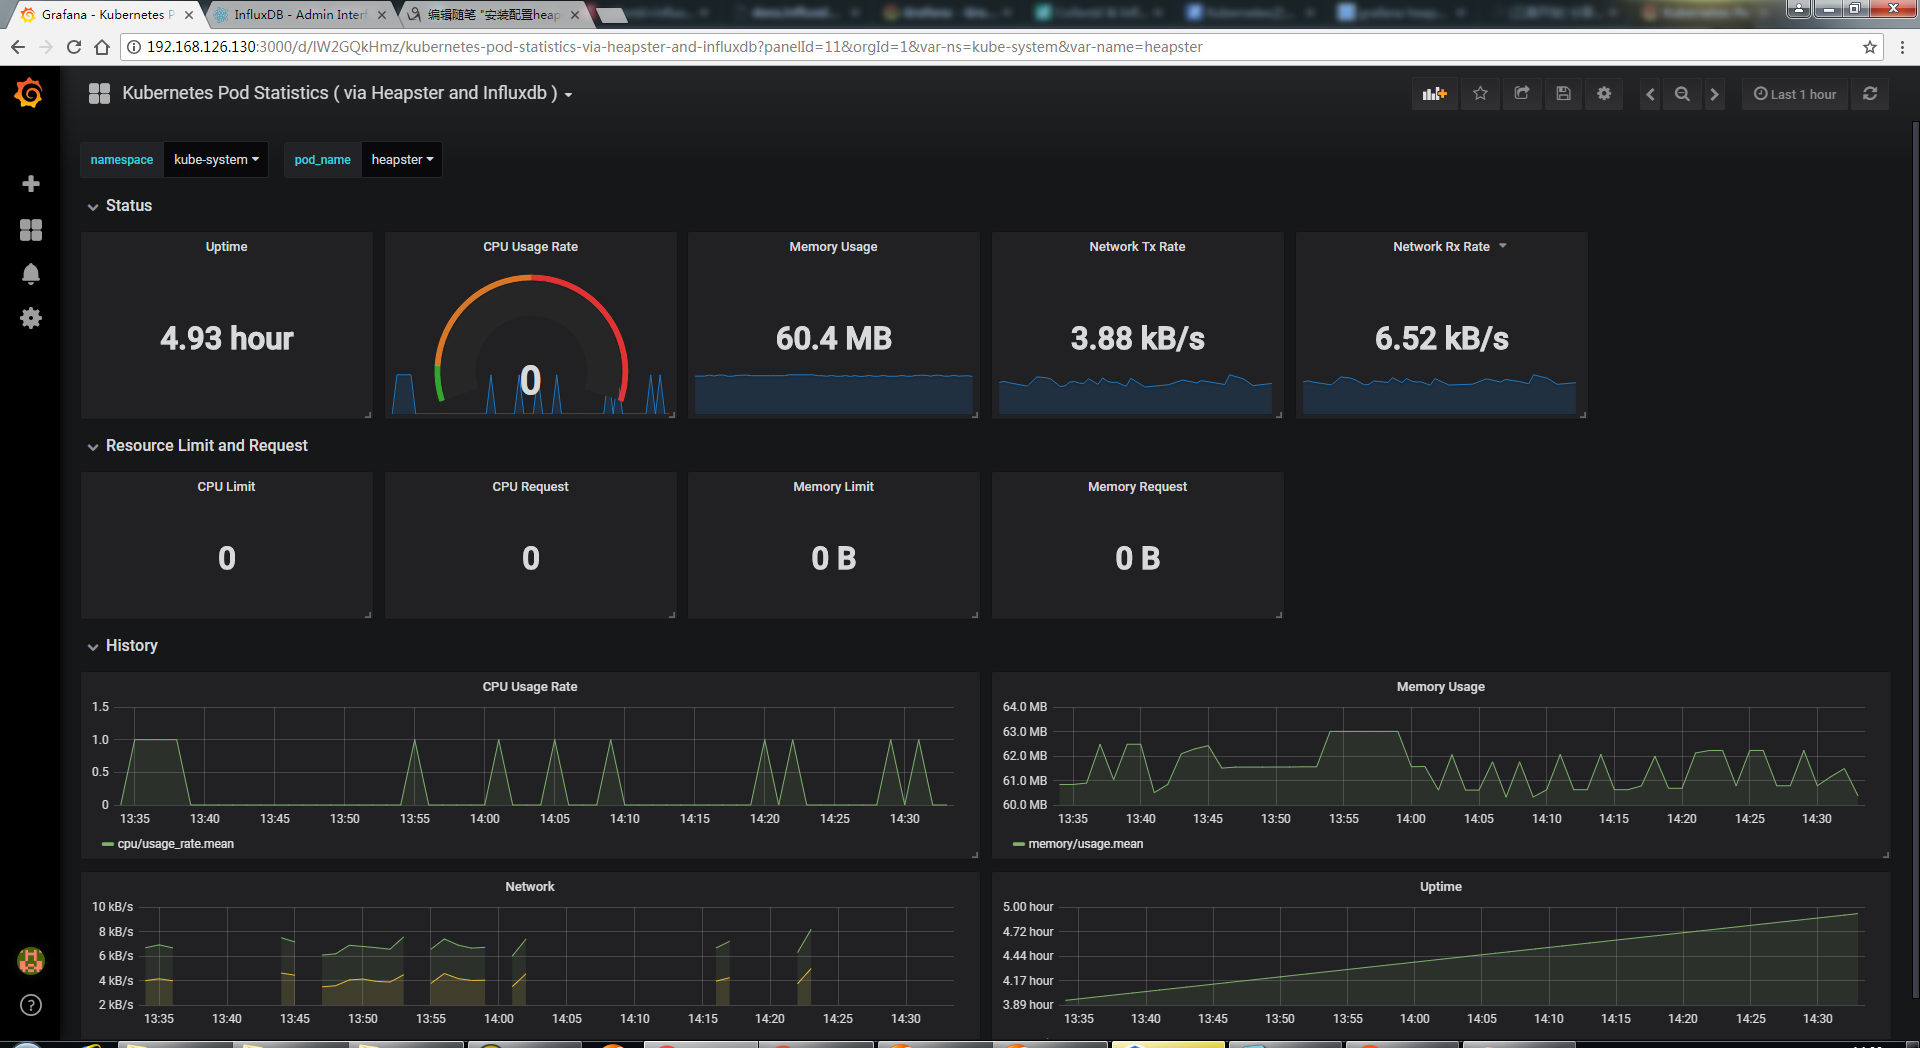
模板2:Kubernetes Pod Statistics ( via Heapster and Influxdb )
下载地址:https://grafana.com/dashboards/3649
4.3:自定义展示样式
根据自己需要,配置想要展示的图形。
参见grafana官方样式demo:
遇到的问题
安装
执行heapster.yaml之后发现此pod报错
[root@MyCentos7 heapster]# kubectl get pod -n kube-system 【查看】
NAME READY STATUS RESTARTS AGE
heapster-536928098-lq6rw 0/1 CrashLoopBackOff 1 13s
kubernetes-dashboard-2094756401-k09kb 1/1 Running 3 1d
monitoring-grafana-994836776-7v5vs 1/1 Running 0 2h
monitoring-influxdb-528312800-c5mc5 1/1 Running 0 2h
查看详细信息
[root@MyCentos7 heapster]# kubectl describe pod heapster-536928098-lq6rw -n kube-system 【查看详情】
.
.
.
Events:
FirstSeen    LastSeen    Count    From    SubObjectPath    Type    Reason    Message
---------    --------    -----    ----    -------------    --------    ------    -------
43s    43s    1    {default-scheduler }    Normal    Scheduled    Successfully assigned heapster-536928098-lq6rw to mycentos7-1
42s    42s    1    {kubelet mycentos7-1}    spec.containers{heapster}    Normal    Created    Created container with docker id 5ebff0e56512; Security:[seccomp=unconfined]
42s    42s    1    {kubelet mycentos7-1}    spec.containers{heapster}    Normal    Started    Started container with docker id 5ebff0e56512
41s    41s    1    {kubelet mycentos7-1}    spec.containers{heapster}    Normal    Started    Started container with docker id 942b1e9a5475
41s    41s    1    {kubelet mycentos7-1}    spec.containers{heapster}    Normal    Created    Created container with docker id 942b1e9a5475; Security:[seccomp=unconfined]
40s    39s    2    {kubelet mycentos7-1}    Warning    FailedSync    Error syncing pod, skipping: failed to "StartContainer" for "heapster" with CrashLoopBackOff: "Back-off 10s restarting failed container=heapster pod=heapster-536928098-lq6rw_kube-system(ae2c26f4-6a44-11e8-bca6-000c29db8621)"

43s    24s    4    {kubelet mycentos7-1}    Warning    MissingClusterDNS    kubelet does not have ClusterDNS IP configured and cannot create Pod using "ClusterFirst" policy. Falling back to DNSDefault policy.
42s    24s    3    {kubelet mycentos7-1}    spec.containers{heapster}    Normal    Pulled    Container image "daocloud.io/megvii/heapster-amd64:v1.5.1" already present on machine
24s    24s    1    {kubelet mycentos7-1}    spec.containers{heapster}    Normal    Created    Created container with docker id 8722d44da2f3; Security:[seccomp=unconfined]
24s    24s    1    {kubelet mycentos7-1}    spec.containers{heapster}    Normal    Started    Started container with docker id 8722d44da2f3
40s    12s    4    {kubelet mycentos7-1}    spec.containers{heapster}    Warning    BackOff    Back-off restarting failed docker container
24s    12s    2    {kubelet mycentos7-1}    Warning    FailedSync    Error syncing pod, skipping: failed to "StartContainer" for "heapster" with CrashLoopBackOff: "Back-off 20s restarting failed container=heapster pod=heapster-536928098-lq6rw_kube-system(ae2c26f4-6a44-11e8-bca6-000c29db8621)"
以为是镜像的问题,就换了一个镜像,再重新安装一遍但是又报错
[root@MyCentos7 heapster]# kubectl delete -f heapster.yaml 【删除原来已安装的pod】
serviceaccount "heapster" deleted
deployment "heapster" deleted
service "heapster" deleted
[root@MyCentos7 heapster]# vim heapster.yaml 【修改镜像地址】
[root@MyCentos7 heapster]# kubectl create -f heapster.yaml 【再次安装】
serviceaccount "heapster" created
deployment "heapster" created
service "heapster" created
[root@MyCentos7 heapster]# kubectl get pod -n kube-system    【查看】
NAME READY STATUS RESTARTS AGE
heapster-3191791685-36chj 0/1 ContainerCreating 0 8s
kubernetes-dashboard-2094756401-k09kb 1/1 Running 3 1d
monitoring-grafana-994836776-7v5vs 1/1 Running 0 2h
monitoring-influxdb-528312800-c5mc5 1/1 Running 0 2h
再次查看安装详情
[root@MyCentos7 heapster]# kubectl describe pod heapster-3191791685-36chj -n kube-system 【查看详情】
.
.
.
Events:
FirstSeen    LastSeen    Count    From    SubObjectPath    Type    Reason    Message
---------    --------    -----    ----    -------------    --------    ------    -------
29s    29s    1    {kubelet mycentos7-1}    spec.containers{heapster}    Normal    Pulling    pulling image "daocloud.io/liukuan73/heapster-amd64:v1.5.2"
29s    29s    1    {default-scheduler }    Normal    Scheduled    Successfully assigned heapster-3191791685-36chj to mycentos7-1
19s    19s    1    {kubelet mycentos7-1}    spec.containers{heapster}    Normal    Started    Started container with docker id c58314f7fb9d
19s    19s    1    {kubelet mycentos7-1}    spec.containers{heapster}    Normal    Pulled    Successfully pulled image "daocloud.io/liukuan73/heapster-amd64:v1.5.2"
19s    19s    1    {kubelet mycentos7-1}    spec.containers{heapster}    Normal    Created    Created container with docker id 0f0222e9cda7; Security:[seccomp=unconfined]
19s    19s    1    {kubelet mycentos7-1}    spec.containers{heapster}    Normal    Started    Started container with docker id 0f0222e9cda7
19s    19s    1    {kubelet mycentos7-1}    spec.containers{heapster}    Normal    Created    Created container with docker id c58314f7fb9d; Security:[seccomp=unconfined]
18s    17s    2    {kubelet mycentos7-1}    Warning    FailedSync    Error syncing pod, skipping: failed to "StartContainer" for "heapster" with CrashLoopBackOff: "Back-off 10s restarting failed container=heapster pod=heapster-3191791685-36chj_kube-system(ef1a20f7-6a48-11e8-bca6-000c29db8621)"

29s    2s    4    {kubelet mycentos7-1}    Warning    MissingClusterDNS    kubelet does not have ClusterDNS IP configured and cannot create Pod using "ClusterFirst" policy. Falling back to DNSDefault policy.
18s    2s    3    {kubelet mycentos7-1}    spec.containers{heapster}    Warning    BackOff    Back-off restarting failed docker container
19s    2s    2    {kubelet mycentos7-1}    spec.containers{heapster}    Normal    Pulled    Container image "daocloud.io/liukuan73/heapster-amd64:v1.5.2" already present on machine
2s    2s    1    {kubelet mycentos7-1}    spec.containers{heapster}    Normal    Created    Created container with docker id 559f12cda043; Security:[seccomp=unconfined]
2s    2s    1    {kubelet mycentos7-1}    spec.containers{heapster}    Normal    Started    Started container with docker id 559f12cda043
2s    2s    1    {kubelet mycentos7-1}    Warning    FailedSync    Error syncing pod, skipping: failed to "StartContainer" for "heapster" with CrashLoopBackOff: "Back-off 20s restarting failed container=heapster pod=heapster-3191791685-36chj_kube-system(ef1a20f7-6a48-11e8-bca6-000c29db8621)"
里面报一样的错,所以验证与镜像无关
没有找到解决方法,只有查看此容器的日志
[root@MyCentos7 heapster]# kubectl logs heapster-3191791685-36chj -n kube-system
I0607 12:06:16.258534 1 heapster.go:78] /heapster --source=kubernetes:https://kubernetes.default --sink=influxdb:http://monitoring-influxdb.kube-system.svc:8086
I0607 12:06:16.258587 1 heapster.go:79] Heapster version v1.5.2
F0607 12:06:16.258645 1 heapster.go:183] Failed to create source provide: open /var/run/secrets/kubernetes.io/serviceaccount/token: no such file or directory
发现问题所在,赶紧查找解决方法
解决方法:
修改配置文件heapster.yaml
把 - --source=kubernetes:https://kubernetes.default 改成 - --source=kubernetes:http://《你的apiserver地址:相应的端口》?inClusterConfig=false
inClusterConfig=false : 不使用service accounts中的kube config信息;
于是再次删除已安装的pod,之后修改配置文件重新安装
[root@MyCentos7 heapster]# kubectl delete -f heapster.yaml
serviceaccount "heapster" deleted
deployment "heapster" deleted
service "heapster" deleted
[root@MyCentos7 heapster]# vim heapster.yaml
[root@MyCentos7 heapster]# kubectl create -f heapster.yaml
serviceaccount "heapster" created
deployment "heapster" created
service "heapster" created
[root@MyCentos7 heapster]# kubectl get pods -n kube-system
NAME READY STATUS RESTARTS AGE
heapster-4233553026-0t8nb 1/1 Running 0 14s
kubernetes-dashboard-2094756401-k09kb 1/1 Running 3 1d
monitoring-grafana-994836776-7v5vs 1/1 Running 0 3h
monitoring-influxdb-528312800-c5mc5 1/1 Running 0 3h
成功
参考:
https://tonybai.com/2017/01/20/integrate-heapster-for-kubernetes-dashboard/