在集群中启用监视功能,则有两种方法可以收集有关Kibana的指标
旧版收集方法
kibaba通过定时请求ES集群API,获取ES指标数据,将数据保存到ES索引中,然后通过查询ES索引数据,展示到页面上
官网文档:https://www.elastic.co/guide/en/kibana/7.x/monitoring-kibana.html
流程

1、启动Kibaban服务,打开监控菜单,使用内部收集
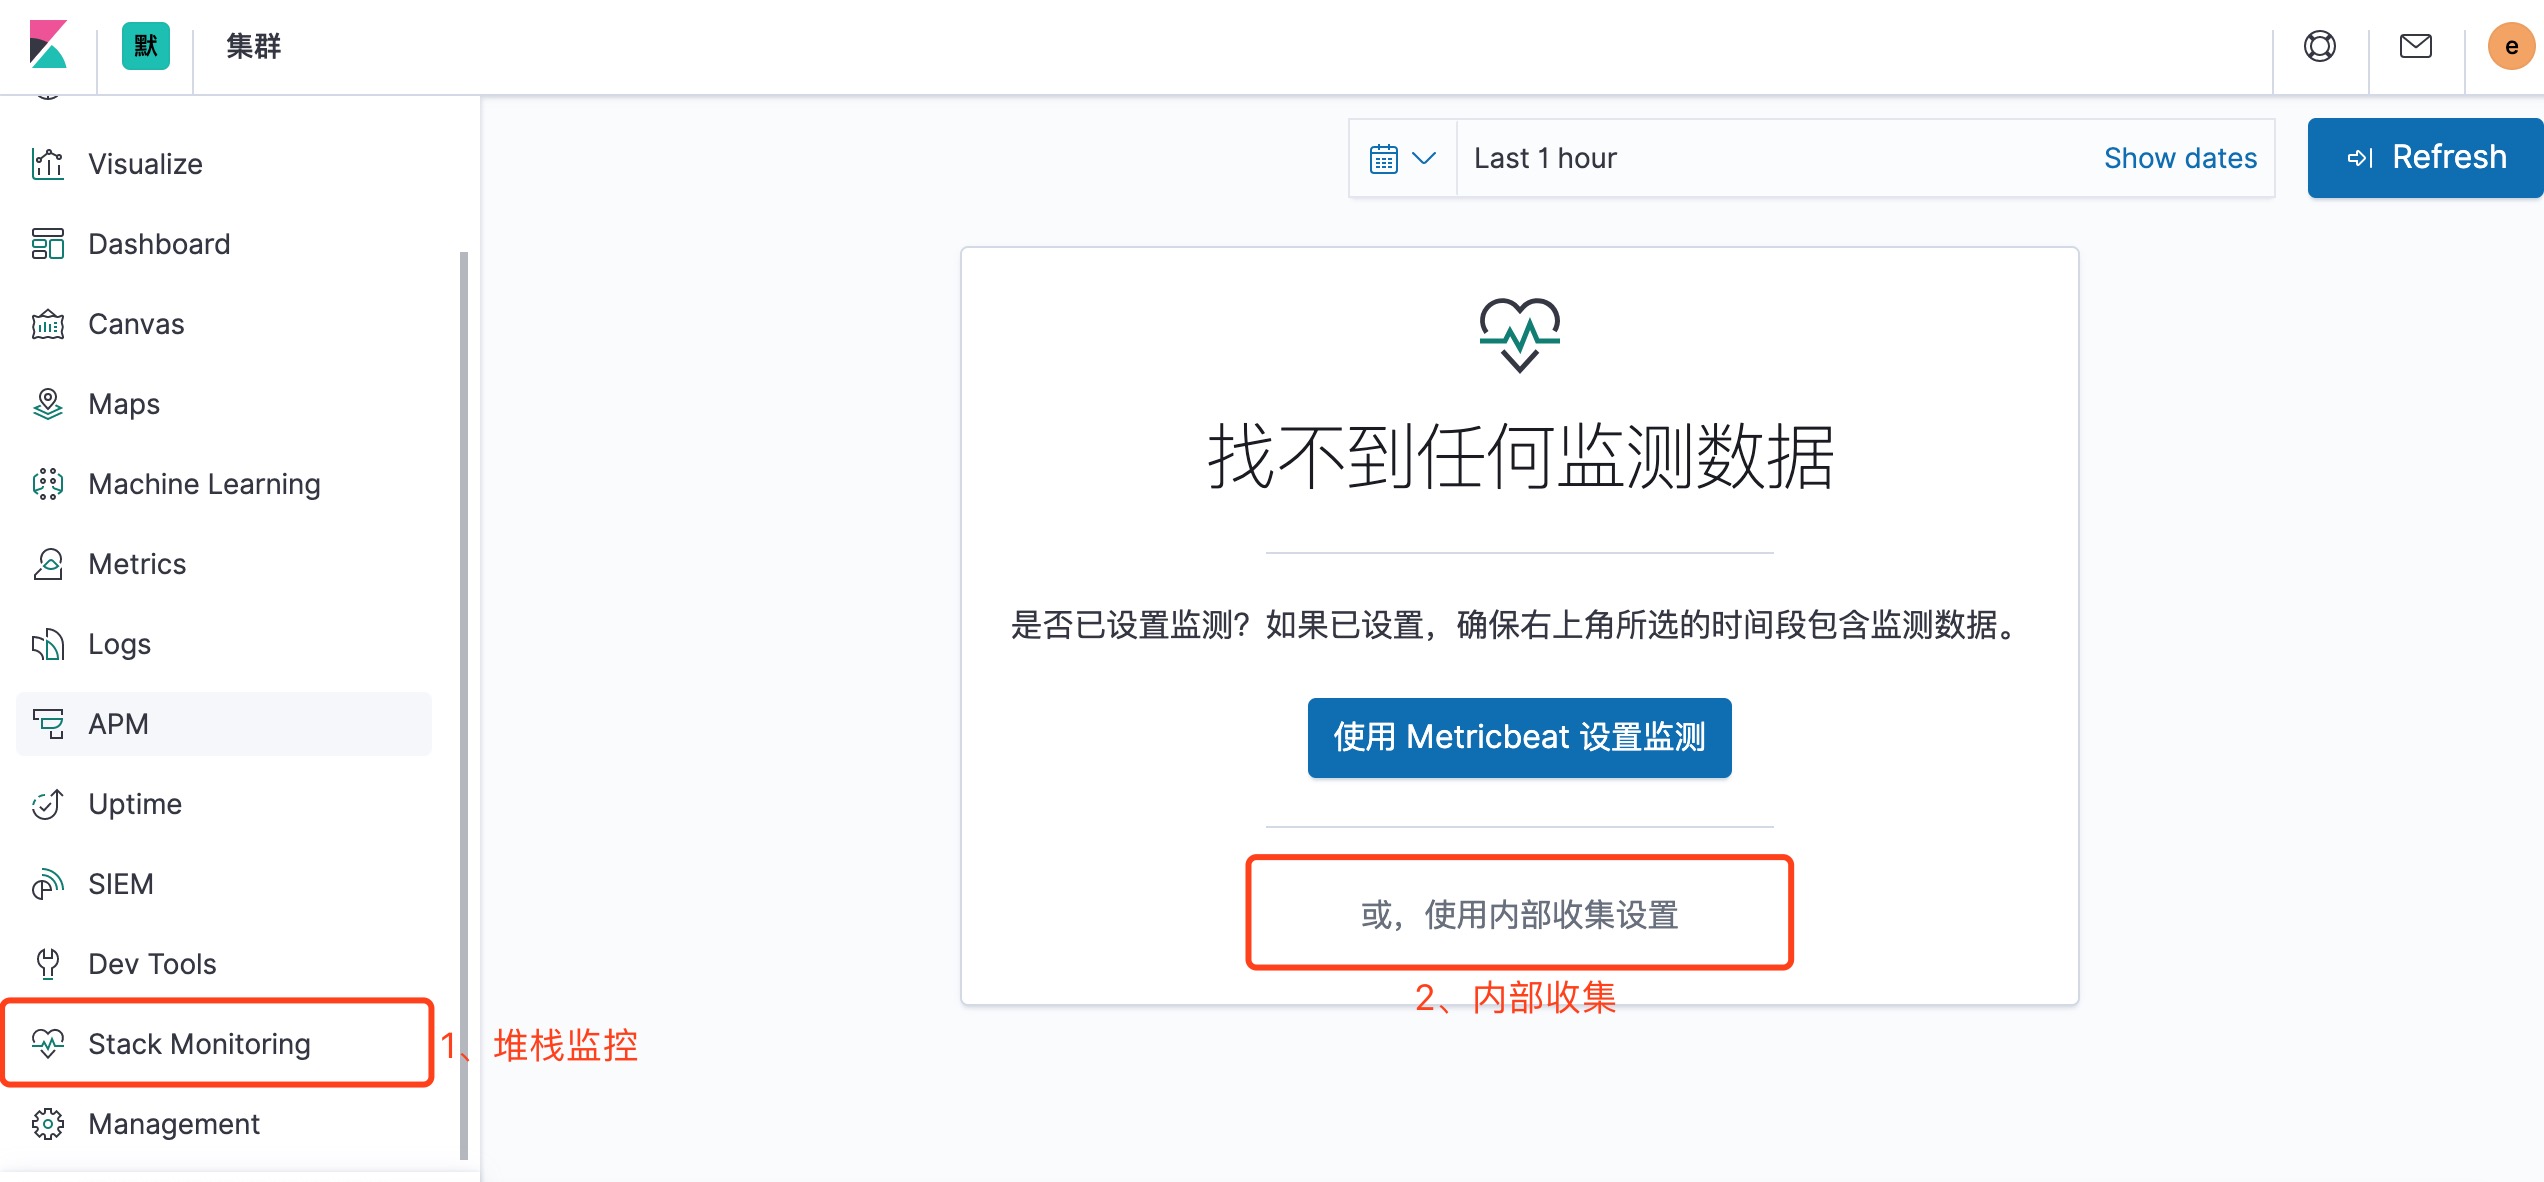
2、选择打开Monitoring即可
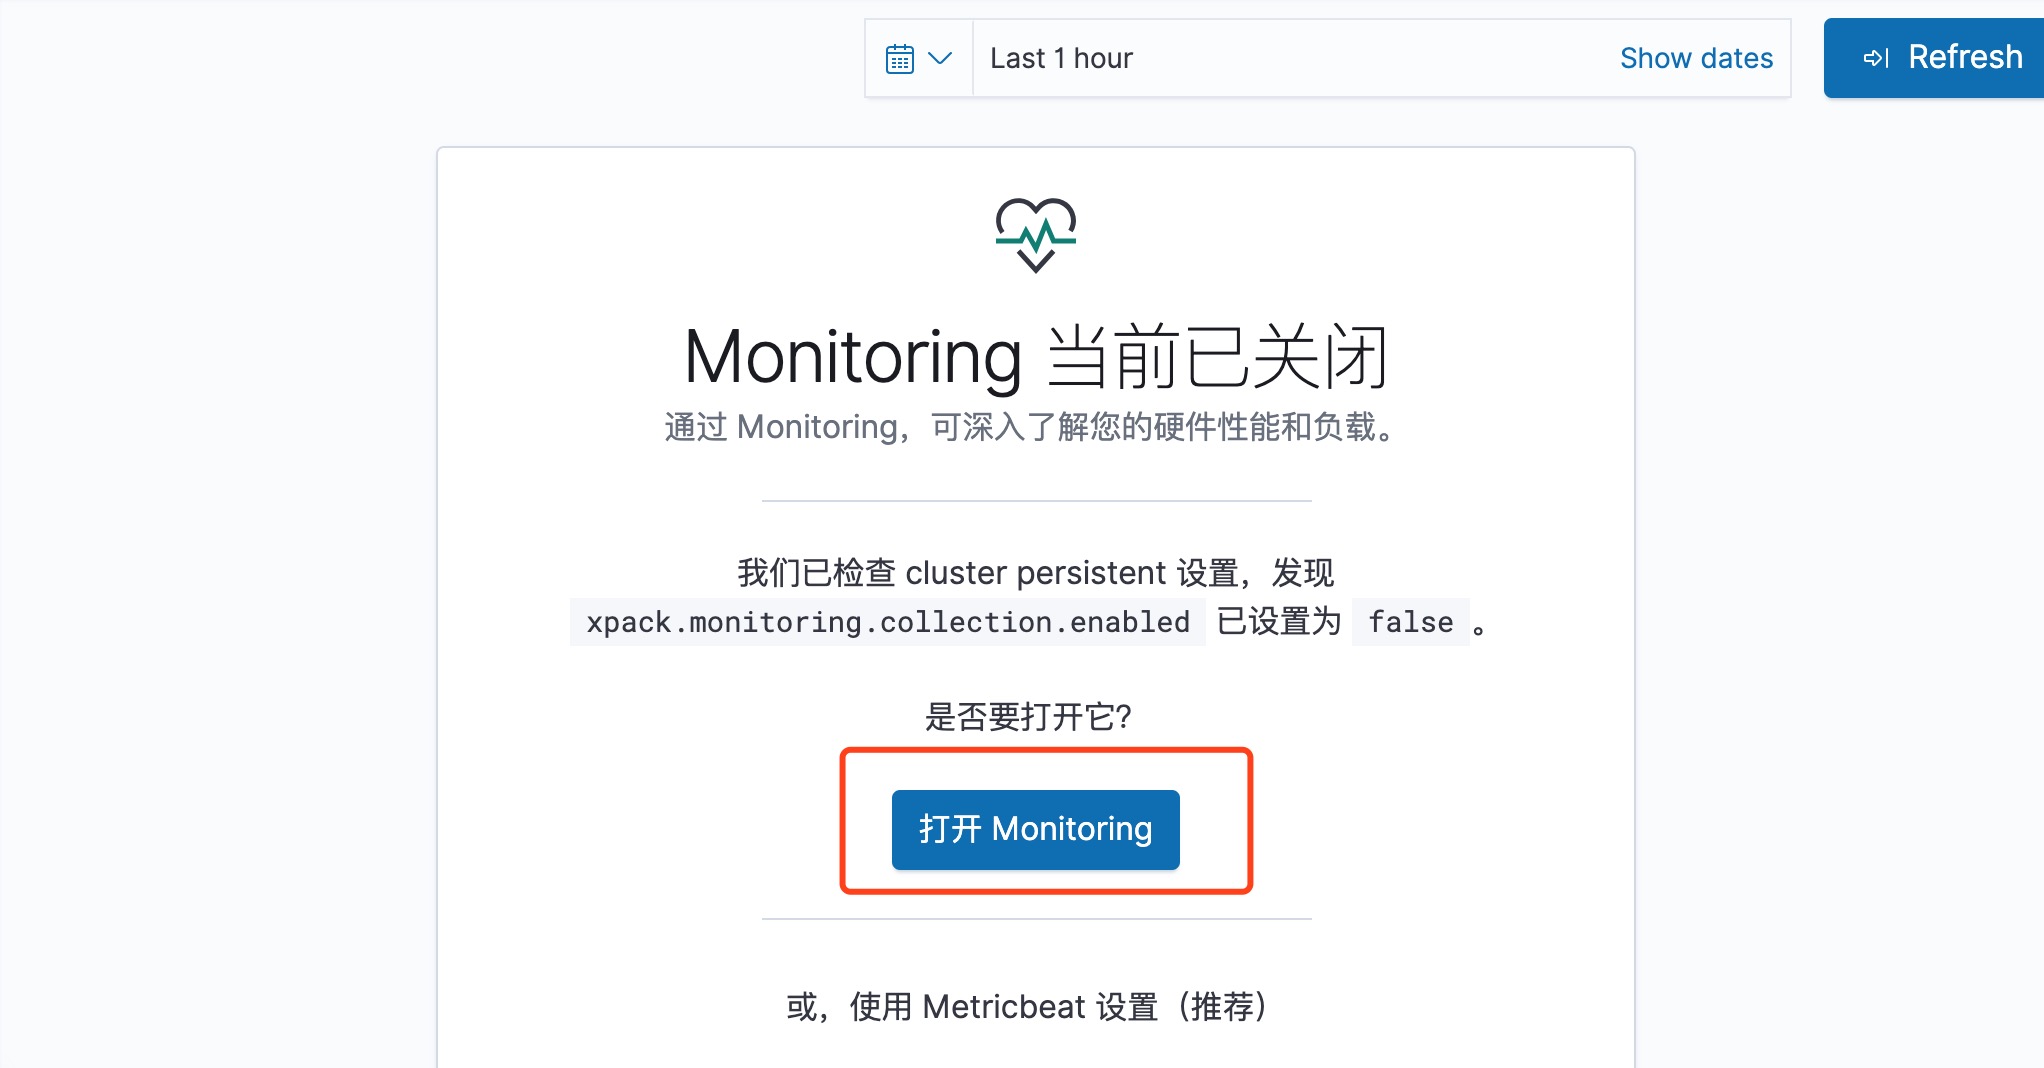
3、等待Kibana进行设置
1)主要是会打开es集群的 xpack.monitoring.collection.enabled 设置
即启动监控收集,此值默认是false
1 GET _cluster/settings
2
3 PUT _cluster/settings
4 {
5   "persistent": {
6     "xpack.monitoring.collection.enabled": true
7   }
8 }
2)还有kibana监控设置
monitoring.enabled:是否开启监控,默认值为ture
monitoring.kibana.collection.enabled:是否开启kibana监控收集,默认值为true
monitoring.ui.elasticsearch.hosts:指定存储监视数据的Elasticsearch集群的位置,默认值为:与elasticsearch.hosts相同
monitoring.ui.elasticsearch.username:指定存储监视数据的Elasticsearch集群的用户名,默认值为:elasticsearch.username设置的值
monitoring.ui.elasticsearch.password:指定存储监视数据的Elasticsearch集群的密码,默认值为:与elasticsearch.password相同
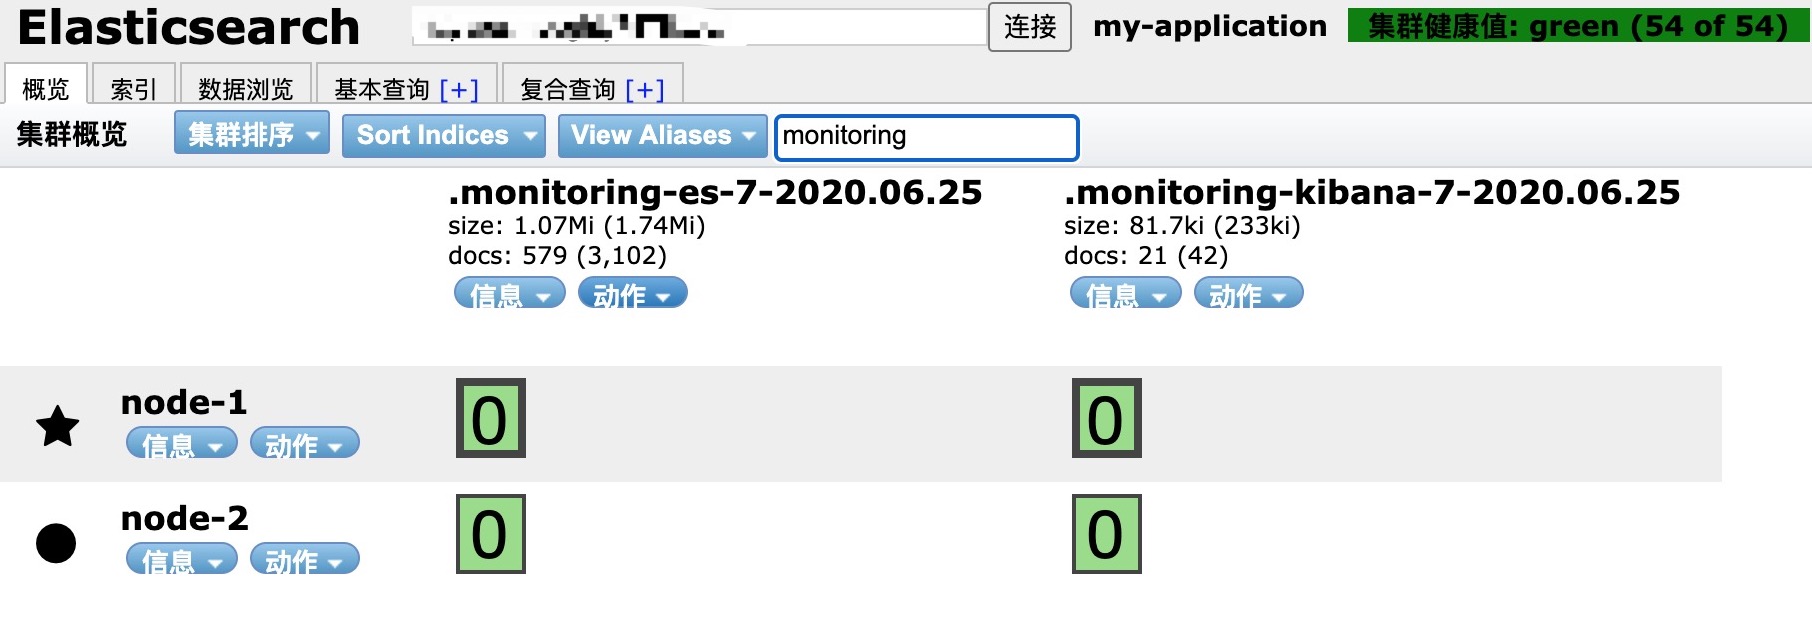
4、完成之后,会在ES中创建2个索引,用来存储监控数据
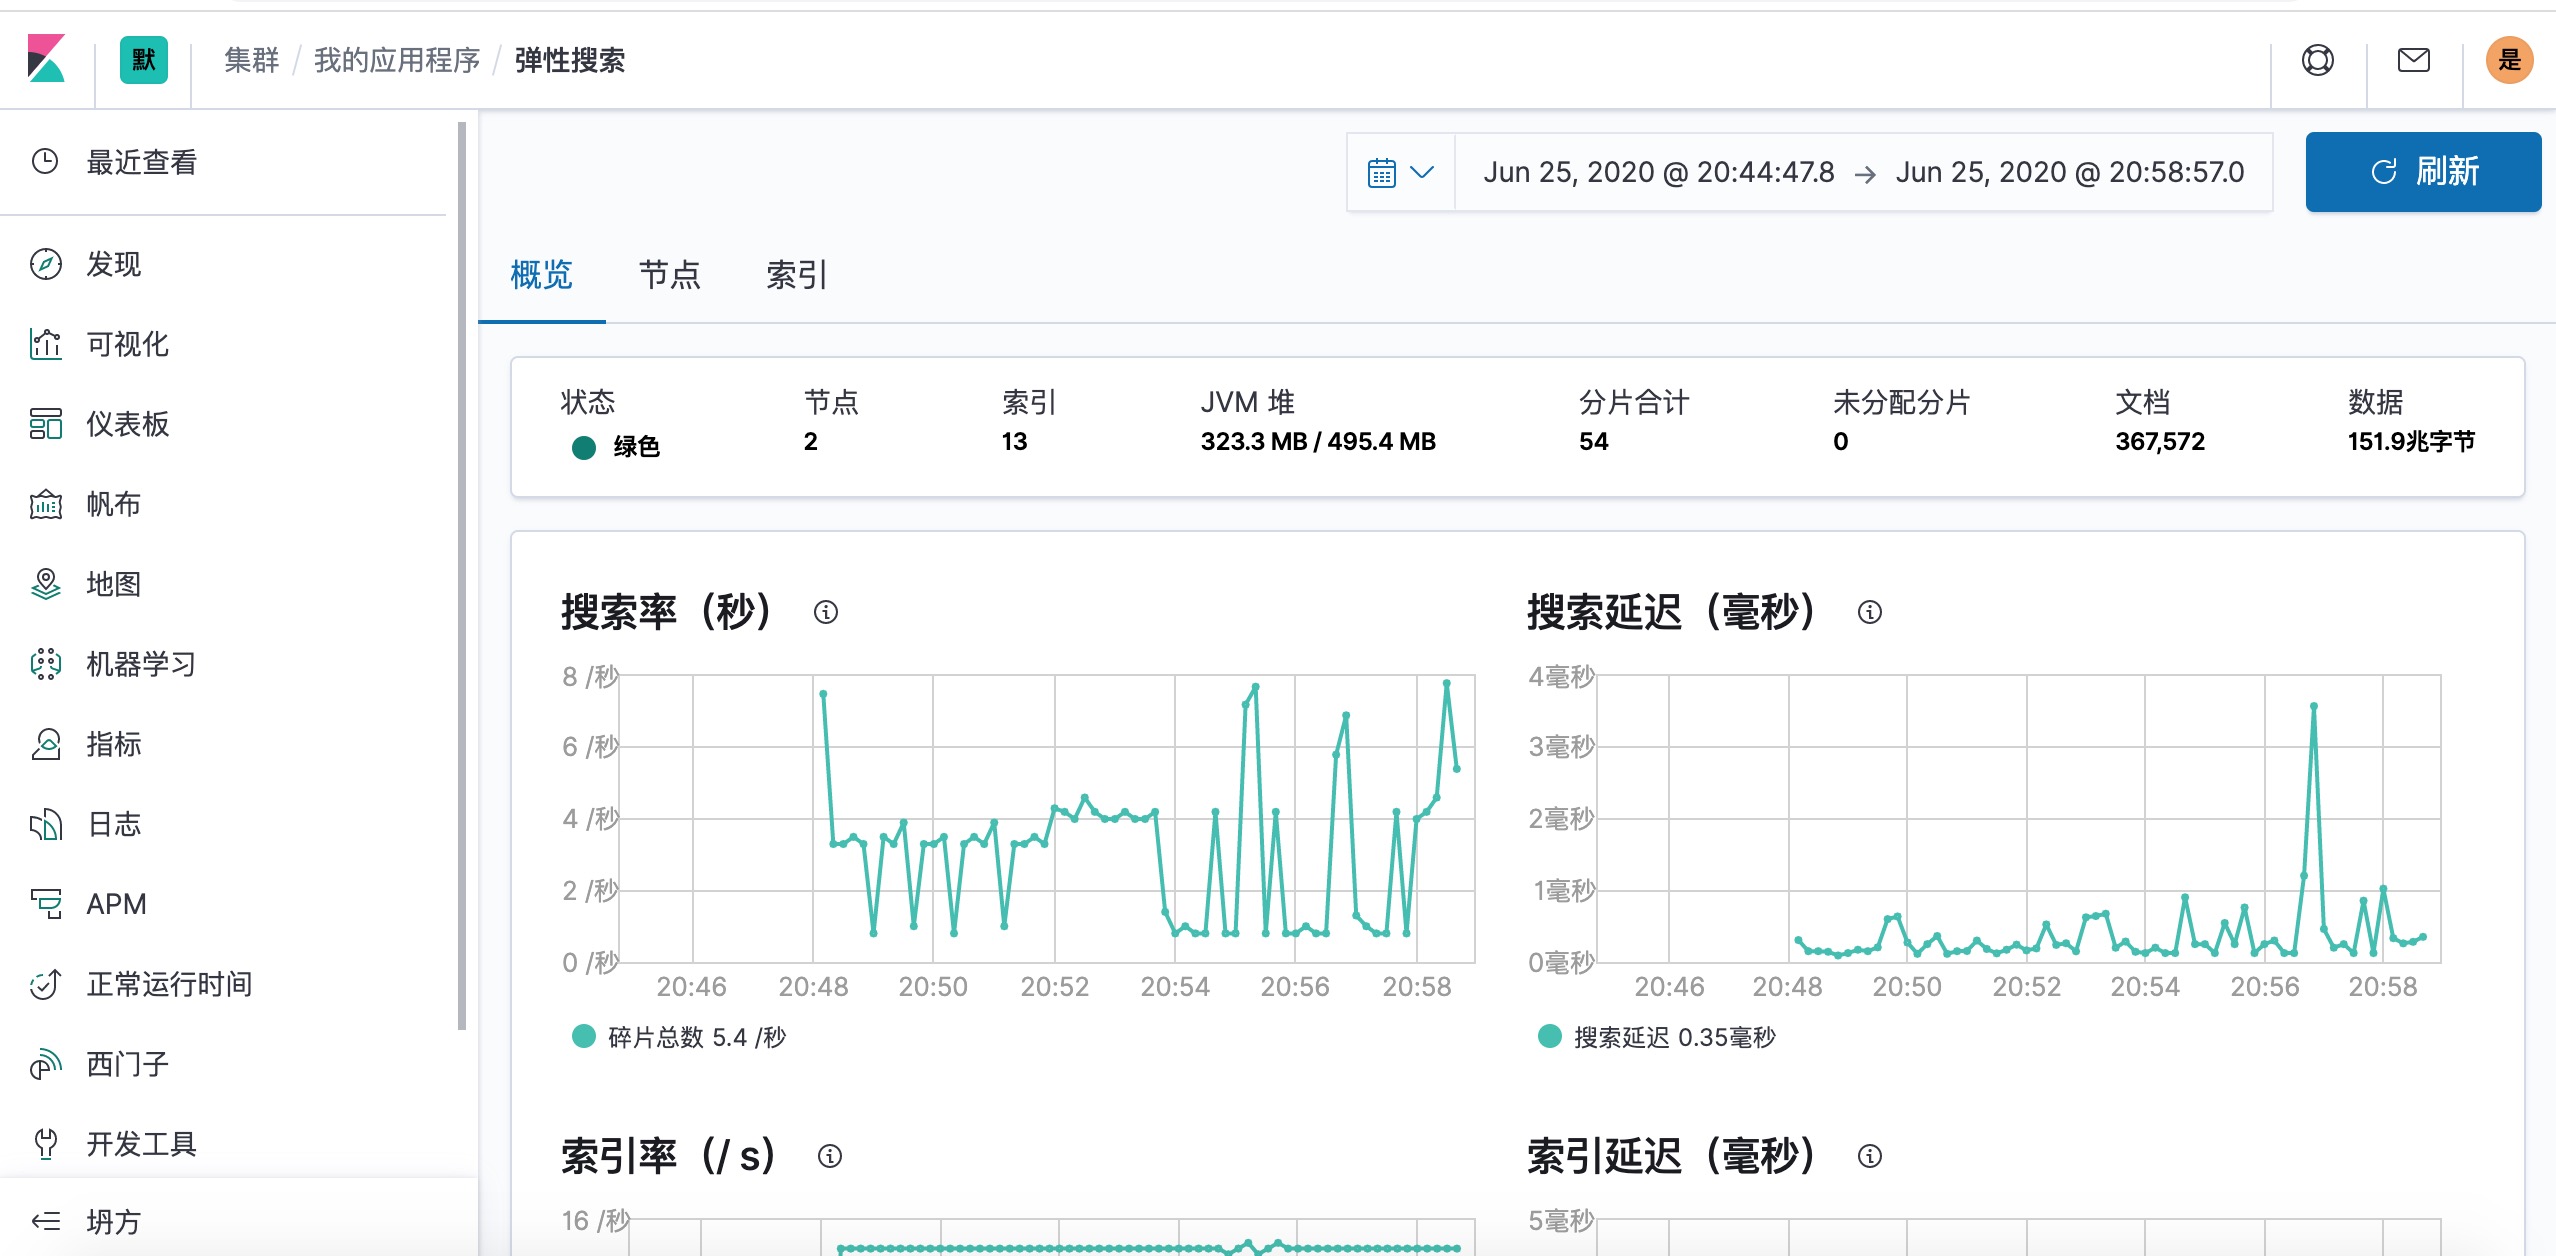
5、完成之后,自动进入概览,可以看到系统概览、节点信息、索引信息等
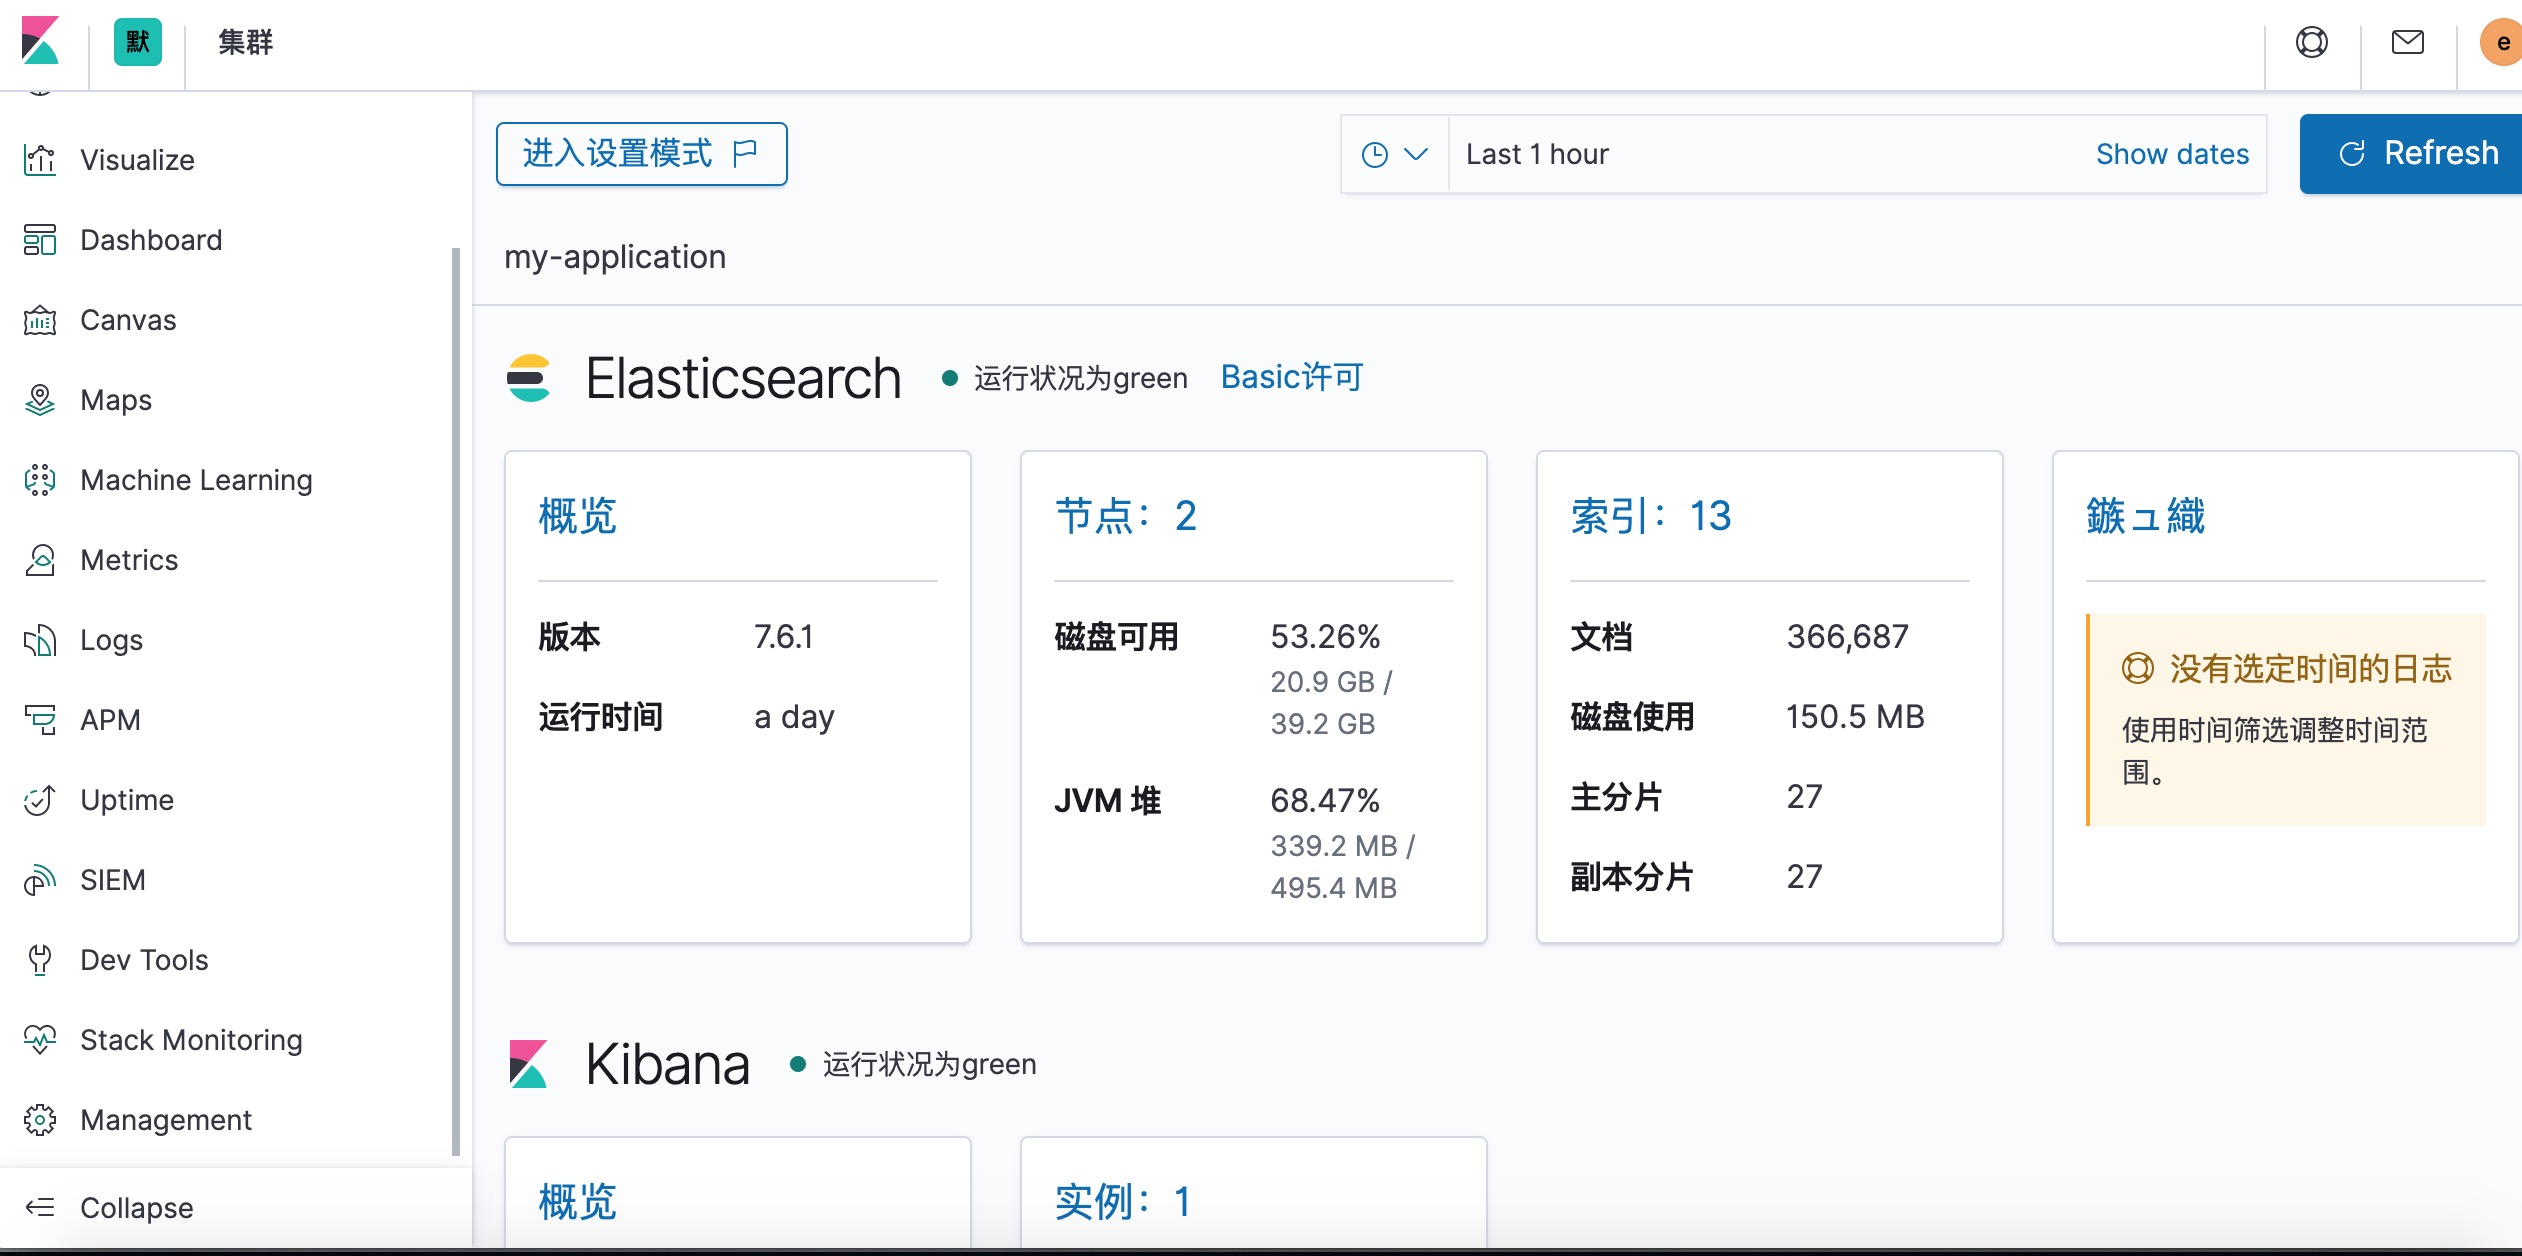
6、概览中包含了,
反映查询指标:搜索率、搜索延迟、
反映插入指标:索引率、索引延迟
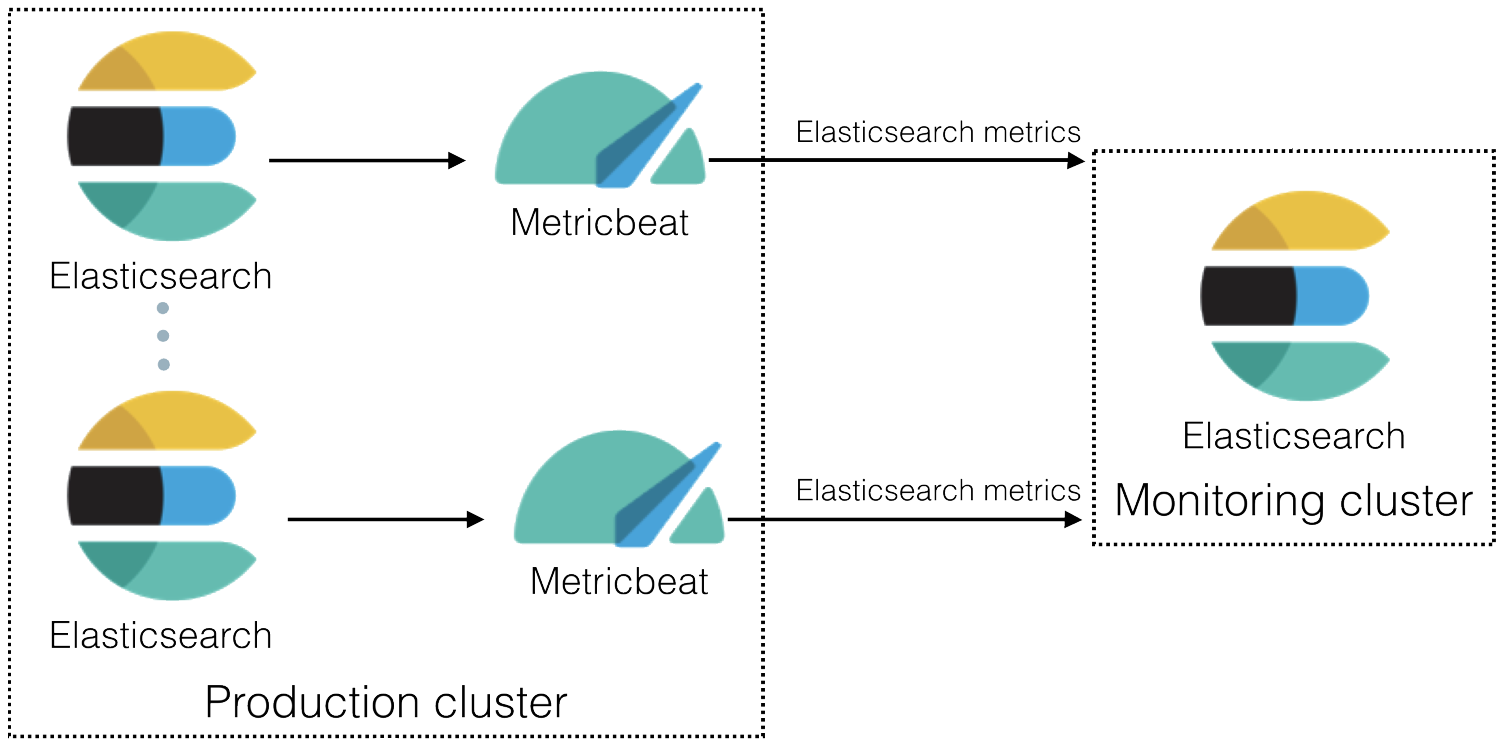
使用Metricbeat收集监视数据(推荐)
在6.5及更高版本中,可以使用Metricbeat收集有关Elasticsearch的数据并将其发送到监视集群,而不是按照Legacy收集方法中所述通过导出器进行路由。
流程:
1、启用监视数据收集。
在生产集群上设置xpack.monitoring.collection.enabled为true。默认情况下,它是禁用的(false)。
1 GET _cluster/settings
2
3 PUT _cluster/settings
4 {
5   "persistent": {
6     "xpack.monitoring.collection.enabled": true
7   }
8 }
2、在生产集群中的每个Elasticsearch节点上安装Metricbeat。
3、在每个Elasticsearch节点上的Metricbeat中启用Elasticsearch X-Pack模块。
例如,要在modules.d目录中启用默认配置,请运行以下命令:
命令:metricbeat modules enable elasticsearch-xpack
4、在每个Elasticsearch节点上的Metricbeat中配置Elasticsearch X-Pack模块。
编辑modules.d/elasticsearch-xpack.yml文件,设置:
命令:vim modules.d/elasticsearch-xpack.yml
 1   - module: elasticsearch
 2     metricsets:
 3       - ccr
 4       - cluster_stats
 5       - index
 6       - index_recovery
 7       - index_summary
 8       - ml_job
 9       - node_stats
10       - shard
11       - enrich
12     period: 10s
13     hosts: ["http://localhost:9200"]
14     #username: "user"
15     #password: "secret"
16     xpack.enabled: true
5、可选:在Metricbeat中禁用系统模块。
命令:metricbeat modules disable system
6、确定将监视数据发送到哪里。编辑metricbeat.yml文件
命令:vim metricbeat.yml
1 output.elasticsearch:
2   # Array of hosts to connect to.
3   hosts: ["http://es-mon-1:9200", "http://es-mon2:9200"]
4
5   # Optional protocol and basic auth credentials.
6   #protocol: "https"
7   #username: "elastic"
8   #password: "changeme"
7、启动metricbeat程序,ES增加索引:.monitoring-es-7-mb-2020.06.28

8、在kibana监控中,查看监控信息
